
Abstract
Background
Bone turnover markers (BTMs) may provide insight into bone health in young women, but have been little studied in this demographic. We aimed to explore the association between body composition, hormonal contraception, bone mineral density and biochemical parameters and BTMs in young women.
Methods
Participants were community-dwelling females aged 16–25 years, living in Victoria, Australia. Carboxy-terminal cross-linking telopeptide of type 1 collagen (CTX) and total procollagen type 1 N-propeptide (P1NP) were analysed on the Roche Elecsys automated analyzer. A total of 305 were evaluated, after excluding participants with medical conditions or medications (except hormonal contraceptives), which may affect bone metabolism.
Results
Median (Q1, Q3) BTM values were 540 (410, 690) ng/L for CTX and 61.7 (46.2, 83.7) µg/L for P1NP. Serum CTX and P1NP were inversely associated with chronological age (P < 0.001), transferrin (P < 0.020) and serum dehydroepiandrosterone sulphate concentration (P < 0.001). BTM values were up to 22% lower in combined oral contraceptive (COC) pill users (P < 0.001). Serum CTX was inversely associated with per cent body fat (P = 0.009) and tibial cortical volumetric bone mineral density (vBMD; P = 0.003). Serum P1NP concentrations were 23 µg/L higher in participants who reported using an osteopath in the previous year (P = 0.007).
Conclusions
These data suggest that BTMs are influenced by age, COC use, body composition, iron status and hormonal profiles. Higher CTX values were associated with lower tibial cortical vBMD. Examining BTMs in relation to interventions aimed at improving bone health in young women is warranted.
Keywords
Introduction
Bone is a dynamic tissue in a constant state of remodelling. In healthy adults, bone resorption is tightly coupled with bone formation. Bone turnover in younger premenopausal women reflects both modelling and remodelling, compared with older women where bone turnover is predominantly a reflection of the latter.
Bone histomorphometry is used to assess bone metabolism, but is invasive, expensive, and therefore impractical in a clinical setting. 1 Bone turnover markers (BTMs) are minimally invasive, widely available and relatively inexpensive to measure. BTMs reflect the real-time rate of change of the entire skeleton and complement information provided by dual-energy X-ray absorptiometry (DXA), the current gold standard in assessing bone health. BTMs have been shown to be predictive of bone mineral density (BMD) in pre- and postmenopausal women. 2 Markers of bone resorption, such as carboxy-terminal cross-linking telopeptide of type 1 collagen (CTX), have been shown to be associated with fracture risk independently of BMD in postmenopausal women.3,4 Consequently, BTMs are an important tool in the diagnosis, monitoring and treatment of metabolic bone disorders.
In women with postmenopausal osteoporosis, antiresorptive treatment targets for BTMs are determined from studies involving premenopausal women. 5 Despite similar design and analytical methods, studies examining age-specific reference ranges tend to produce differing mean values and normative ranges, suggesting that factors such as environment, behaviour and/or lifestyle are responsible for BTM variation. 6 BTMs have been shown to be associated with factors including: age, hormonal contraceptive use, country where data were collected, physical activity, smoking status, alcohol consumption and body composition in premenopausal women.7–11 Moreover, correlations with biochemical parameters [25-hydroxyvitamin D (25OHD), parathyroid hormone (PTH), dehydroepiandrosterone sulphate (DHEAS), insulin-like growth factor-1 (IGF-1) and iron status] suggest that these parameters may directly or indirectly affect bone.10,12,13
It is uncertain whether the factors that influence BTMs in younger women differ from those in older premenopausal and/or postmenopausal women. Understanding the determinants of bone turnover is crucial for the optimal appreciation of determinants of bone accrual and maintenance in adolescents and young adults, and therefore for considering osteoporosis risk in later life. Therefore, the main objective of this study was to examine the determinants of BTMs, CTX and total procollagen type 1 N-propeptide (P1NP), in 16–25-year-old women. Extensive clinical and lifestyle data were collected as part of the Safe-D study and provided an excellent opportunity to investigate a wide range of BTM determinants in young women, an understudied demographic in the field of musculoskeletal health.14,15
Materials and methods
Study participants and procedures
Study methods have been described previously.14,15 Briefly, participants were young women aged 16–25 years participating in part A of the Safe-D study, a cross-sectional study investigating associations between vitamin D status and related health in young women living in Victoria, Australia. Participants completed an extensive, online questionnaire, wore an ultraviolet (UV) dosimeter for two weeks and attended a site visit. Participants were excluded from analyses if they provided incomplete medical records, had abnormal pathology results (estimated glomerular filtration rate [eGFR] <60 mL/min/1.73 m2, corrected calcium >2.60 mmol/L or <2.10 mmol/L, thyroid-stimulating hormone [TSH] <0.35 mIU/L or C-reactive protein (CRP) >10 mg/L), were pregnant or lactating, reported amenorrhoea greater than 12 months, reported medical conditions which affect bone health (e.g. type 1 or 2 diabetes mellitus, hyperthyroidism, hypothyroidism, hyperparathyroidism, cystic fibrosis, celiac disease, Crohn’s disease, anorexia or other malabsorption conditions) or reported medication use which affects bone health (prednisolone, antiepileptic drugs, lithium carbonate, methotrexate, antiandrogens, antipsychotics, adalimumab and proton pump inhibitors). Participants using depot medroxyprogesterone acetate, progesterone only pill or the etonogestrel implant were excluded. The study was approved by Melbourne Health Human Research Ethics Committee, Victoria, Australia (project number 2013.007).
Lifestyle factors and demographics
Participants self-reported the following factors: demographics, medical history, health service use, menarche, menstrual cycle history, smoking status, calcium intake, hormonal contraception, alcohol consumption, sun exposure and physical activity. Site visit date and date of last period were collected to estimate menstrual cycle phase. A physical activity score was calculated from questions about frequency and duration of walking, moderate and vigorous activity in the previous week. A binary variable was created for binge drinking which was defined as >4 standard drinks on a particular occasion in the previous year. Alcohol consumption in grams per day was also assessed using the Cancer Council Victoria food frequency questionnaire.16 Objective sun exposure was measured using UV dosimeters developed at the National Institute of Water and Atmospheric Research in New Zealand (manufactured by Scienterra, New Zealand). An average daily standard erythemal dose (SED) was calculated from dosimeter data (1 SED = 100 J/m2).
Markers of bone turnover and other biochemistry
Blood was collected between 8 a.m. and 11 a.m. after an overnight fast (minimum of 8 h). Samples were processed and tested within 1–2 h of collection. If not tested in real-time, samples were stored at −80℃ until they were assayed. Serum CTX, total P1NP and oestradiol were measured using the Roche Cobas e411 automated analyzer (Roche Diagnostics GmbH, Mannheim, Germany). Serum CTX had a coefficient of variation (CV) of 5.5% at 342 ng/L and 4.2% at 787 ng/L. Serum P1NP had a CV of 5.2% at 40.2 µg/L and 4.5% at 222.6 µg/L. Oestradiol had a CV of 2.9% at 376.8 pmol/L. Due to the possibility of cross-reactivity with synthetic oestrogens and suppression of endogenous hormone production, descriptive statistics and further analysis involving reproductive hormones measured using the immunoassay were performed in participants not taking any form of hormonal contraception.
Serum total 25OHD was measured using liquid chromatography-tandem mass spectrometry (LC-MS/MS) at VivoPharm Laboratories (Melbourne, Australia). The CV for 25OHD3 was 1.6% at 73 nmol/L and 4.9% at 21 nmol/L for 25OHD2. Serum PTH and reproductive hormones were measured using the Abbott ARCHITECT i2000 SR immunoassay and serum biochemistry was measured using the Abbott ARCHITECT c16000 integrated system (Abbott Diagnostics, Abbott Park, IL, USA). The Chronic Kidney Disease Epidemiology Collaboration (CKD-EPI) formula was used to estimate eGFR. The CV for PTH was 4.7% at 2.9 pmol/L; 3.7% for TSH at 0.5 mIU/L; 7.4% for progesterone at 2.1 nmol/L; 5.9% for testosterone at 6.4 nmol/L; 5.0% for luteinizing hormone (LH) at 1.1 IU/L; 3.2% for follicle-stimulating hormone (FSH) at 6.1 IU/L; 5.1% for sex hormone-binding globulin (SHBG) at 73.5 nmol/L; 4.6% for DHEAS at 3.9 µmol/L; 6.0% for prolactin at 136 mIU/L; 3.6% for iron at 11.5 µmol/L; 1.9% for transferrin at 2.5 g/L; 5.3% for ferritin at 62.0 µg/L.
Bone balance index
A bone balance index (BBI) was created as previously described.
17
CTX and P1NP values were log-transformed initially to achieve normality then manipulated as follows:
Log-CTX was regressed on log-P1NP This regression was used to predict CTX values (CTXp) A raw BBI value was created for each participant (CTXp−CTX) BBI values were standardized by dividing raw BBI values by the standard deviation (SD) of the raw BBI values.
Examination of the BBI and its potential determinants was exploratory in nature as there is currently only one group that has described its derivation and associations with bone outcomes. Shieh et al. 17 demonstrated that the BBI was higher (i.e. more favourable) in females with a higher BMI and lower in females closer to their final menstrual period. Each standard deviation decrement in the BBI was also shown to be associated with a 0.27% per year faster loss in lumbar spine (LS) areal bone mineral density (aBMD) and a 38% increase in the likelihood of having a faster-than-average bone loss at the LS.
Bone mineral density
Areal BMD (aBMD) and soft-tissue composition was measured using DXA (QDR 4500A densitometer, Hologic Inc., Bedford, MA, USA) at the LS (L1–L4), right total hip (unless metal prosthesis was present) and femoral neck (FN). Scans were analysed with QDR software version 9.1D. Low aBMD was defined as a BMD Z-score < −2.0. Peripheral quantitative computed tomography (pQCT; XCT 3000, Stratec Medizintechnik GmbH, Pforzheim, Germany) was performed at the distal tibia (at the 4% site of the tibial length proximal to the distal end plate) and at the tibial shaft (66% site) of the non-dominant leg.
Statistical analysis
Lowess curves were used to examine BTM patterns in relation to continuous variables considered as potential determinants. Univariate analyses were performed to look for significant correlations between BTMs and potential determinants. The results of these analyses determined which factors would be included in multivariate modelling, and results of the multivariate models were considered the main outcomes for the purpose of this study. BTM data were positively skewed; therefore, gamma regression models were used to check whether associations with BTMs were independent of variables such as age and combined oral contraceptive pill (COC) use. Associations between BBI values and continuous variables were assessed using linear regression, while associations with categorical data were assessed using Student’s t-test. All statistical analyses were performed using StataSE 13 (StataCorp, TX, USA). A P-value of less than 0.05 was considered statistically-significant.
Results
Site visits were conducted between April 2014 and November 2015. BTM results were available for 406 participants and 101 participants were excluded based on the previously discussed criteria. Fifty-five per cent (n = 168) of samples were stored and tested within 11–374 days of collection (mean 222 ± 101 days). We found no association between BTM values and storage time (CTX: P = 0.307; P1NP: P = 0.087). Median (Q1, Q3) CTX concentrations were 540 ng/L (410, 690 ng/L) and 61.7 µg/L (46.2, 83.7 µg/L) for P1NP. CTX and P1NP were strongly associated with each other (rho = 0.67, P < 0.001).
BTMs, participant demographics and lifestyle factors
Descriptive summary of Safe-D study participant characteristics (n = 305).
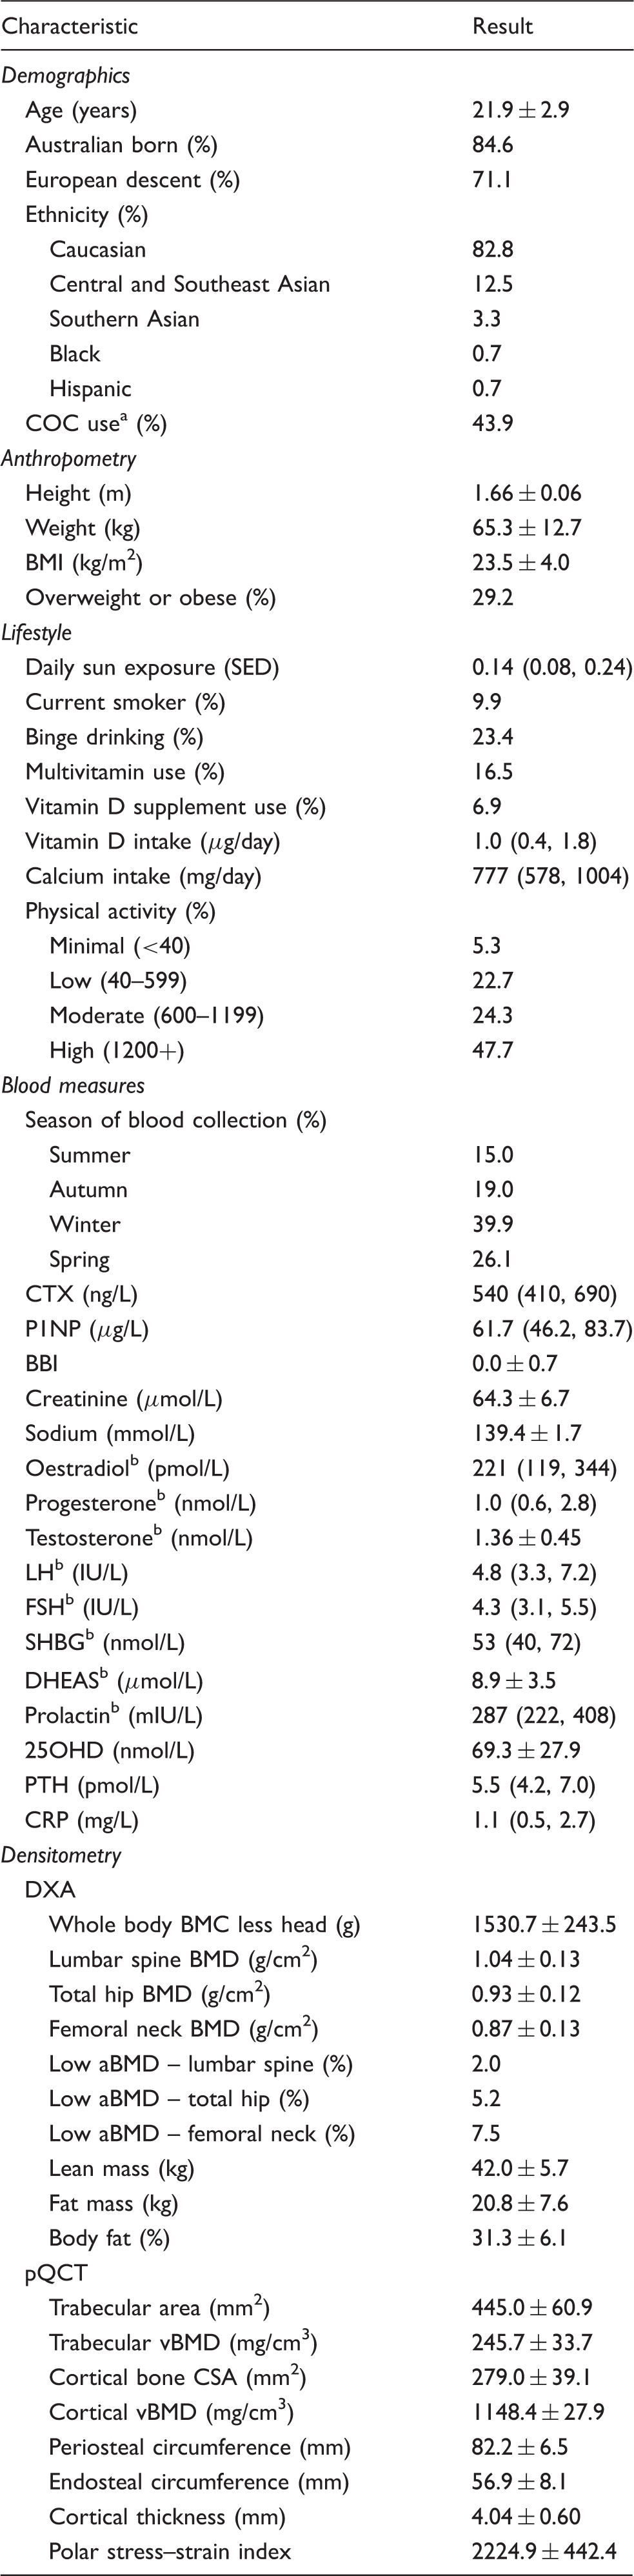
Note: Data presented as mean ± SD, median (interquartile range) or proportion (%).
25OHD: 25-hydroxyvitamin D; aBMD: areal bone mineral density (low aBMD defined as a BMD Z-score <−2.0); BBI: bone balance index; BMC: bone mineral content; BMD: bone mineral density; BMI: body mass index; COC: combined oral contraceptive pill; CRP: C-reactive protein; CSA: cross-sectional area; CTX: carboxy-terminal cross-linking telopeptide of type 1 collagen; DHEAS: dehydroepiandrosterone sulfate; DXA: dual-energy X-ray absorptiometry; FSH: follicle-stimulating hormone; LH: luteinizing hormone; P1NP: total procollagen type 1 N-propeptide; pQCT: peripheral quantitative computed tomography; PTH: parathyroid hormone; SED: standard erythemal dose; SHBG: sex hormone-binding globulin; vBMD: volumetric bone mineral density.
Ethinyl oestradiol dose was available for 119 participants (89%). Thirteen (11%) participants were taking a COC pill with 20 mg ethinyl oestradiol, 72 (60%) with 30 mg, 32 (27%) with 35 mg and 2 (2%) with higher doses.
Calculated in participants not using any form of hormonal contraception.
Serum CTX concentrations were higher in current smokers compared with non-smokers (625 [520, 820] ng/L vs. 530 [400, 670] ng/L, P = 0.023). The BBI was lower in current smokers compared with non-smokers (−0.25 ± 0.83 vs. 0.03 ± 0.71, P = 0.042). Neither BTM nor BBI values were associated with personal sun exposure, country of birth, European descent, ethnicity, physical activity score, alcohol consumption (grams per day or binge drinking), calcium intake, vitamin D supplementation, multivitamin or antidepressant use.
BTMs and health service use
Serum P1NP concentrations were higher in participants who reported consulting an osteopath at least once in the previous year [n = 25; 83.3 (54.2, 107.0) vs. 60.7 (45.8, 82.3) µg/L, P = 0.007]. This remained significant after adjustment for age, COC use, BMI and physical activity (P = 0.002). No difference in CTX was observed. BTM concentrations did not differ if a participant reported consulting a general practitioner, chiropractor, physiotherapist, fitness professional or massage therapist at least once in the previous year.
BTMs and anthropometry
Serum CTX was negatively associated with per cent body fat (rho = −0.15, P = 0.007) but was not associated with weight, BMI, fat or lean mass. The BBI was positively associated with per cent body fat (r = 0.18, P = 0.001), weight (r = 0.13, P = 0.029), BMI (r = 0.17, P = 0.003) and fat mass (r = 0.16, P = 0.005). The BBI was not associated with lean mass (P = 0.488). P1NP was not associated with any measures of body composition.
Serum P1NP concentrations were significantly higher (65.3 [48.0, 94.7] vs. 60.2 [45.5, 75.9] µg/L P = 0.019) in participants who reported that their weight had increased in the previous year (n = 152). This association remained significant after adjustment for age, COC use, BMI and physical activity (P = 0.009). No association was observed with CTX. No association was observed between BTMS and reporting a weight decrease.
BTMs and bone mineral density
Participants with low FN aBMD (Z-score < −2.0; n = 23) had significantly lower P1NP (median [IQR]: 48.7 [32.8, 61.8] vs. 62.6 [46.6, 84.5] µg/L, P = 0.002) and BBI values (−0.32 ± 0.78 vs. 0.03 ± 0.72, P = 0.029) compared with those with normal FN aBMD. No association was observed between low LS aBMD and P1NP, CTX nor the BBI (P = 0.146, P = 0.310 and P = 0.665, respectively). No association was observed between low total hip aBMD and P1NP, CTX nor the BBI (P = 0.382, P = 0.598 and P = 0.156, respectively). No other associations were observed between CTX, P1NP or BBI and aBMD as a continuous variable at any of the sites measured, nor with whole body BMC (P > 0.300 for all analyses). Serum CTX and P1NP were negatively associated with cortical volumetric BMD (vBMD) at the tibial shaft (CTX: rho = −0.23, P < 0.001, see Figure 1; P1NP: rho = −0.18, P = 0.002). The BBI was positively associated with cortical vBMD (r = 0.18, P = 0.002). Neither the BTMs, nor the BBI, were associated with other pQCT bone measures.
Relationship between CTX (left) or P1NP (right) and cortical vBMD.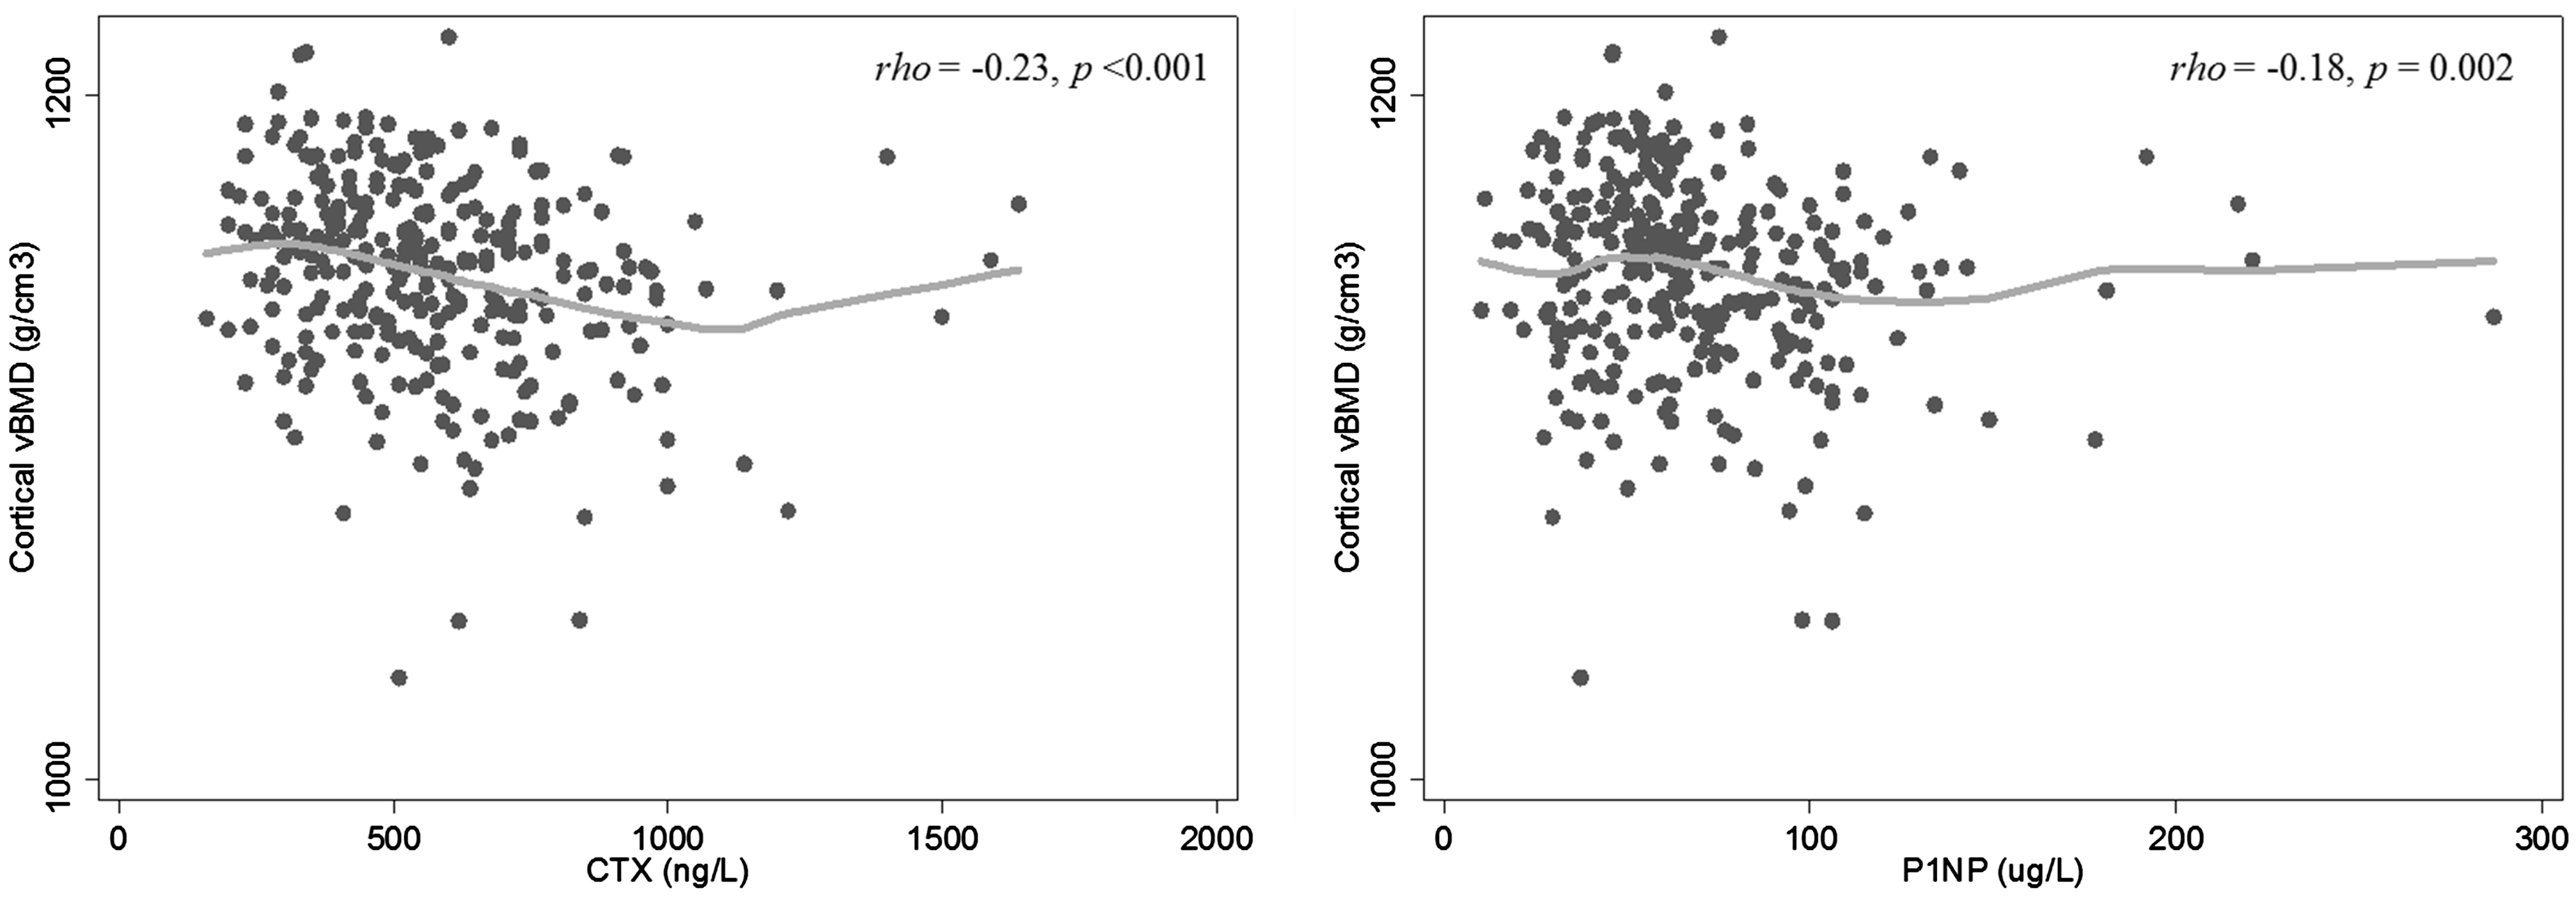
BTMs, vitamin D status and other pathology markers
Mean (±SD) serum 25OHD was 69.3 ± 27.9 nmol/L. Twenty-two per cent (n = 68) of participants had concentrations between 25 and 50 nmol/L and 3% (n = 10) had 25OHD <25 nmol/L. Seasonal variation was seen in 25OHD, PTH and CTX concentrations. Mean 25OHD concentrations were 23% lower in winter (58.9 ± 22.0 nmol/L) compared with other seasons (76.2 ± 29.3 nmol/L; P < 0.001). Median (IQR) PTH concentrations were 5.7 (4.6, 7.4) pmol/L in winter/spring compared with 5.0 (3.9, 6.2) pmol/L in summer/autumn (P < 0.001). Median (IQR) CTX concentrations were 510 (370, 600) ng/L in winter compared with 570 (430, 720) ng/L in other seasons (P = 0.001). The BBI was 0.16 ± 0.70 in winter compared with −0.11 ± 0.73 in other seasons (P = 0.002). P1NP showed no seasonal variation.
Neither CTX nor P1NP was associated with serum 25OHD or vitamin D deficiency (VDD; serum 25OHD concentrations ±50 nmol/L). An inverse trend was seen between BBI and 25OHD (r = −0.10, P = 0.094). No association was seen between the BBI and VDD. Serum CTX was positively associated with serum sodium concentration (r = 0.18, P = 0.003), while BBI demonstrated a negative association (r = −0.16, P = 0.012). Neither BTM nor the BBI was associated with serum CRP, creatinine or calcium corrected for albumin.
BTMs and iron studies
The prevalence of iron deficiency (serum ferritin <15 µg/L) was 21%; neither BTM nor the BBI was associated with iron deficiency (CTX: P = 0.060; P1NP: P = 0.353; BBI: P = 0.150). Serum CTX and P1NP were inversely associated with transferrin (CTX: rho = −0.29; P1NP: rho = −0.25; P < 0.001 for both markers) and total iron-binding capacity (TIBC; CTX: rho = −0.29; P1NP: rho = −0.25; P < 0.001 for both markers). Both transferrin and TIBC were positively associated with CRP concentrations (rho = 0.32 and P = 0.001 for both analyses). The association between CTX and transferrin remained significant after adjustment for COC use and CRP (β = −0.174, P = 0.003), but was no longer significant for TIBC (P = 0.143). Serum P1NP was no longer associated with transferrin nor TIBC after adjustment for COC use and CRP (P = 0.125 and P = 0.143, respectively). The BBI was positively associated with transferrin (r = 0.19, P = 0.002) and TIBC (r = 0.19, P = 0.002). The BBI remained associated with transferrin (β = 0.302, P = 0.007) and TIBC (β = 0.012, P = 0.007) after adjustment for COC use and CRP. No association was seen with either BTM or the BBI and ferritin, iron or transferrin saturation.
BTMs and hormonal determinants
BTMs were lower in COC users compared with non-users (CTX: 470 [350, 620] ng/L in COC users vs. 580 [470, 730] ng/L in non-users; P1NP: 52.6 [36.1, 71.7] µg/L in COC users vs. 67.2 [55.2, 92.4] µg/L in non-users; P < 0.001 for both markers]). The BBI was not associated with COC use (0.07 ± 0.71 in users vs. −0.06 ± 0.74 in non-users, P = 0.131). Neither BTM nor the BBI was associated with PTH or TSH concentrations (P > 0.4 for both hormones).
In participants not using hormonal contraception (n = 168), serum CTX and P1NP concentrations were associated with DHEAS (CTX: rho = −0.20, P = 0.013; P1NP: rho = −0.27, P = 0.001; see Figure 2). Serum CTX remained significantly associated with DHEAS after adjustment for age, season, per cent body fat and current smoking status (β = −0.03, 95% CI −0.04 to −0.01, P = 0.003). Similarly, P1NP remained significantly associated with DHEAS after adjustment for age (β = −0.03, 95% CI −0.06 to −0.02, P < 0.001). The BBI was not associated with DHEAS (P = 0.548). Neither the BTMs nor the BBI were associated with oestradiol, testosterone, prolactin, LH or FSH concentrations. A positive trend was observed between the BBI and oestradiol concentrations (r = 0.16, P = 0.052). No association was found between BTMs and days since previous menses or menstrual cycle phase (days 0–14 compared with days 15–35).
Relationship between CTX (left) or P1NP (right) and DHEAS concentrations.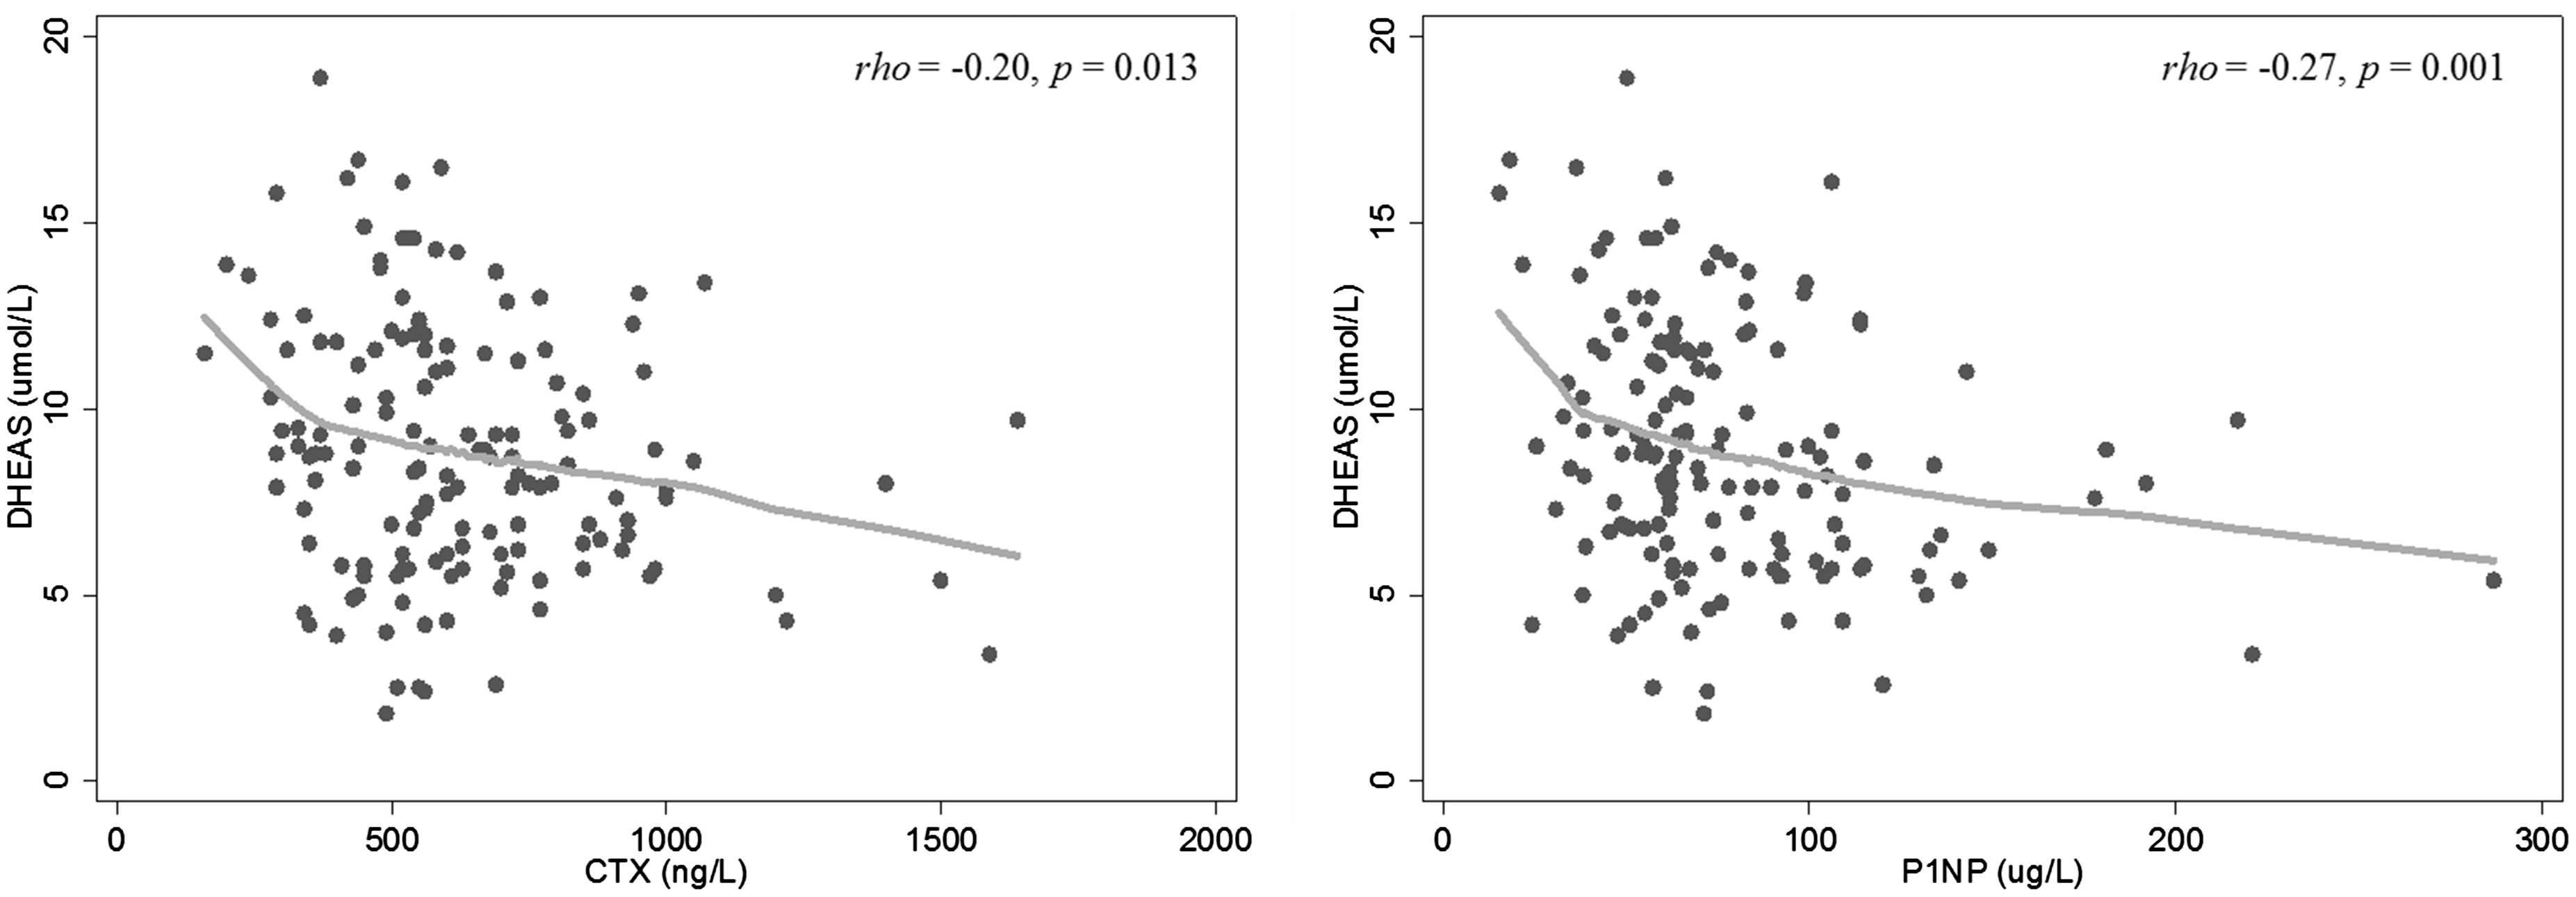
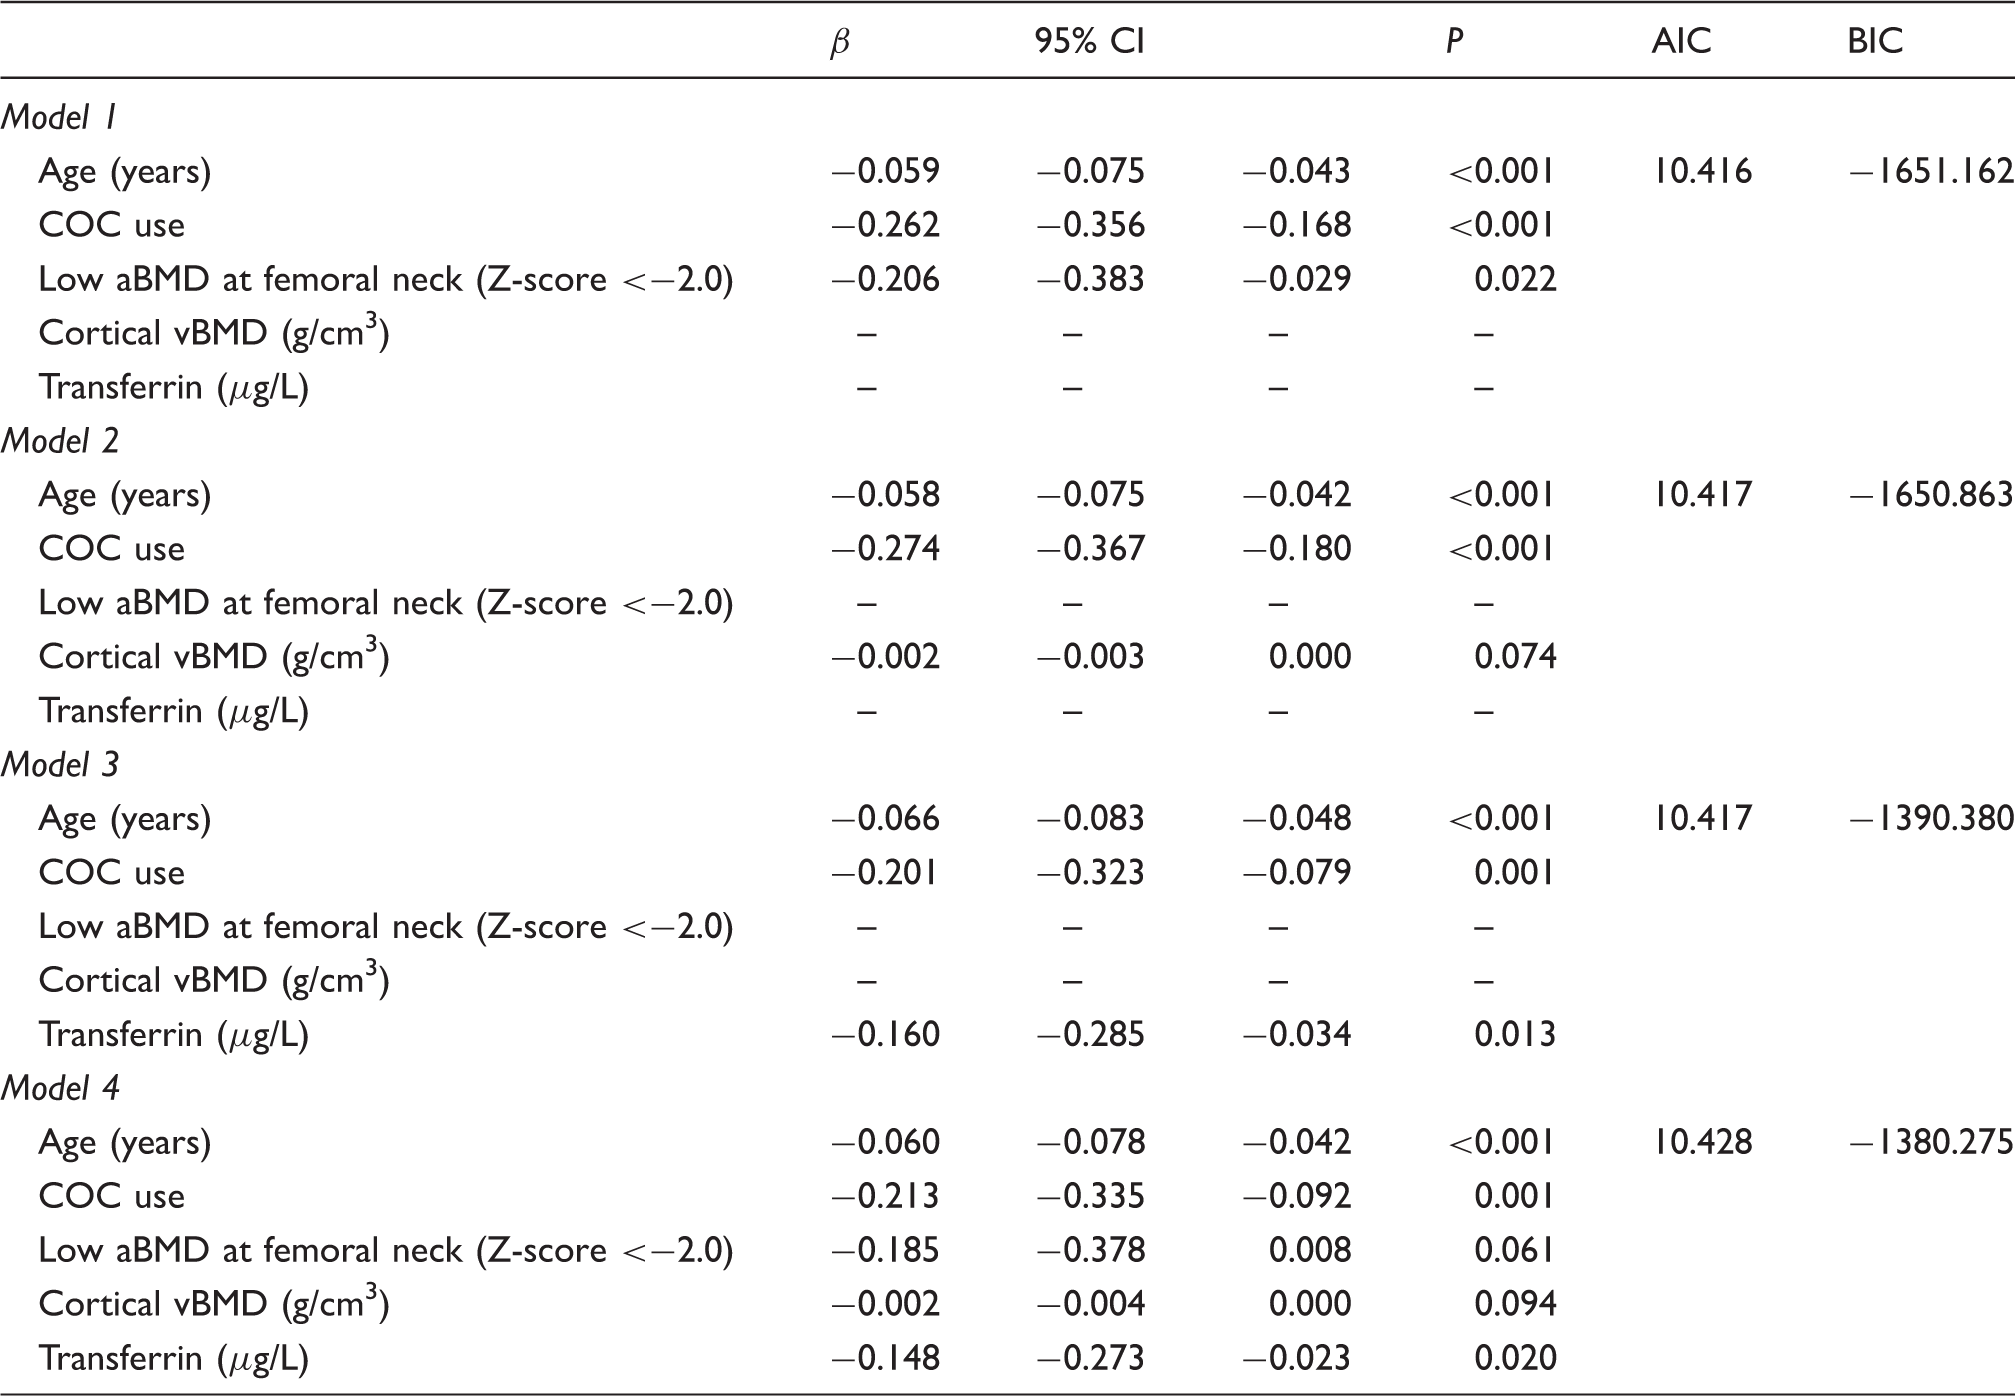
BTM multivariate analysis
Gamma regression models assessing factors affecting CTX.
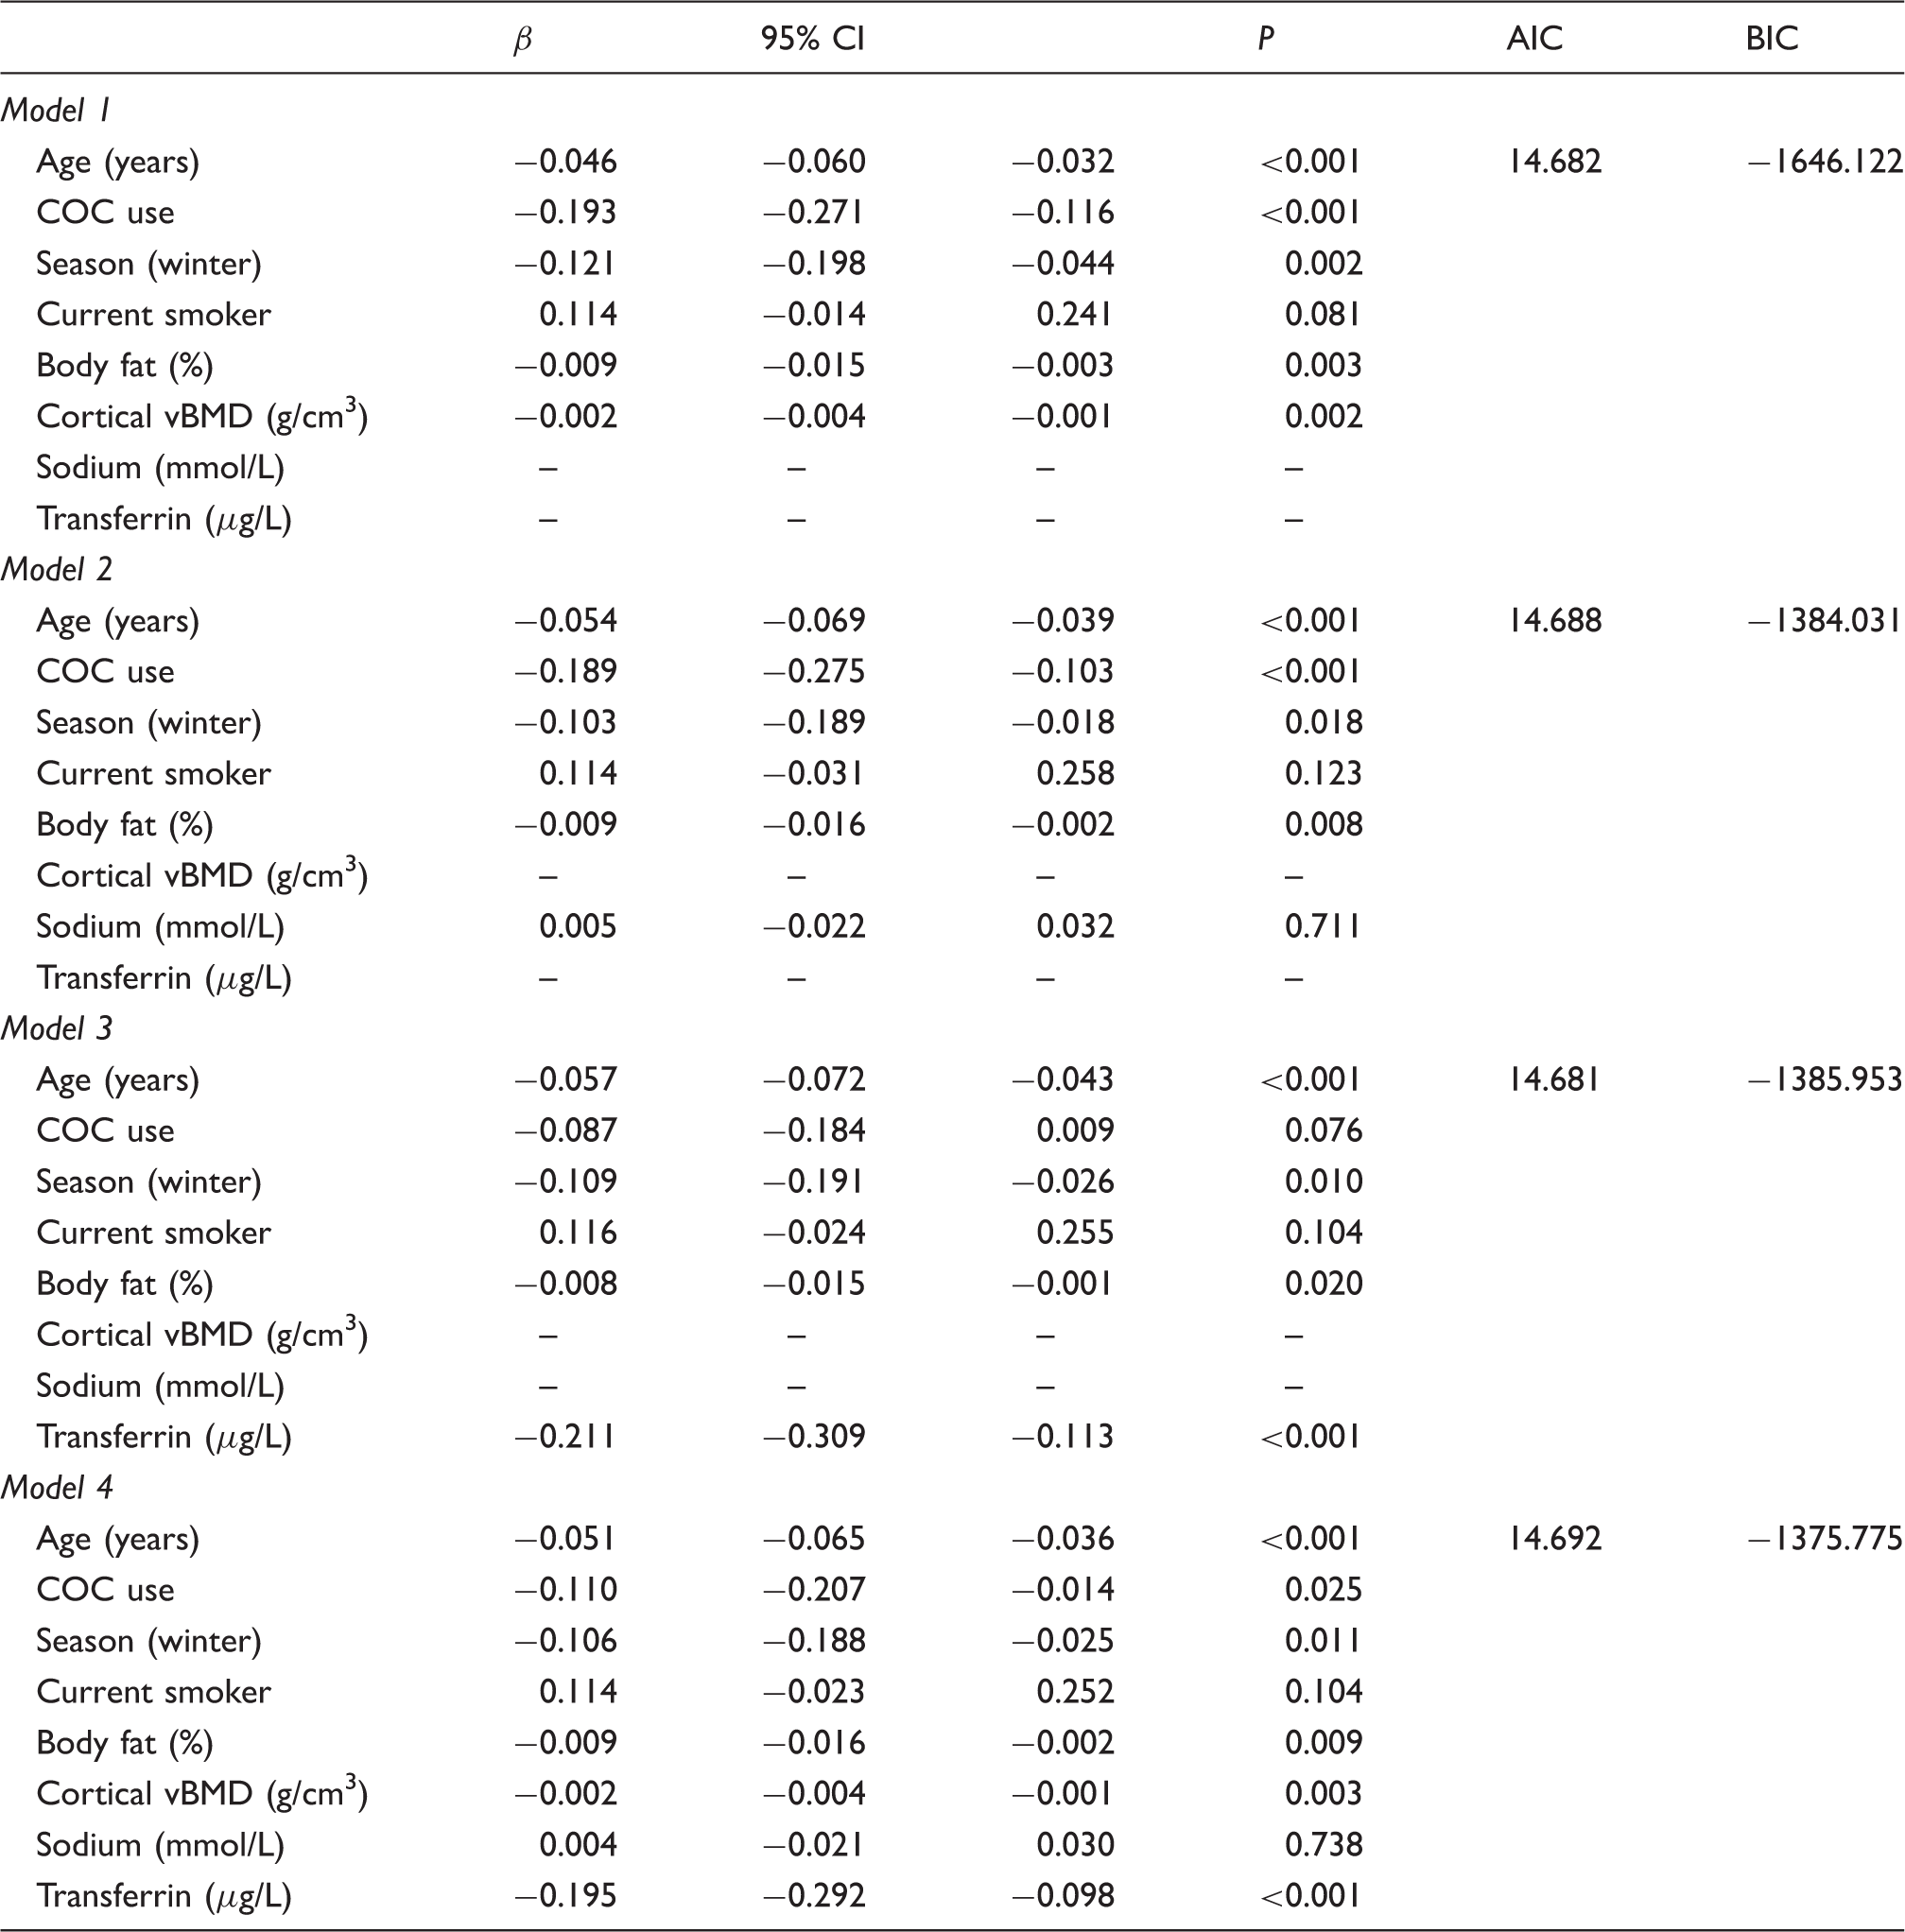
β: regression coefficient; AIC: Akaike information criterion; BIC: Bayesian information criterion; CI: confidence interval; COC: combined oral contraceptive pill; vBMD: volumetric bone mineral density.
Gamma regression models assessing factors affecting P1NP.
aBMD: areal bone mineral density; β: regression coefficient; AIC: Akaike information criterion; BIC: Bayesian information criterion; CI: confidence interval; COC: combined oral contraceptive pill; vBMD: volumetric bone mineral density.
Regression models assessing factors associated with BBI.
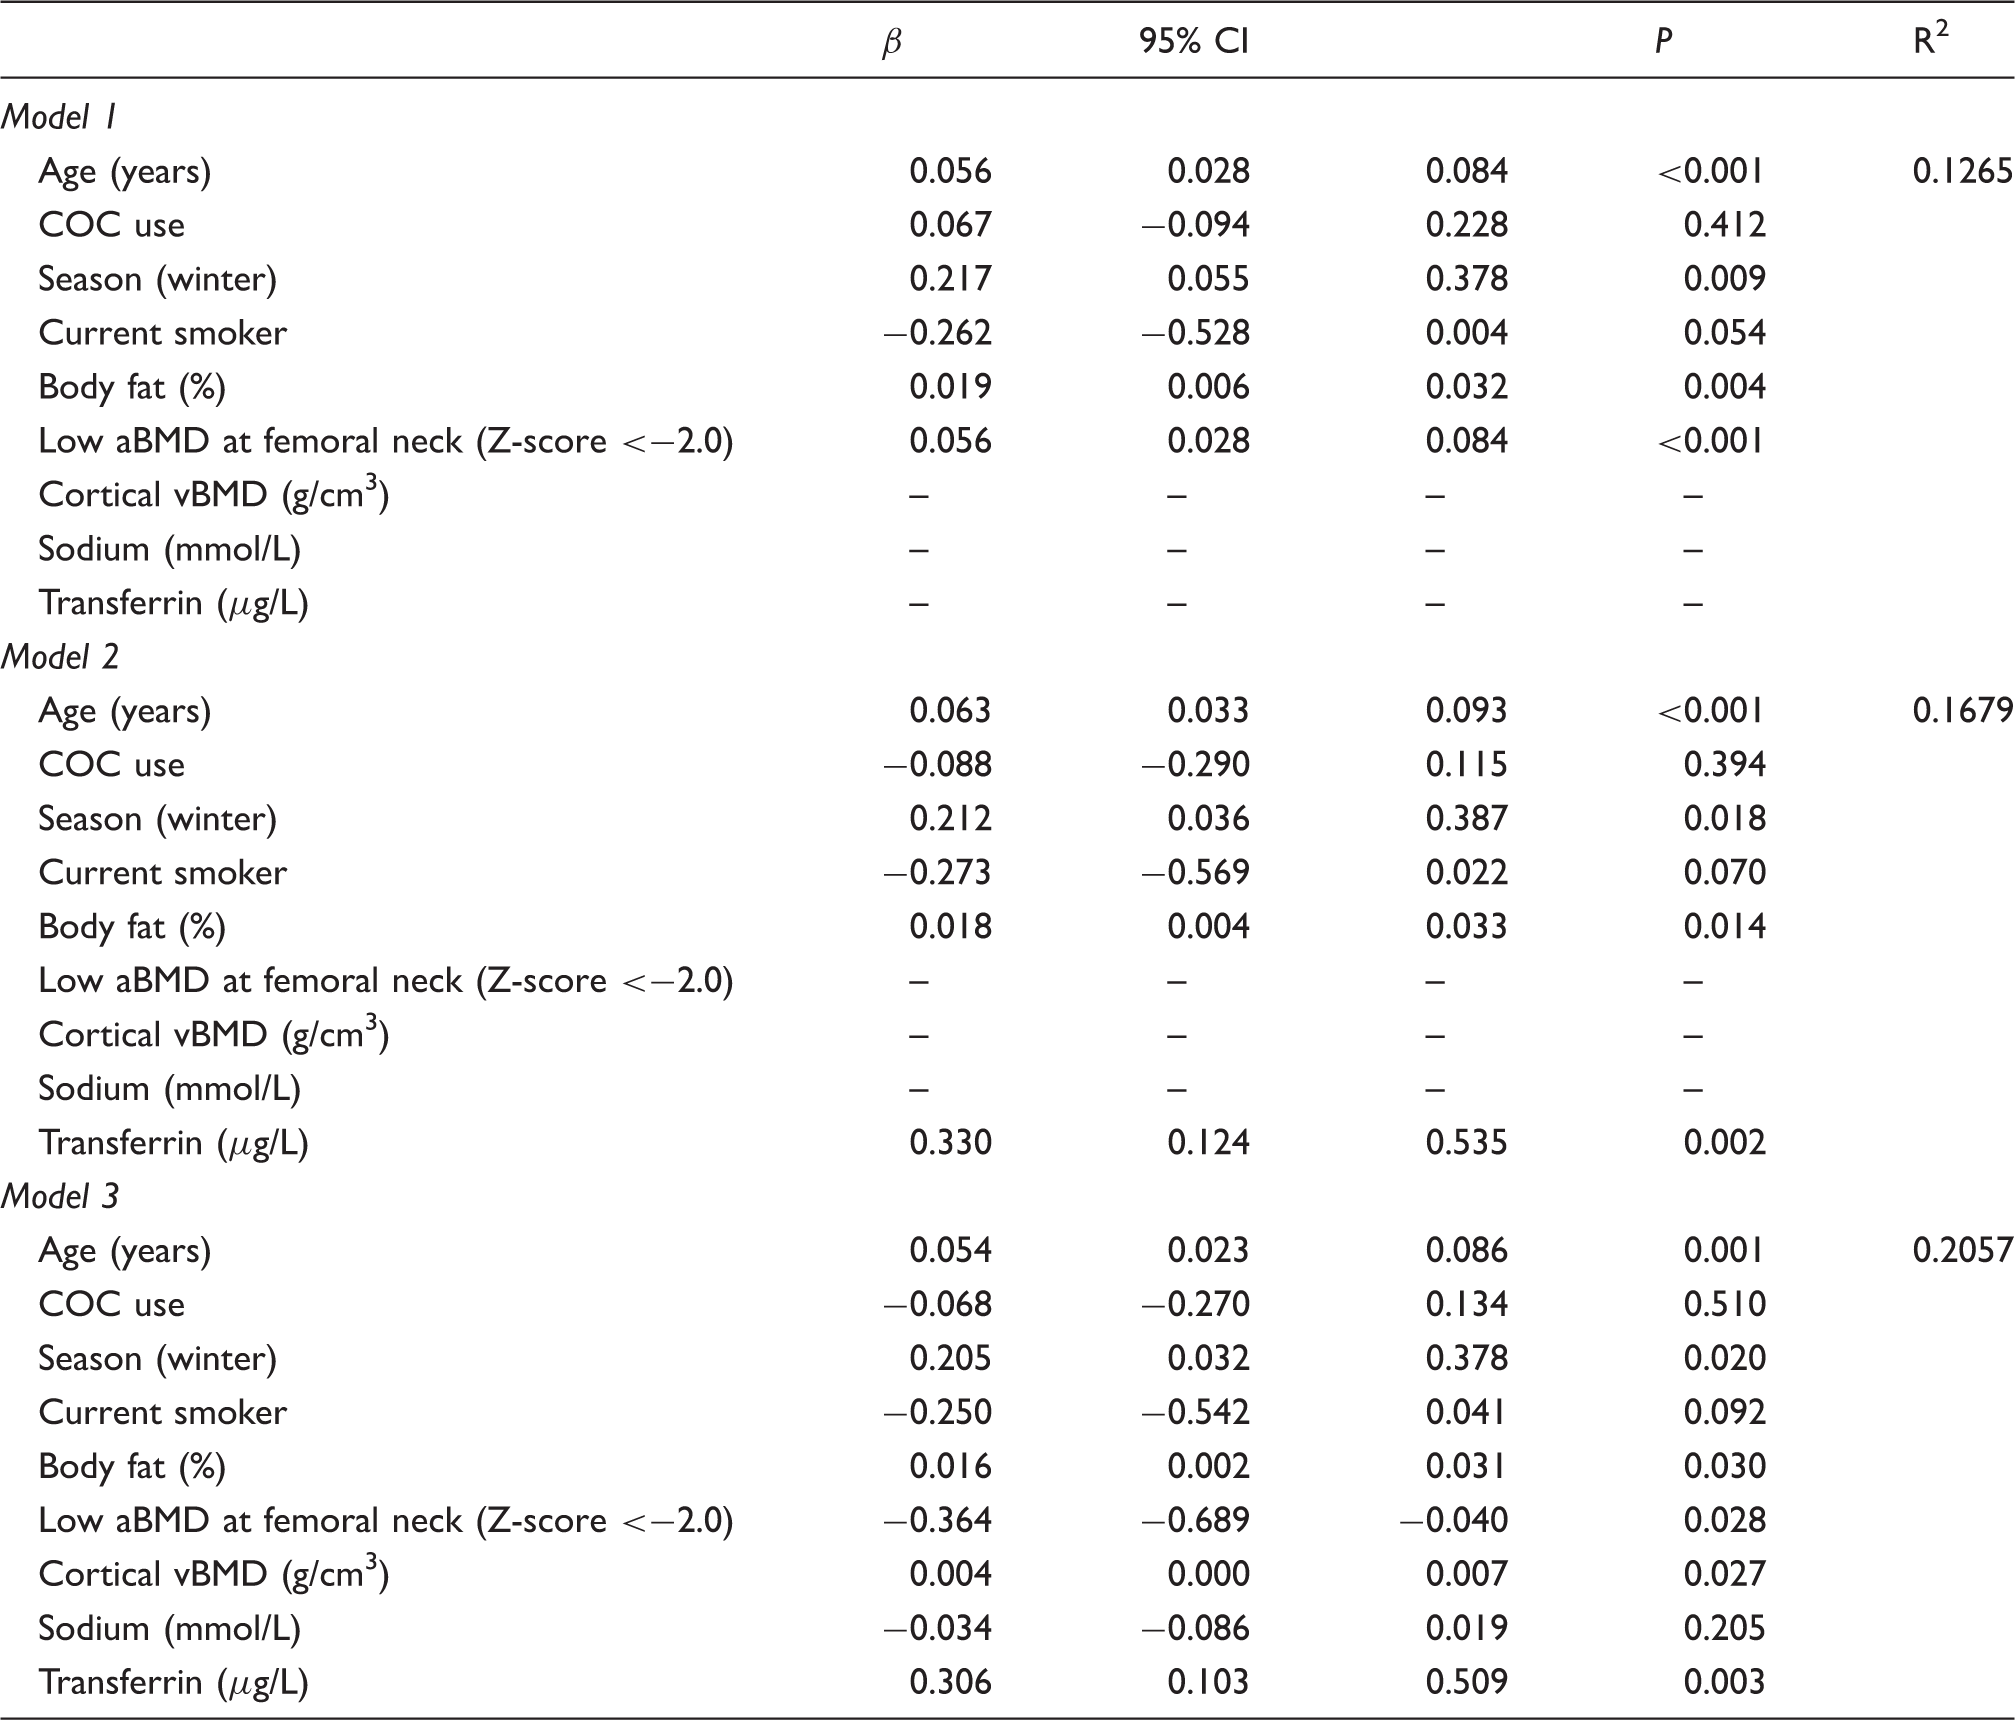
aBMD: areal bone mineral density; β: regression coefficient; AIC: Akaike information criterion; BBI: bone balance index; BIC: Bayesian information criterion; CI: confidence interval; COC: combined oral contraceptive pill; vBMD: volumetric bone mineral density.
Discussion
The need for a greater understanding of physiological and preanalytical factors contributing to BTM variation has been recently highlighted. 18 Furthermore, Weaver et al. emphasized that the period of late adolescence to early adulthood was an understudied demographic in regards to bone health. 19 The current study has addressed this important research deficit. We explored potential associations between BTMs, CTX and P1NP, and an extensive range of demographic, lifestyle and clinical factors in healthy adolescent and young adult women. We used Facebook advertising, a novel recruitment method, to engage a broadly representative sample of young women. 14 The factors most strongly associated with bone turnover (i.e. the BBI) in young women were age, followed by per cent body fat, season (winter) and transferrin. These data will complement the interpretation and clinical utility of BTM measurement in young women, in addition to improving our understanding of the attainment of peak bone mass and the prevention of bone loss.
Our recent results, which were concordant with previous literature, demonstrated that age, years since menarche and COC use were negatively associated with CTX and P1NP.7,11,14 Unexpectedly, we found that participants who had reported seeing an osteopath at least once in the previous year had ∼23 µg/L higher P1NP than those who did not, even after adjusting for relevant covariates. Those utilizing osteopathic services may have had an existing musculoskeletal problem which may be associated with increased BTMs or alternatively; these individuals may be more athletic and therefore have superior musculoskeletal health. We found no association between BTMs and physical activity levels (overall or vigorous activity) but the questionnaire also did not differentiate between weight-bearing and non-weight bearing activities and was limited to activity performed in the previous week. Nonetheless, it would be worthwhile investigating whether such an intervention is beneficial to longer-term bone health in young women.
Smoking and excessive alcohol consumption are known to have deleterious effects on bone.20,21 We found that CTX was 18% higher in current smokers compared with non-smokers. However, this difference was no longer significant after adjusting for relevant covariates. The lack of association between CTX and smoking status may be due to the low prevalence of current smoking in our cohort (10%). It is possible that the total number of cigarettes smoked and/or short total duration of smoking were insufficient to adversely affect BTMs. Glover et al. found CTX and P1NP concentrations were 8.3% higher in current female smokers aged 30–39 years compared with non-smokers. 10 Conversely, some studies have found no association.22,23 BTMs were not associated with alcohol intake (daily consumption or binge drinking) in this study. However, we weren’t able to assess the frequency of binge drinking. Studies have found weak or no association with alcohol consumption previously.7,9
Severe VDD leads to impaired bone mineralization, secondary hyperparathyroidism and high bone turnover. We found no association between BTMs and serum 25OHD, nor between BTMs and PTH, which is similar to several studies.8,22 The lack of association between BTMs and vitamin D status may be due to the low prevalence of severe VDD in this cohort (3% with serum 25OHD <25 nmol/L). In contrast, Glover et al. found inverse associations between serum 25OHD and bone formation markers (P1NP and bone alkaline phosphate [ALP]) in 30–39-year-old females. 10 Longitudinal studies of individuals with chronic VDD and/or vitamin D supplementation trials in healthy populations may be better suited to explore the relationship between vitamin D status, PTH and BTMs in premenopausal women. 24
Evidence concerning seasonal variation in BTMs has been inconsistent and there are limited data in the Southern Hemisphere.11,25,26 We found that CTX values were on average 60 ng/L lower in winter compared with other seasons. Meanwhile, Jenkins et al. found higher CTX values in winter Australians aged 20–97 years (n = 2389; 1246 females), which is likely a reflection of increased bone resorption in winter associated with VDD, and subsequent increases in PTH. 11 A higher CTX in seasons other than winter may reflect lifestyle and behavioural patterns of young women such as weight loss over the warmer months, acute and more frequent exercise, increased alcohol consumption and cigarette smoking or changes to dietary behaviours (e.g. energy or calcium intake).
A number of steroid-metabolizing enzymes (e.g. aromatase, 5α-reductase) are expressed in bone tissue, suggesting a role of androgens such as DHEAS in bone metabolism. 27 We found that DHEAS negatively correlated with CTX and P1NP in participants not using any form of hormonal contraception. Likewise, Walsh et al. found that DHEAS was negatively correlated with bone resorption marker N-terminal telopeptide of type 1 collagen (NTX), and P1NP in both males and females <25 years. 13 In girls with anorexia nervosa, DHEAS and CTX concentrations were found to be lower compared with matched healthy controls and both analytes positively correlated with BMI. 28 In our study, the CTX-DHEAS association was independent of body composition. The anorexia study also found that CTX was negatively correlated with DHEAS and with the osteoprotegerin (OPG)/soluble receptor activator of nuclear factor-κB ligand (sRANKL) ratio. A positive association was observed between CTX and sRANKL. Similar to our study, DHEAS and CTX were also found to be negatively correlated, suggesting that the association of DHEAS with bone resorption might be mediated by the RANKL/RANK/OPG system.
We found a negative association between CTX and body fat. The association persisted after adjustment for age, COC use, season and smoking status, supporting the notion that low body fat increases bone resorption during early adulthood. 29 A limitation of BMI is that it does not reliably distinguish between lean and fat mass. The usefulness of BMI in a young population may be hindered by potentially higher lean mass compared with older populations and this may be why we found no association between BTMs and BMI in the current study. 30 BMI has also been shown to significantly underestimate the prevalence of obesity compared with per cent body fat derived from DXA. 31 Previous BTM literature has mainly focused on associations with BMI and has consistently found an inverse relationship between CTX and BMI.9,32,33 A common mechanism used to explain the inverse association between improved bone (BMD or BTMs) and body composition is a greater gravitational load in that bone, suggesting that reduced bone resorption contributes to the mechanism of skeletal adaption to increased body weight. This concept is further supported by the association between reported weight increase and P1NP concentrations in our study. The higher CTX concentrations in women with low per cent body fat may also be explained by secondary amenorrhea/oligomenorrhea and subsequent low oestrogen state driven bone resorption. Adipokines produced by adipocytes, such as leptin, have more recently been shown to be predictive of CTX and bone specific ALP.34,35 High fat mass is associated with high sclerostin concentration, a potent inhibitor of bone formation. 36 The negative association seen between CTX and body fat is therefore likely explained by a combination of mechanical loading, oestrogen status, and cross-talk between bone and energy metabolism.
Serum CTX was negatively correlated with cortical vBMD, which has been previously demonstrated.37,38 The cortical vBMD measurement reflects both bone mineralization and porosity; therefore, high CTX or bone resorption reduces bone density by a) increasing the number and size of pores and/or b) pores being filled with younger, less mineralized bone matrix. Kemp et al. investigated single-nucleotide polymorphisms within key osteoclast regulatory genes in 1130 adolescents. 38 The authors concluded that individuals with a genetic predisposition to higher bone resorption have greater bone size, suggesting that higher bone resorption is due to greater periosteal expansion. We did not find any associations between CTX and bone cross-sectional area of the tibia, possibly due to the higher age range of our cohort or the smaller sample size. Although periosteal expansion slows significantly after puberty in females, this finding suggests that periosteal expansion may continue into early adulthood. 39 The biological significance of this finding warrants further investigation in a longitudinal setting. The measurement of BTMs in combination with assessment of BMD may form strategies to identifying individuals at risk of suboptimal peak bone mass attainment at an earlier age. By doing so, we may be better equipped to prevent bone deficits in later life.
The association between the BBI and low FN aBMD (see Table 4), together with the association between CTX and cortical vBMD implies that the BTMs associate more strongly with cortical bone measures. Compared with the femoral neck, the vertebral bodies contain a higher percentage of trabecular bone. The absence of an association between BTMs and low LS aBMD, together with the lack of correlation between BTMs and pQCT trabecular bone measures further supports the association between BTMs and cortical bone. This could be due to the small percentage of participants with low LS aBMD (2.0%) or because trabecular bone only comprises approximately 20% of skeletal mass, compared with cortical bone. 40 Nearly 30% of the participants were overweight or obese. Obese adults have previously been shown to have higher trabecular BMD and trabecular number measured using high resolution pQCT, compared with normal adults, which could potentially influence the relationship between BTMs and trabecular bone measures. 33 We acknowledge that the application of Hologic reference data to calculate Z-scores in young Australian women is an intrinsic limitation of bone research conducted outside of the United States of America and may result in unexpected prevalence rates of low aBMD as defined in the current study. It highlights the need for an Australian-based reference dataset in both young women and older adults. To strengthen our statistical approach, we analysed bone parameters as both continuous variables, as well as categorical data, for this reason.
Both iron overload and iron deficiency have been associated with reduced BMD and increased risk of osteoporosis. 41 We found that CTX and P1NP were inversely associated with transferrin concentrations, while the BBI was positively associated with transferrin. Transferrin is a negative acute phase protein and therefore decreases with inflammation. High bone turnover is commonly seen in chronic inflammation. While transferrin was associated with CRP in our study, the inverse relationship between transferrin and CTX remained significant after adjusting for CRP. Similarly, COC users have higher transferrin from supraphysiological oestrogen and lower BTMs as shown in our data. However, the effect of transferrin remained after accounting for COC use. In a study of 18–35-year-old Spanish women, Toxqui et al. reported an inverse relationship between P1NP and transferrin, as well as NTX and ferritin. 12 The authors also found that NTX concentrations were significantly higher in iron-deficient women, compared with women with either iron deficiency anaemia or were iron-sufficient. 41 It has been suggested that the mechanism for increased bone turnover with iron overload is primarily related to oxidative stress, while the mechanism responsible for increased bone turnover with iron deficiency is less well understood. 41 Ishii et al. demonstrated that iron and transferrin are taken up by preosteoclasts through transferrin receptor 1, stimulating osteoclast differentiation. 42 Yang et al. demonstrated that transferrin suppresses ALP in osteoblast progenitor cells. 43 Collectively, these data highlight a biological link between iron biomarkers and bone metabolism. Considering the high prevalence of iron deficiency in young women, future studies should focus on young women with iron deficiency or iron overload to improve our understanding of bone metabolism across a range of iron concentrations.
A major strength of this study was the collection of a wide range of demographic, lifestyle and clinical factors to explore BTM determinants. Thus, we were able to tease out associations found by adjusting for various factors. Data were both self-reported, as well as objectively-measured. DXA was used to measure total body soft tissue composition rather than relying on BMI, which may be considered a crude measure of obesity. We investigated determinants of BTMs in a generally healthy cohort of fasted young women, excluding participants based on medical conditions or medications which may affect bone health. We were able to explain ∼21% of the variability in the BBI.
This study is not without limitations. Firstly, the use of Facebook advertising may introduce a selection bias towards women who are predominantly healthy or health-focused and lower the representation of women with riskier health behaviours (e.g. smoking, excessive alcohol consumption). However, non-response bias applies to most study types and we have previously shown the method to result in a broadly generalizable population. 44 The Victorian Population Health Survey 2011–2012 found that 14.6% of 18–24 year old Victorian women were current smokers, 18.2% were overweight or obese and 21.9% were insufficiently active, which are similar to our results (10%, 29% and 28%, respectively). 45 Slight differences may have arisen from the age differences between the two datasets, as well as population level behavioural changes over the last half decade (e.g. successful reductions in the prevalence of current smoking due to nationwide tobacco-control campaigns). The assay manufacturer, Roche, recommends CTX is measured in plasma; in the current study we measured CTX in serum. However, studies have shown there are no significant differences in CTX or P1NP values between serum or plasma samples.46,47 Reproductive hormones were not analysed via LC-MS/MS, and immunoassays might have potential cross-reactivity with synthetic hormones. However, the correlations with mass spectroscopy were excellent (Abbott second generation testosterone immunoassay slope = 1.0, r = 0.95, Roche third generation oestradiol immunoassay slope = 1.0, r = 0.99), and COC users were excluded from hormone analyses. Another limitation of the study is the cross-sectional design, so causation cannot be established in the relationships we described, nor did we examine changes in BTMs over time. In addition to day-to-day variation in BTMs, other sources of variation not taken into account in the current study included recent fracture, immobility, acute exercise and genetics. 48 There is also some evidence that BTMs may vary with the menstrual cycle, although we found no relationship in this study.14,49 We acknowledge that some of the questionnaire data may be affected by recall bias. Furthermore, we cannot rule out omission of medical conditions that may affect vitamin D and/or bone health in a self-reported questionnaire, which may affect results, nor can we rule out a selection bias in participants with a family history of musculoskeletal disease or concern for their bone health for various reasons. While BTMs have been correlated with histomorphometric measures of bone turnover previously, we acknowledge that further study is required using the BBI.1,17 The exploration of BBI in the current study was exploratory in nature.
In conclusion, this study has identified a number of factors which contribute to the variation of CTX and P1NP in adolescent and young adult women. Factors such as low body fat and transferrin concentrations were found to be associated with adverse bone metabolism being manifested in women at a relatively young age. An unfavourable BBI was significantly associated with low FN aBMD and reduced cortical vBMD providing a potential method of identifying young women with increased risk of poor bone health outcomes. These findings bridge the gap in knowledge of bone turnover in women from early adolescence to young adulthood. Appreciating determinants of bone turnover is crucial for developing strategies and promoting adequate peak bone mass and optimal bone health in young adults; yet this demographic tends to be neglected in musculoskeletal research. 19 Further research in this area should focus on longitudinal changes in BTMs and examine the effect of interventions aimed at improving bone health on BTM concentrations in young women.
Footnotes
Acknowledgements
The authors thank the Safe-D study participants. The authors thank the Safe-D chief investigators A/Professor Marie Pirotta, Dr Nicola Reavley, Prof Anthony Jorm, A/Prof Shanton Chang and Prof George Varigos as well as associate investigator Prof Kim Bennell and study coordinator Ms Adele Rivers. The authors thank the Young Female Health Initiative (YFHI) associate investigators: Dr Yasmin Jayasinghe; Dr Catherine Segan; Dr Asvini Subasinghe. The authors acknowledge the following people for their help with the study: Adrian Bickerstaffe; Maria Bisignano; Lauren Gilbert; Dr Ashwini Kale; Stefanie Koneski; Skye Maclean; Anna Scobie; Marjan Tabesh; Oktay Tacar; Dr Johannes Willnecker; Miaowen Zhou.
Declaration of conflicting interests
The author(s) declared no potential conflicts of interest with respect to the research, authorship, and/or publication of this article. The Safe-D study has received in-kind support from Swisse Wellness who provided vitamin D supplements for part B of the Safe-D study.
Funding
The author(s) disclosed receipt of the following financial support for the research, authorship, and/or publication of this article: The Safe-D study was funded by the Australian National Health and Medical Research Council (NHMRC) project grant APP1049065. ETC was supported by an Australian Postgraduate Award.
Ethical approval
The study was approved by Melbourne Health Human Research Ethics Committee, Victoria, Australia (project number 2013.007).
Guarantor
JDW.
Contributorship
JDW conceived the study. ETC participated in the design of the study, establishment of the study methods, data collection and drafted the manuscript. JDW, SMG and AG are study investigators and were involved in study design, study co-ordination and helped draft the manuscript. CC helped to interpret study data and drafting the manuscript. AG is the study statistician and assisted with data analysis. All authors read, contributed to and approved the final version of the manuscript.