
Abstract
Background
The use of bone turnover markers in clinical practice and research in younger people is limited by the lack of normative data and understanding of common causes of variation in bone turnover marker values in this demographic. To appropriately interpret bone turnover markers, robust reference intervals specific to age, development and sex are necessary. This study aimed to determine reference intervals of bone turnover markers in females aged 16–25 years participating in the Safe-D study.
Methods
Participants were recruited through social networking site Facebook and were asked to complete an extensive, online questionnaire and attend a site visit. Participants were tested for serum carboxy-terminal cross-linking telopeptide of type 1 collagen and total procollagen type 1 N-propeptide using the Roche Elecsys automated analyser. Reference intervals were determined using the 2.5th to 97.5th percentiles of normalized bone turnover marker values.
Results
Of 406 participants, 149 were excluded due to medical conditions or medication use (except hormonal contraception) which may affect bone metabolism. In the remaining 257 participants, the reference interval was 230–1000 ng/L for serum carboxy-terminal cross-linking telopeptide of type 1 collagen and 27–131 µg/L for procollagen type 1 N-propeptide. Both marker concentrations were inversely correlated with age and oral contraceptive pill use. Therefore, intervals specific to these variables were calculated.
Conclusions
We defined robust reference intervals for cross-linking telopeptide of type 1 collagen and procollagen type 1 N-propeptide in young females grouped by age and contraceptive pill use. We examined bone turnover markers’ relationship with several lifestyle, clinical and demographic factors. Our normative intervals should aid interpretation of bone turnover markers in young females particularly in those aged 16 to 19 years where reference intervals are currently provisional.
Introduction
Suboptimal peak bone mass substantially increases the risk of osteoporosis (and related fracture) in later life. Thus, strategies aimed at optimizing peak bone mass in younger, premenopausal females are crucial in its prevention. 1 Genetics heavily determine adult peak bone mass, but 20–40% of adult peak bone mass is believed to be influenced by lifestyle choices. 2 The period of late adolescence to early adulthood has recently been highlighted as an understudied transitional life stage in regards to bone acquisition. 2 To appropriately interpret results of studies investigating the mechanisms and determinants of peak bone mass development in the period of late adolescence to early adulthood, quality normative data are required spanning these life stages.
In younger females at the end of puberty, high bone turnover is present due to bone modelling, but subsides as bone growth halts and newly formed osteoid undergoes primary and secondary mineralization. 3 High bone turnover in this age group is characterized by a tight coupling of bone resorption and formation, allowing for bone accrual and increase in bone strength. By the third decade of life, the majority of bone mass has been attained, and bone turnover reaches a plateau in healthy, premenopausal females.4,5
Areal bone mineral density (aBMD), determined by dual energy X-ray absorptiometry (DXA), is currently the gold standard clinical measure of bone health and fracture risk. Biochemical markers of bone turnover may provide information that is complementary to aBMD. 6 Bone turnover markers (BTMs) are able to indicate changes in bone metabolism more rapidly than DXA, which may not be able to detect a significant change in aBMD for 12–24 months in many clinical settings. Other advantages of BTM measurement are the lack of exposure to ionizing radiation and their relatively low cost. They have been previously shown to be a reliable measure of bone turnover in young females. 7
The measurement of BTMs in the blood or urine reflects whole body rates of bone formation and resorption. Carboxy-terminal cross-linking telopeptide of type 1 collagen (CTX) is a marker of bone resorption and is released when collagen degrades. Conversely, procollagen type 1 N-propeptide (P1NP) is a marker of bone formation and is cleaved off when collagen is laid down. These two analytes have been identified as the reference standard analytes by the International Osteoporosis Foundation and International Federation of Clinical Chemistry working groups to allow focused efforts on development of harmonized age- and sex-specific reference intervals. 8
BTMs have been shown to be predictive of fracture risk and have application in evaluating responses to osteoporosis therapy, making them clinically useful in fracture prevention strategies.9,10 Although the overall prevalence of skeletal frailty is low in young females, groups at risk include patients with eating disorders, coeliac disease, congenital bone diseases such as osteogenesis imperfecta or haematological malignancies requiring bone marrow transplantation. These females may benefit from BTM monitoring to assess disease progression and treatment efficacy. In a research setting, the evaluation of BTMs may be useful in studies implementing lifestyle or nutritional interventions aimed at optimizing peak bone mass and/or improving bone mineral density (BMD) in adolescents and young adults. However, the clinical utility of BTM measurement in young females is severely limited by the lack of age-specific normative data in a well-described reference population.
A recent review by Vasikaran et al. 11 highlighted that CTX reference intervals for females under the age of 20 years and P1NP reference intervals for females under the age of 25 years were areas of uncertainty in the field. Reference intervals have been established for healthy premenopausal females in a number of studies, but are limited in females in their third and fourth decade of life.12–14 Provisional reference intervals exist for the age range 16–18 years, which are calculated from a single study with 30 subjects only. 15
The main objectives of this cross-sectional study were to: (1) define age-specific reference intervals for CTX and P1NP in young females aged 16–25 years; (2) investigate the relationship of BTMs with several common clinical and lifestyle factors.
Methods
The study was approved by Melbourne Health Human Research and Ethics Committee, Melbourne Health, Victoria, Australia (project number 2013.007). The study was carried out in accordance with the National Statement on Ethical Conduct in Research Involving Humans (2007) produced by the National Health and Medical Research Council of Australia.
Participants
Data were obtained from participants recruited via Facebook advertising for part A of the Safe-D study, a project investigating vitamin D and health in females aged 16 to 25 years at the time of recruitment and living in Victoria, Australia.16,17 Participants were requested to complete a comprehensive online questionnaire which covered five key health domains: (1) health behaviours including diet; (2) musculoskeletal health; (3) mental health; (4) sexual and reproductive health; (5) cardiovascular and metabolic health. They also attended a study site visit including a physical assessment and blood sampling, between April 2014 and November 2015. Pregnancy and breastfeeding were exclusion criteria for the study.
Lifestyle factors were assessed by self-report and included: smoking status, daily calcium intake, 18 hormonal contraceptive use, alcohol consumption and physical activity. The time spent walking and in moderate or vigorous physical activity was recorded to give a physical activity score. 19 Physical activity was then categorized into four categories based on metabolic equivalent values or MET.minutes per week: minimal (<40), low (400 to < 600), moderate (600 to < 1200) or high (1200+). Menarche, menstrual cycle length and the date of the participants’ last period were self-reported. Site visit date and date of last period were collected to estimate menstrual cycle timing.
Sampling procedures
Before attending a study site visit at the Royal Melbourne Hospital, participants were instructed to fast overnight for a minimum of 8 h. To minimize the effects of diurnal variation, fasting blood samples were collected between 8:00 and 11:00. Serum aliquots were stored at −80℃, if not tested in real-time.
BTMs
Serum CTX, total P1NP and oestradiol were measured using the Roche Cobas e411 automated analyser (Roche Diagnostics GmbH, Mannheim, Germany). 20 Serum CTX had a coefficient of variation (CV) of 5.5% at 342 ng/L and 4.2% at 787 ng/L. Serum P1NP had a CV of 5.2% at 40.2 µg/L and 4.5% at 222.6 µg/L. Oestradiol had a CV of 18.3% at 46.8 pmol/L, 2.9% at 376.8 pmol/L and 2.9% at 1188.2 pmol/L.
Other pathology testing
Serum 25-hydroxyvitamin D (25OHD; 25OHD3 plus 25OHD2) was measured using liquid chromatography tandem mass spectrometry (LC-MS/MS) at VivoPharm Laboratories (Melbourne, Australia). 21 This method used a hexa-deuterated 25OHD3 as an internal standard and was performed on an API 4000 QTRAP LC-MS/MS system. Concentrations of each metabolite were extrapolated by the use of an eight-point standard curve prepared using Chromsystems Vitamin D metabolite serum calibration standards (Chromsystems GmbH, Munich, Germany). Tri-Level vitamin D metabolite Quality Control samples from UTAK Laboratories (PM Separations, US) were used as quality controls samples in each assay run. The CV for 25OHD3 at 24.74 nmol/L was 2.0%, 1.6% at 72.72 nmol/L and 1.4% at 163.33 nmol/L. The CV for 25OHD2 was 4.9% at 21.35 nmol/L, 2.5% at 63.48 nmol/L and 2.5% at 152.47 nmol/L. Serum biochemistry was measured using Abbott ARCHITECT c16000 integrated system (Abbott Diagnostics, Abbott Park, IL). Glomerular filtration rate (eGFR) was estimated using the chronic kidney disease epidemiology collaboration formula. 22 Parathyroid hormone (PTH) and thyroid-stimulating hormone (TSH) were measured using an Abbott ARCHITECT i2000 analyser. The CVs for PTH and TSH were 4.9% and 2.9%, respectively.
BMD
aBMD was measured using DXA (QDR 4500A densitometer, Hologic Inc., Bedford, USA) at the lumbar spine (L1–L4), total hip and femoral neck. The results were expressed as grams per centimetre squared (g/cm2). Values were compared with reference data to give a Z-score (SD from mean values of age-matched reference group). 23 Scans were analysed with QDR software version 9.1D. Quality control scans were performed on a daily basis according to manufacturer protocol.
Statistical analysis
Statistical analysis was performed using StataSE 13 (StataCorp, TX, USA). CTX values were exported as ng/mL to two decimals places and were converted into ng/L. To determine BTM reference intervals in healthy young females, participants were excluded from analysis if they had not completed the medical history section of the questionnaire, not fasted before blood collection, if other pathology results were abnormal (eGFR < 60 ml/min/1.73 m2, corrected calcium > 2.60 mmol/L or <2.10 mmol/L, PTH > 10 pmol/L, 25OHD < 25 nmol/L, TSH < 0.35 mIU/L or C-reactive protein > 10 mg/L), were previously diagnosed with medical conditions which affect bone health (e.g. osteoporosis, type 1 or 2 diabetes mellitus, hyperthyroidism, hyperparathyroidism, cystic fibrosis, coeliac disease, Crohn’s disease, pancreatitis) or if participants were taking medications which affect bone health (prednisolone, antiepileptic drugs, lithium carbonate, methotrexate, antiandrogens, antipsychotics, adalimumab and proton pump inhibitors). Participants using depot medroxyprogesterone acetate, a progesterone only pill or an etonogestrel implant, were excluded; combined oral contraceptive (COC) use was not an exclusion. Participants with a BMD Z-score < −2.0 at any skeletal site were excluded.
Both graphical (histogram and QQ-plot) and analytical (Shapiro-Wilk test) methods were used to test serum CTX and P1NP for normality. Both were found to be positively skewed, and a square root transformation was performed on CTX and P1NP before reference intervals were calculated. Values that exceeded the mean by ±3SD (outliers) were excluded. Reference intervals were determined by using 2.5th to 97.5th percentiles of each BTM concentration. Age at the time of site visit was rounded to the nearest year to allow determination of age-specific reference intervals. Participants aged 25 years at recruitment who had a birthday between consent and their site visit were recoded as 25 years old for statistical purposes (n = 4). Participants were divided into age groups as follows: 16–19, 20–22 and 23–25 years.
Descriptive statistics were used to describe both discrete and continuous variables. Univariable analysis was performed to examine the effects of age, COC use, body mass index (BMI) and season on BTMs. Wilcoxon signed-rank test was used to test whether a relationship existed between a dichotomous variable and an ordinal variable (e.g. contraception use and CTX). Spearman’s correlation was used to assess correlations between continuous variables. Multivariable regression analysis was used to identify determinants of CTX and P1NP. A P-value of less than 0.05 was considered statistically significant.
Results
Blood samples were collected from 406 participants. Figure 1 shows the distribution of CTX and P1NP before transformation.
Distribution of CTX (left) and P1NP (right) before square-root transformation.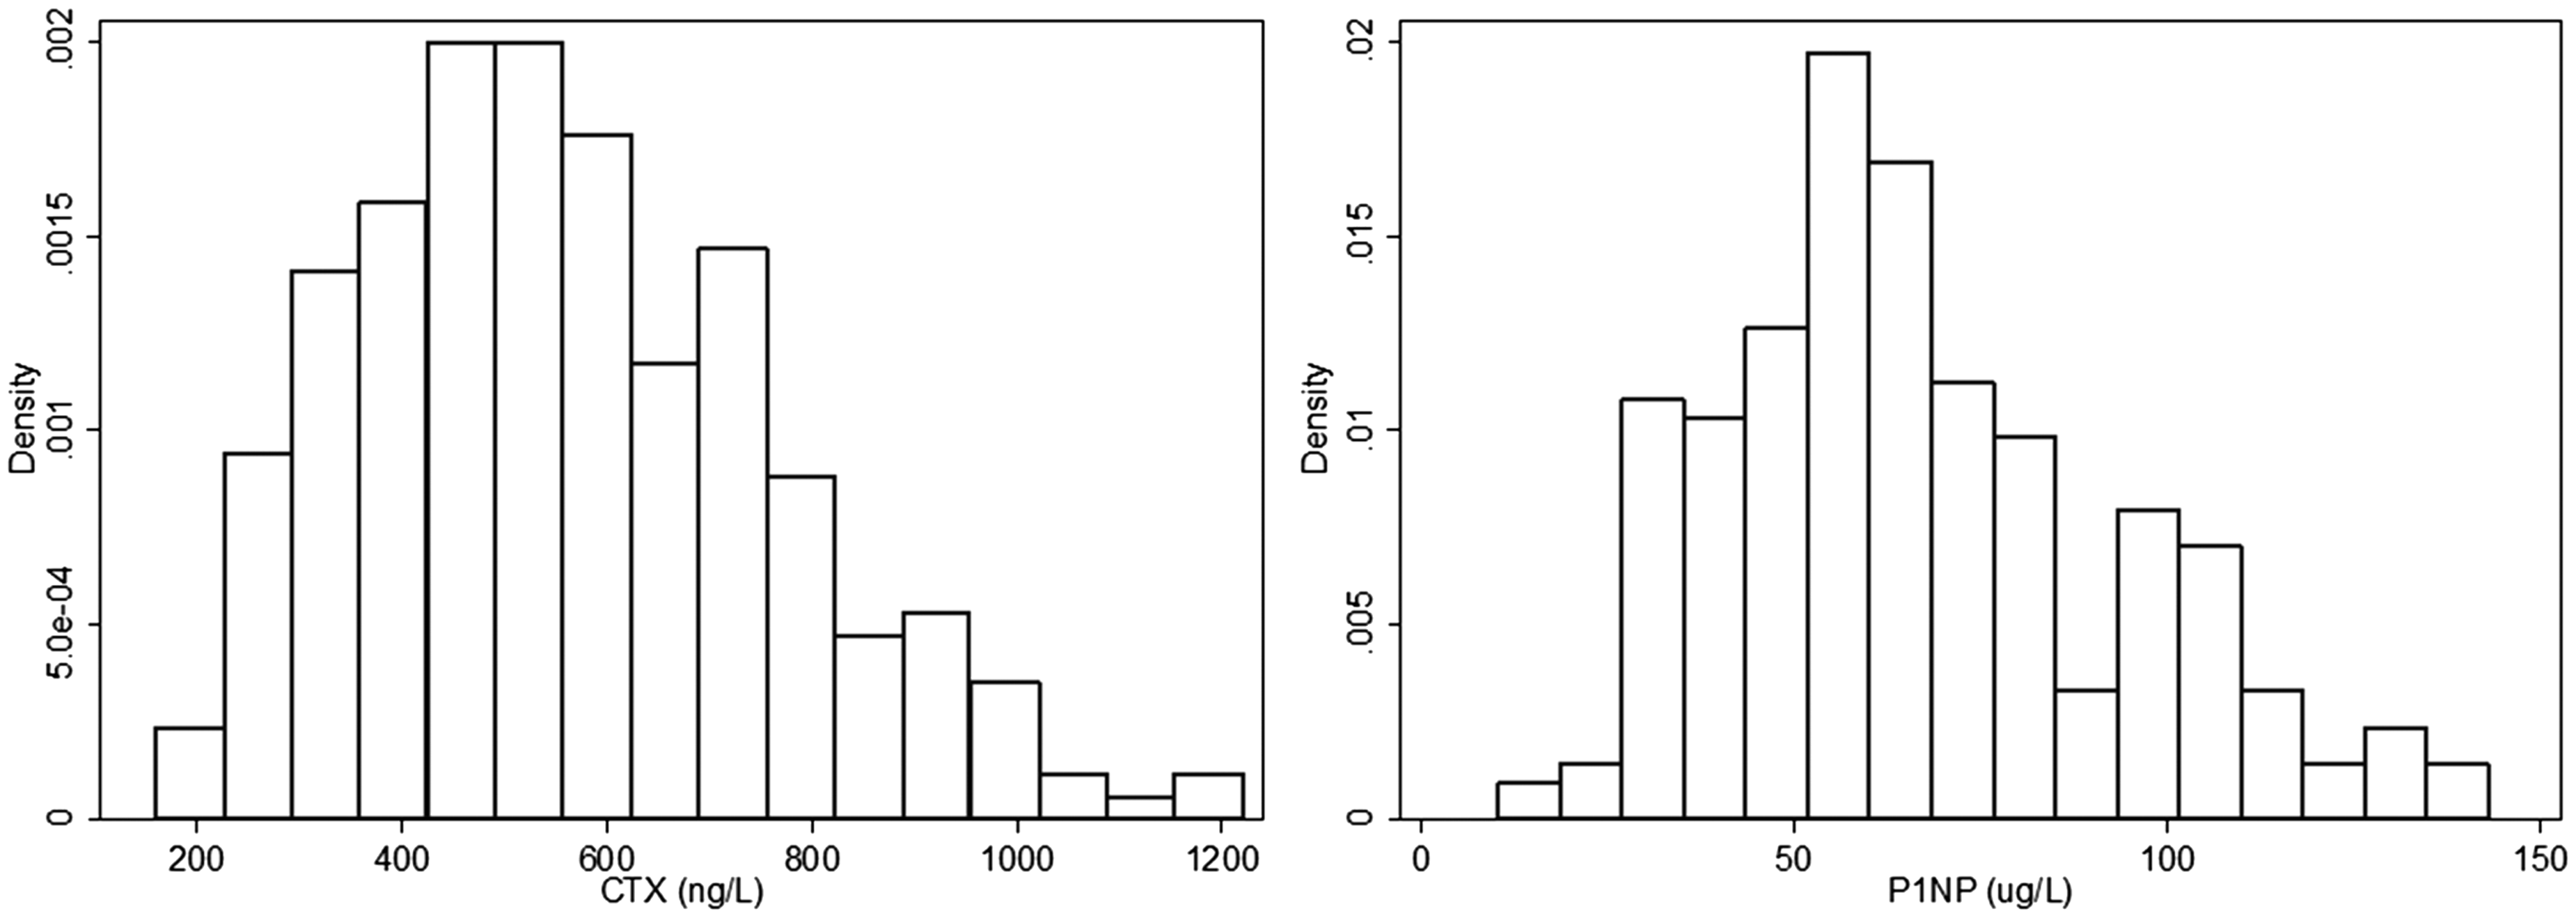
To determine reference intervals, a total of 149 participants were excluded for the following reasons (note: some participants may meet multiple exclusion criteria): BTM results exceeded the mean by three SDs (n = 11), participant reported not fasting overnight (n = 17), participant had not completed the medical history section of the questionnaire (n = 4), corrected calcium > 2.60 mmol/L (n = 2), PTH > 10 pmol/L (n = 25), 25OHD < 25 nmol/L (n = 13), TSH < 0.35 mIU/L (n = 4), C-reactive protein > 10 mg/L (n = 31), participant was taking specific medications (prednisolone [n = 2], antiepileptic drugs [n = 8], lithium carbonate [n = 1], methotrexate [n = 2], antiandrogens [n = 2], antipsychotics [n = 7], adalimumab [n = 1], proton pump inhibitors [n = 7], progesterone only pill [n = 2] the etonogestrel implant [n = 15]) or were previously diagnosed with one of the following conditions: type 1 diabetes mellitus (n = 2), hyperthyroidism (n = 2), cystic fibrosis (n = 1) and coeliac disease (n = 8). One participant was excluded as she was diagnosed with osteoporosis before commencing the study, while 45 were excluded with a Z-score < −2.0 at one or more skeletal sites.
The median (Q1, Q3) CTX value was 540 ng/L (410, 700). The median (Q1, Q3) P1NP value was 62 µg/L (47, 83). Serum CTX and P1NP were strongly correlated with each other (rho = 0.686, P < 0.001). Serum BTM concentrations were not associated with blood collection time (CTX: P = 0.501, P1NP: P = 0.222, data not shown) or storage time (CTX: P = 0.332; P1NP: P = 0.272, data not shown).
Characteristics of Safe-D study participants with BTM results available and the healthy cohort used to calculate reference intervals.
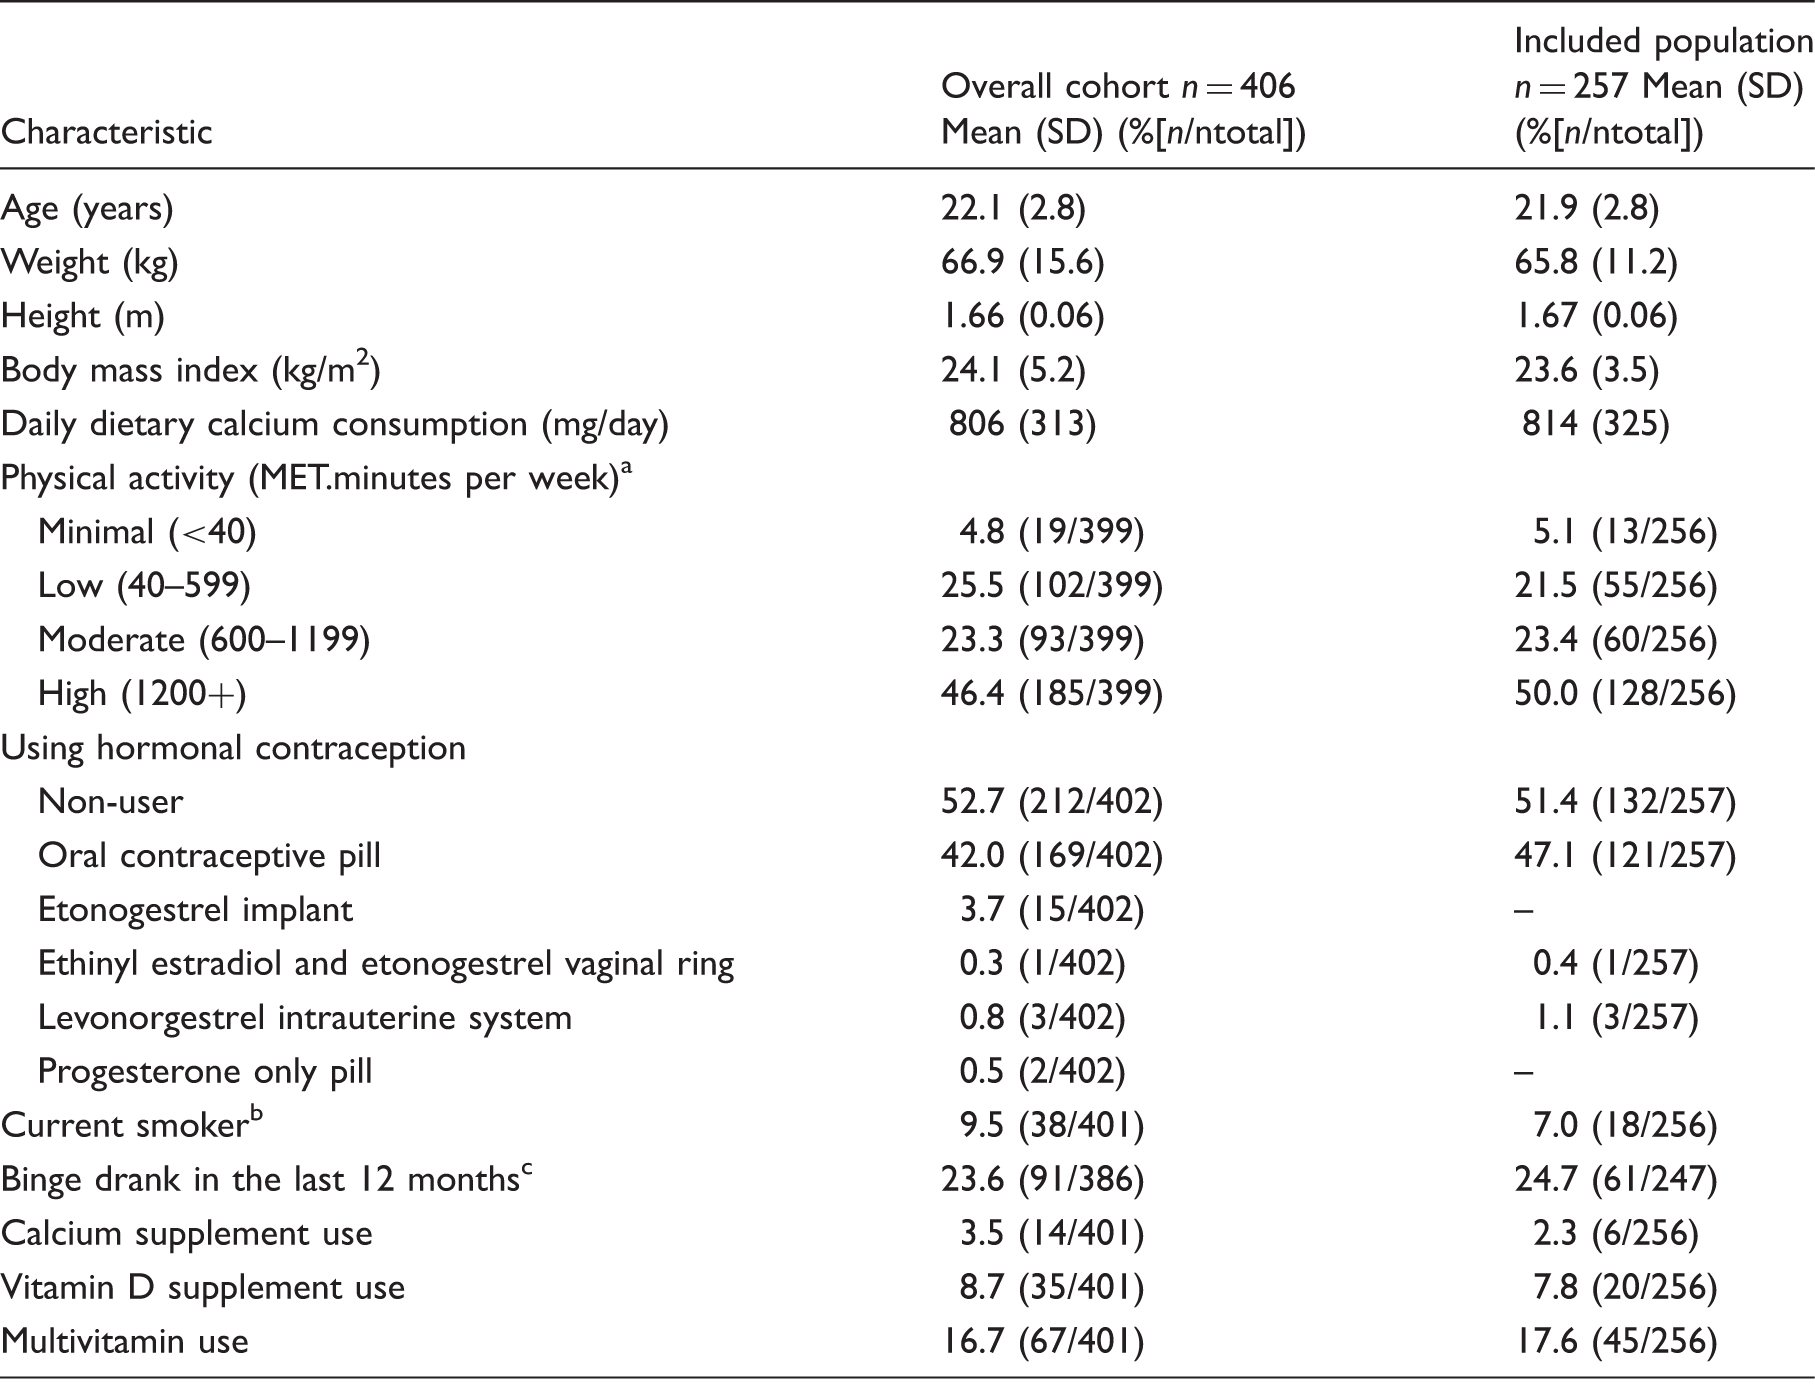
Note: numbers may not add up to 406 and 257, respectively, due to missing data.
Statistically significant different between overall cohort and included population (P = 0.032).
Participants who smoked daily or were social smokers were defined as current smokers.
Binge drinking was defined as consuming more than 4 standard drinks on a particular occasion.
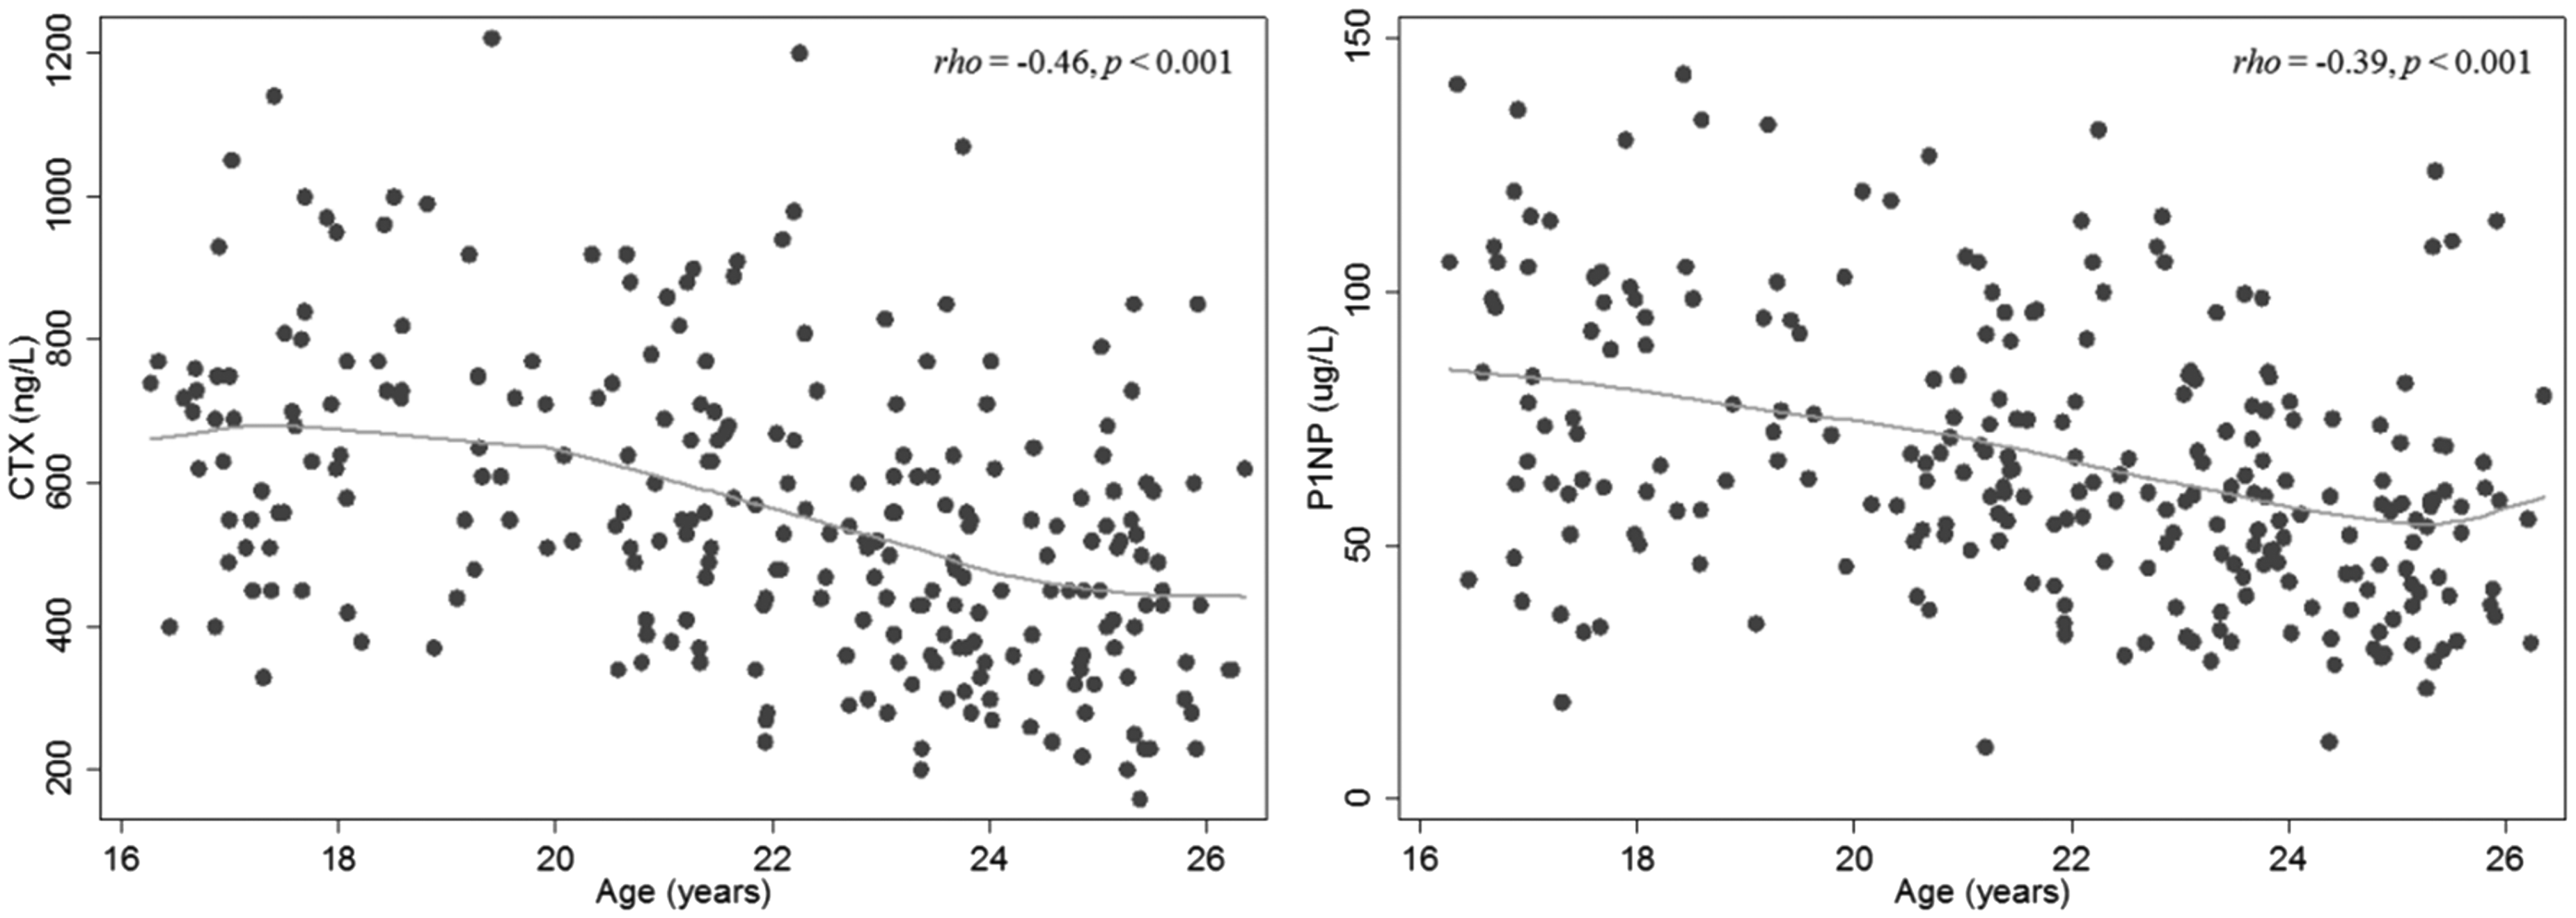
Scatterplot of CTX (left) and P1NP (right) by age.
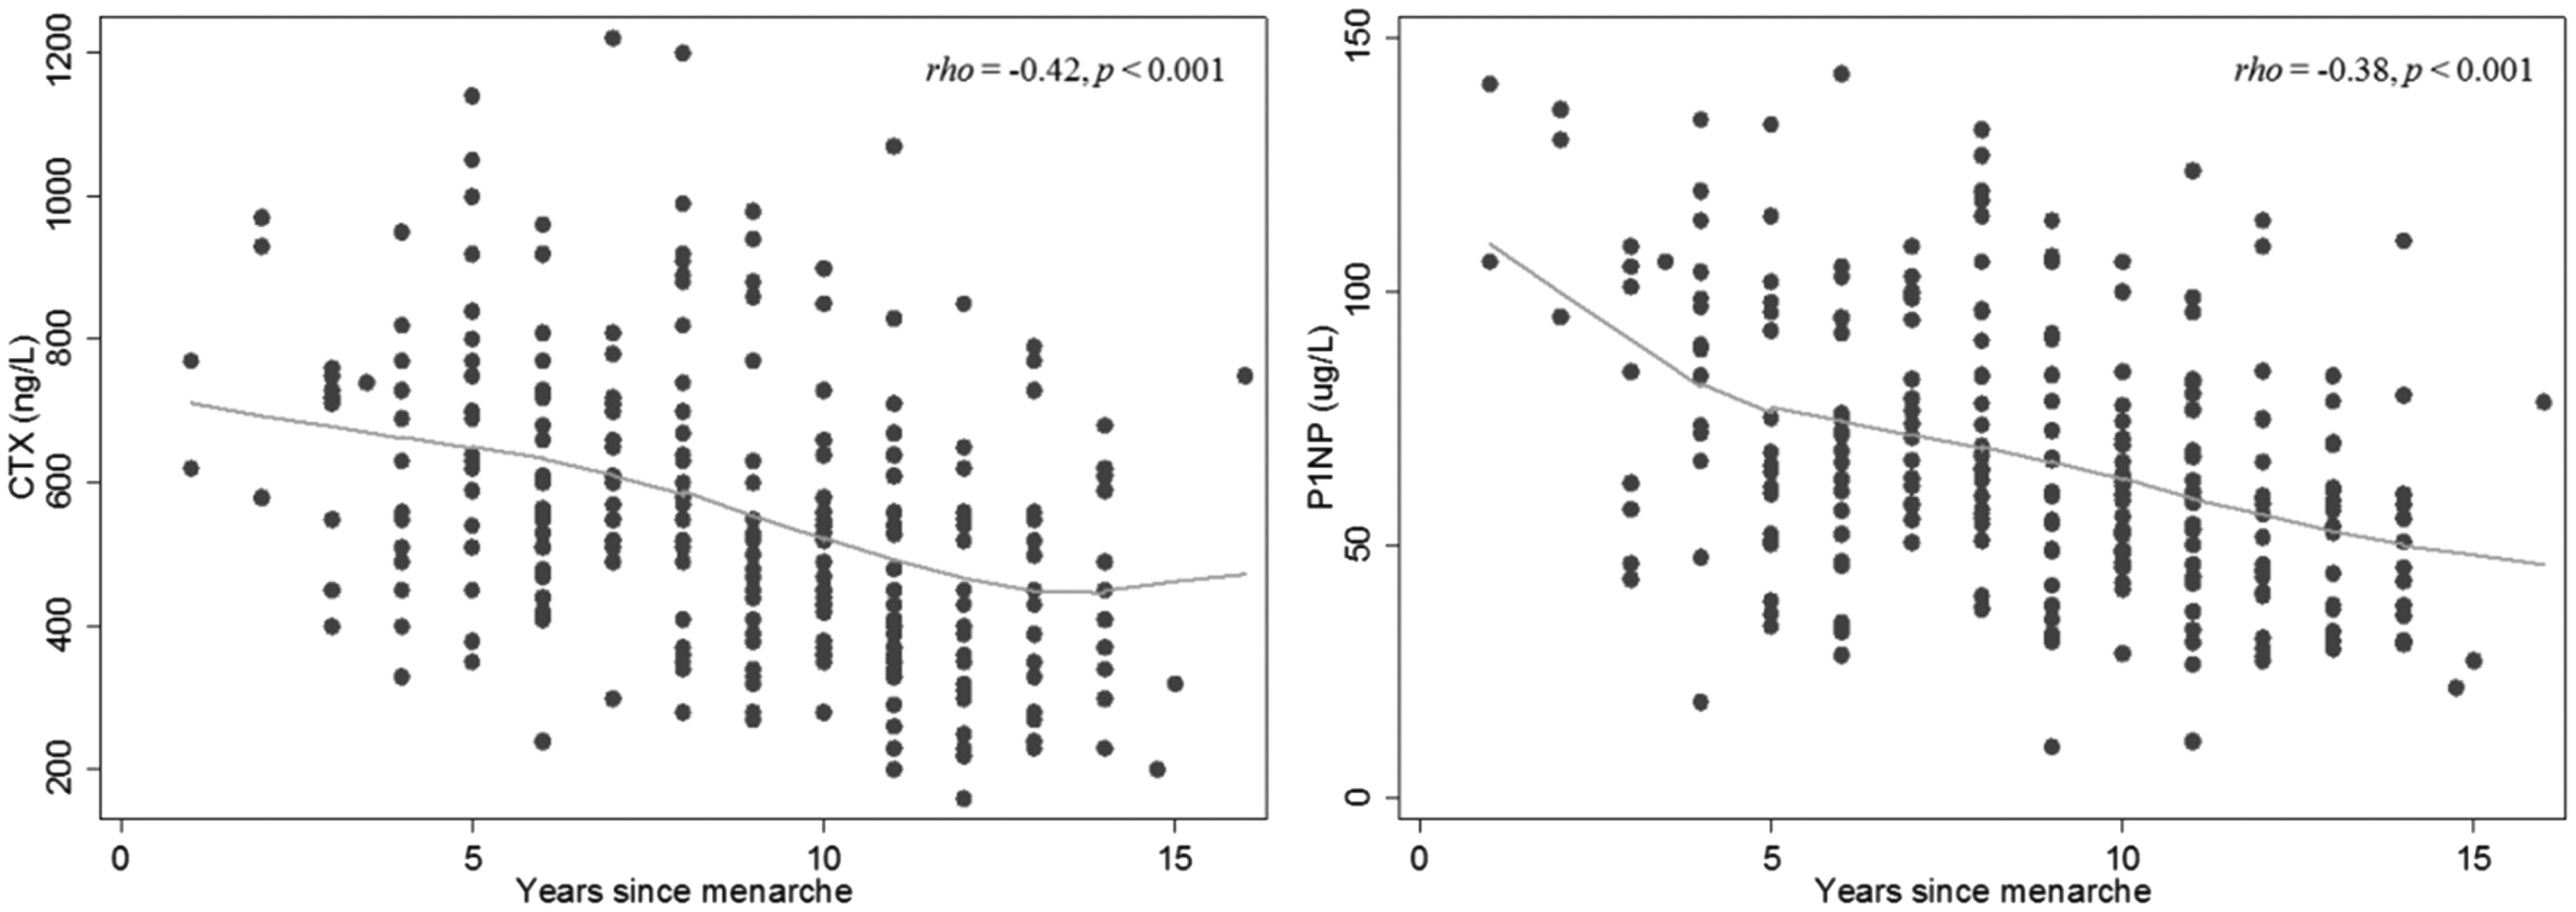
Scatterplot of CTX (left) and P1NP (right) by years since menarche.
Serum CTX concentrations were 17% lower in participants who used the COC pill compared with non-users (488 ng/L vs. 591 ng/L, Z = 4.26, P < 0.001) and P1NP concentrations were 22% lower (56 µg/L vs. 72 µg/L, respectively, Z = 4.71, P < 0.001). In participants not using any form of hormonal contraception (n = 132), serum CTX and P1NP concentrations were not associated with menstrual cycle timing (CTX: rho = −0.06, P = 0.481; P1NP: rho = 0.12, P = 0.190).
Reference intervals for CTX and P1NP group by age and COC use.
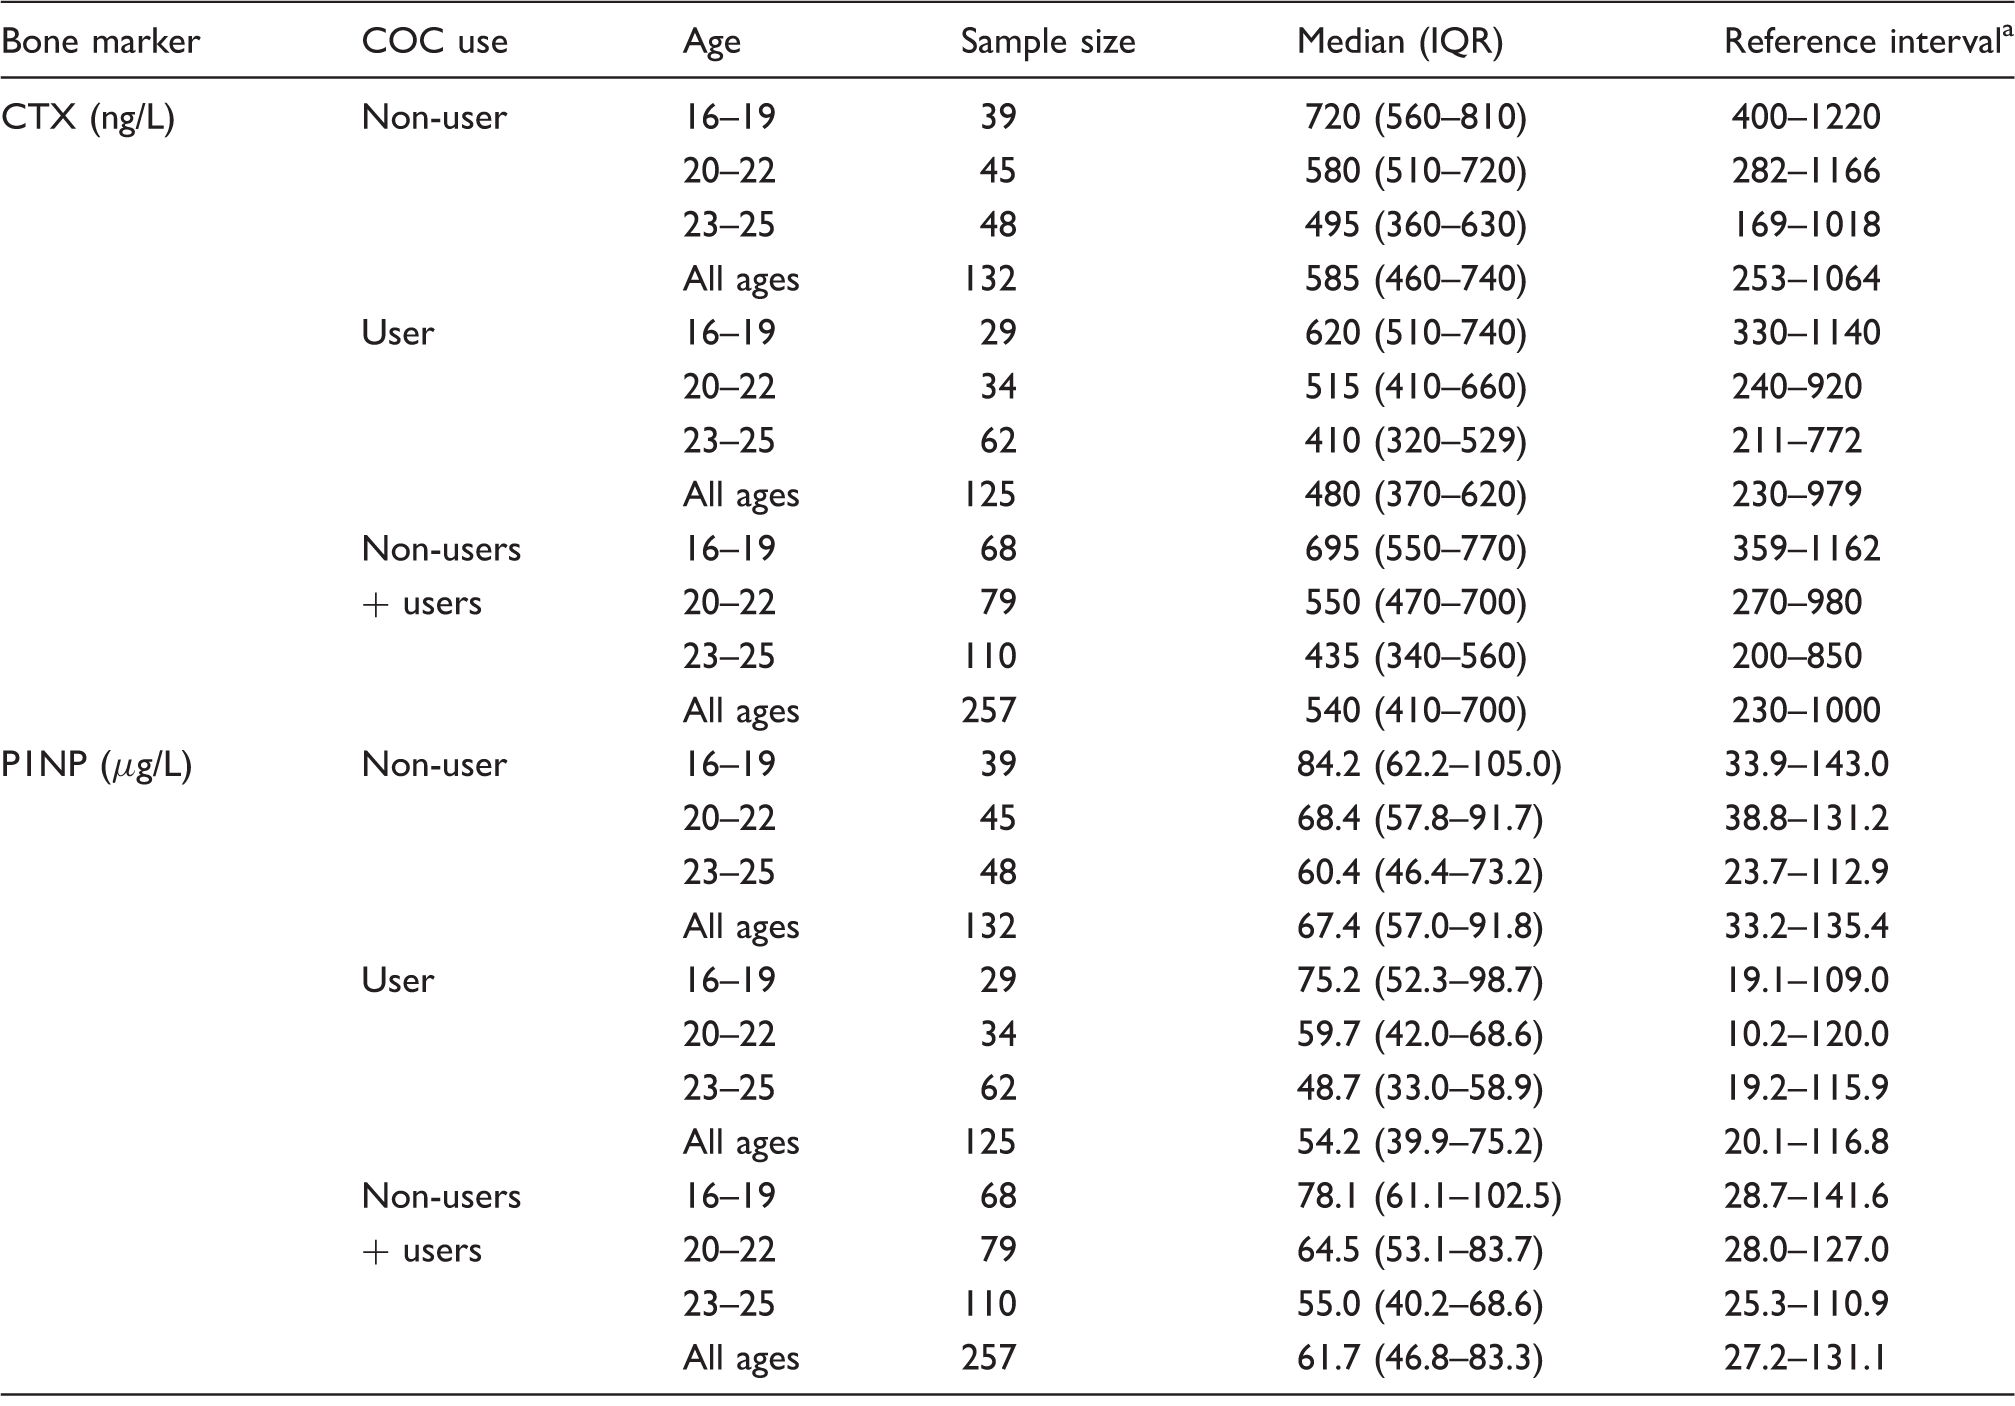
COC: combined oral contraceptive; CTX: C-terminal telopeptide of type 1 collagen; P1NP: total procollagen type 1 N-propeptide.
Reference intervals were calculated based on normally distributed transformed data and converted back to original values.
Serum CTX was slightly lower in winter compared with other seasons (505 ng/L in winter compared with 568 ng/L in other seasons; Z = 2.67, P = 0.008). P1NP showed no seasonal variation (Z = 0.83, P = 0.404). Neither CTX nor P1NP concentrations were associated with 25OHD or PTH (P > 0.100 for all variables). BTM concentrations were not associated with BMI (CTX: rho = −0.11, P = 0.076; P1NP: rho = −0.096, P = 0.126).
Age, COC use and season were all significant determinants of serum CTX in a multivariate model (age: β = −0.639, P < 0.001; COC use: β = −1.959, P < 0.001; winter: β = −1.102, P = 0.022; R2 = 0.27). Age and COC use were independently associated with P1NP in a multivariate model (age: β = −0.209, P < 0.001; COC user: β = −0.842, P < 0.001; R2 = 0.21).
Discussion
To our knowledge, this is the first study to report reference intervals for CTX and P1NP in young Australian females spanning from late teens to mid-20s. Reference intervals currently implemented for this age range are sourced from a handful of studies which do not span across adolescence into young adulthood and generally have smaller sample sizes for calculated age-specific reference intervals in young females.15,24 We used a novel method of recruitment in the form of a Facebook advertising campaign to recruit a broadly-representative sample of young females. 17 The use of this recruitment method was a key to the success of the study since young females tend not to respond to traditional approaches such as recruitment through health-care centres or mail outs. We derived reference intervals specific to age group and COC use, which we demonstrated were both prominent determinants of BTM values.
The International Osteoporosis Foundation and International Federation of Clinical Chemistry have recommended that CTX and P1NP are used as reference analytes for bone turnover in clinical trials, as markers of bone resorption and formation, respectively. A position paper published by their bone marker standards working group listed several reference intervals for CTX and P1NP from various studies. In premenopausal females, these reference intervals were 110–630, 13 100–620, 25 90–660 14 and 70–610 ng/L 26 for serum CTX and 16.3–78.2, 13 16.2–60.925 and 14.6–63.5 µg/L 26 for serum P1NP. 8
CTX and P1NP reference intervals comparison in females aged up to age 30 years using automated assays.
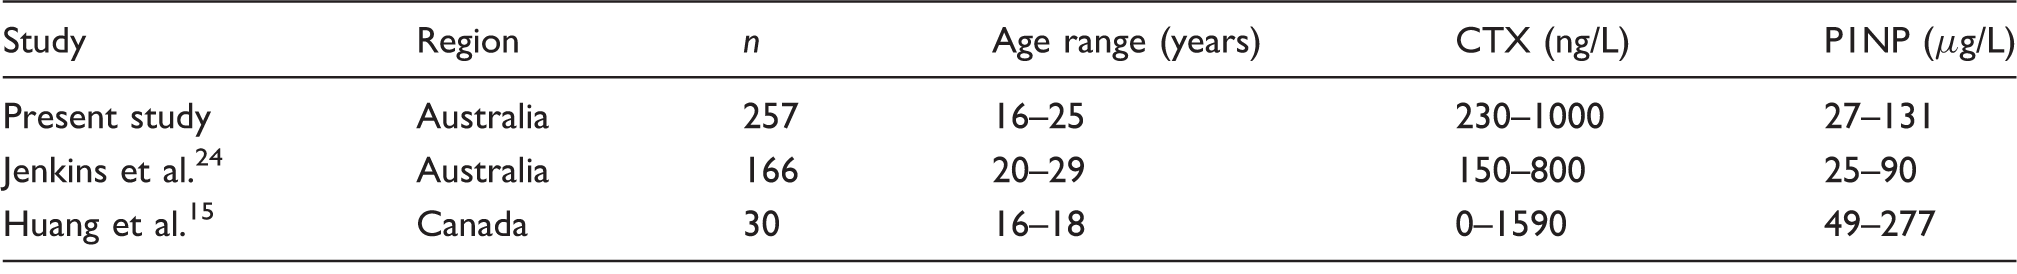
CTX: C-terminal telopeptide of type 1 collagen; P1NP: total procollagen type 1 N-propeptide.
In females aged 16–18 years, Huang et al. found a reference interval of 0–1590 ng/L for CTX and 49–277 µg/L for P1NP using the same assay platform. Current provisional ranges for CTX and P1NP are based on this study alone. 27 These reference intervals are higher than our calculated intervals for 16–19 year olds and were derived with a similar sample size (n = 30) evaluating adolescents recruited from day-care centres, schools, religious institutions or were the children of hospital workers in Hamilton, Ontario, Canada. The differences between the two studies may be due to a higher prevalence of COC use in our cohort (Huang et al. did not report on COC use); however, their reference intervals are also higher than our intervals for 16–19 years old without COC use (400–1220 ng/L). To resolve such differences between studies, more research may be required into participants under the age of 20 years, with larger sample sizes and controlling for a number of variables such as fasting, time of day, physical activity, season, COC use and recent fracture.
During skeletal growth in young females, bone mass is accrued up until the third decade of life.4,5 For example, Teegarden et al. showed 99% of BMD is attained by the age of 22 years with peak bone mineral content attained by age 26 years. In our study, CTX and P1NP showed variation with chronological age and years since menarche as expected. Previous studies have also consistently found associations between BTMs and age.15,24–26,28 In a Chinese population aged 15 to 110 years, Li et al. 29 also demonstrated relatively higher concentrations of CTX and P1NP in females between the age of 15 and 19 years, which thereafter declined with age. Nomura et al. 28 found significant decreases in serum CTX with each age group (mean CTX concentration for 10–19: 817 ng/L; early 20s: 546 ng/L; late 20s: 385 ng/L) and a significant decrease between the groups in their 20s and 30s for P1NP. 28 Both BTMs reached nadirs in participants aged in their 30s and early 40s. In a regression model, Huang et al. 15 also found age had a significant effect on BTMs in 16–18-year-old females (P < 0.001). Walsh et al. 30 found serum CTX and P1NP were lower in young females aged 30–32 years compared with 16–18 year olds (CTX: 310 vs. 670 ng/L; P1NP: 38.7 vs. 102.8 ng/ml; P < 0.01 for both variables).
BTMs were found to be lower in COC users compared with non-users, which is consistent with previous literature.13,14,31,32 Mean CTX was 17% lower in users than in non-users, while mean P1NP concentrations were 22% lower (P < 0.001 for both markers). In premenopausal females aged 20–50 years, Adami et al. 26 found P1NP concentrations 26% lower in COC users compared with non-users (P < 0.001). De Papp et al. 14 and Garnero et al. 32 found median concentrations of CTX and P1NP were lower in COC users compared with non-users. Glover et al. 13 found that P1NP concentrations were 12.1% lower in females taking the COC compared with non-users. 13 In 16–18 year olds, Walsh et al. 30 found COC users had lower serum CTX concentrations compared with non-users (570 vs. 710 ng/L; P < 0.05) which is in agreement with our data. Therefore, it may be more appropriate for reference intervals to be specific to contraception status, as well as age and sex, and COC use should be considered when interpreting BTM results. Further research is needed on the effects of other forms of hormonal contraception on BTM values.
Previous literature on the seasonality of BTMs has shown mixed results.33–35 We found CTX values were 11% lower in winter compared with other seasons, but found no seasonal variation in P1NP. Jenkins et al. also found no seasonal variation in P1NP, but found increased concentrations of CTX in winter, which they postulated may in part be due by subclinical vitamin D deficiency and secondary hyperparathyroidism. 24 Longitudinal studies with larger sample sizes than previously studied are necessary to further explore the effect of season in younger premenopausal females.33,36
Previous literature has suggested a relationship between bone health and adiposity with increasing adiposity potentially increasing the risk of fracture.37,38 We found no association between BTMs and BMI. Adami et al. 26 found CTX and P1NP were negatively correlated with BMI (r = −0.177, r = −0.353, respectively, P < 0.001). In 25–45-year-old females, Evans et al. found CTX concentrations were significantly lower in obese adults (P = 0.024). 39 Other studies have found no association between BMI and BTMs.12,13,15
The main strengths of this study were the relatively large sample size spanning the important and understudied age range of 16–25 years, and the collection of an extensive range of health, lifestyle and clinical information both through online questionnaires and the study site visit. 16 This information enabled us to calculate reference intervals in a healthy cohort of young females by excluding participants with abnormal pathology results or medical conditions and/or medications that may adversely affect bone turnover. In this study, blood was collected between the hours of 8:00 and 11:00 to reduce biological variation.40,41 Most BTMs increase at night, reaching a peak between 2:00 and 8:00, after which they decrease rapidly, reaching a nadir between 13:00 and 23:00.36,42 We found no relationship between collection time and BTM values in our study. Another strength of the study is that samples were taken in fasted participants as CTX and P1NP have previously been shown to be lower in subjects in a fed state. 40
This study has several limitations. Lifestyle and clinical data such as medical history were by self-report, so may be affected by recall bias. Menstrual cycle timing was not taken into account when booking site visits, although the change in BTMs over the menstrual cycle is believed to be small and we found no association with menstrual cycle timing in this study. 36 Participants were not asked to refrain from exercising 24 h prior to their site visit, which may increase BTMs.43,44
This study demonstrates the desirability of further research into BTM reference intervals in other specific age ranges and across both sexes to enable development of additional robust intervals that are age- and sex specific. Consideration should be taken to control for circadian rhythm, fasting status and acute exercise. Other factors that should be considered when assessing BTMs include fracture and medical history, renal function, vitamin D status, smoking, alcohol use, sample storage and assay method.
In conclusion, reference intervals of CTX and P1NP were determined in a well-characterized cohort of healthy young females across the age range 16 to 25 years taking into consideration COC use. Values were higher than the Australian Consensus Reference Intervals for premenopausal females. Importantly, we studied a single cohort whose ages were distributed across this age range, when skeletal maturation is completed in females. These findings have important application in bone health research and should prove useful in the clinical assessment of bone metabolism in young females.
Footnotes
Acknowledgements
The authors thank the participants who took part in Safe-D study. The authors also thank the Safe-D chief investigators Associate Professor Marie Pirotta, Professor Anthony Jorm, Associate Professor Shanton Chang and Professor George Varigos along with associate investigator Professor Kim Bennell and study coordinator Ms Adele Rivers. The authors thank Young Female Health Initiative (YFHI) associate investigators Dr Yasmin Jayasinghe, Dr Catherine Segan and Dr Asvini Subasinghe. The authors thank the following people for assisting with various study components: Adrian Bickerstaffe, Maria Bisignano, Lauren Gilbert, Dr Ashwini Kale, Stefanie Koneski, Skye Maclean, Anna Scobie, Marjan Tabesh, Oktay Tacar, Miaowen Zhou.
Declaration of conflicting interests
The Safe-D study has received in-kind support from Swisse Wellness who provided vitamin D supplements for part B of the Safe-D study. Swisse Wellness did not play a role in study design nor the implementation or interpretation of these studies.
Funding
The Safe-D study was funded by National Health and Medical Research Council (NHMRC) project grant APP1049065.
Ethical approval
The study was approved by Melbourne Health Human Research and Ethics Committee, Melbourne Health, Victoria, Australia (project number 2013.007).
Guarantor
JDW.
Contributorship
JDW conceived the study. ETC participated in the design of the study data collection and drafted the manuscript. JDW, SMG and AG are study investigators and were involved in study design, study co-ordination and helped draft the manuscript. CC helped to interpret study data and drafting the manuscript. AG is the study statistician and was involved in sample size and power calculations and also advised on the statistical analysis of the data. All authors read, contributed to and approved the final manuscript.