
Abstract
Backgrounds
Diabetic patients with end-stage renal disease who are not on haemodialysis show low concentrations of HbA1c and glycated albumin due to renal anaemia and proteinuria, respectively. In the present study, we examined whether serum albumin-adjusted glycated albumin could accurately reflect glycaemic control in these patients.
Methods
To examine the correlation between glycated albumin and serum albumin (Study 1), 49 diabetic patients with end-stage renal disease not on haemodialysis were used. To evaluate the association between the glycaemic control indicators and the glycaemic control state (Study 2), 30 diabetic patients with end-stage renal disease were enrolled. The estimated HbA1c and the estimated glycated albumin concentrations were calculated based on the mean blood glucose concentrations obtained from the diurnal variation. The adjusted glycated albumin concentrations were calculated from the regression formula between the serum albumin and glycated albumin obtained from Study 1.
Results
No significant correlation was found between the measured HbA1c and estimated HbA1c concentrations. The estimated HbA1c (inversely) and measured HbA1c/estimated HbA1c ratio (positively), but not measured HbA1c, showed a significant correlation with Hb concentrations. The estimated glycated albumin was positively associated with the measured glycated albumin and adjusted glycated albumin concentrations. Although measured glycated albumin/estimated glycated albumin ratio was positively correlated with serum albumin, there was no significant association between the adjusted glycated albumin/estimated glycated albumin ratio and serum albumin, Hb and estimated glomerular filtration rate.
Conclusions
We found for the first time that the adjustment of glycated albumin by serum albumin could be useful to determine glycaemic control in diabetic patients with end-stage renal disease not on haemodialysis. These findings suggest that adjusted glycated albumin might be a better indicator of glycaemic control than measured HbA1c and measured glycated albumin in these patients.
Introduction
HbA1c is used not only as an indicator of glycaemic control but also as a target for assessing the risk of diabetic complications, including diabetic nephropathy.1,2 However, HbA1c concentrations are apparently low in patients with several pathologic conditions, such as haemolytic anaemia, blood loss and blood transfusion because of shorten lifespan of red blood cells.3–5 Further, HbA1c concentrations are also decreased due to the renal anaemia and/or administration of erythropoiesis-stimulating agents (ESA) in patients with end-stage renal disease (ESRD).6–9 Therefore, we cannot judge glycaemic control by using HbA1c in these patients.
Glycated albumin (GA) is another indicator of glycaemic control and is being used along with HbA1c. 10 Since GA is not influenced by a shortened lifespan of red blood cells, GA is regarded as a desirable indicator of glycaemic control in diabetic patients undergoing haemodialysis with renal anaemia and the administration of ESA.6–8 However, GA is also known to exist at a lower concentration in diabetic patients with marked albuminuria because of the increased albumin metabolism.11,12 For these reasons, both HbA1c and GA in diabetic patients with ESRD who are not on haemodialysis are apparently decreased, 12 and this makes it difficult to judge their glycaemic control by using any of these known indicators.
We previously reported the usefulness of estimated HbA1c (eHbA1c) and estimated GA (eGA), calculated from the mean blood glucose (MBG) obtained from the diurnal variation using Rohfling’s formula.13–15 In these studies, measured HbA1c (mHbA1c) was lower and the measured GA (mGA) was higher than eHbA1c and eGA values, respectively, in patients with chronic liver disease (CLD). 14 In patients with Cushing’s syndrome, the mGA concentration was lower than eGA. 15 We also found that the CLD–HbA1c (mean value of HbA1c and GA/3) accurately reflected glycaemic control without the influence of liver function. 14 The discrepancy between mHbA1c or mGA and glycaemic control was significantly increased as a result of decreased liver function by evaluating the correlation between the measured values/estimated values ratio and liver functions in CLD patients. 14
Since HbA1c concentration is directly affected by the degree of renal anaemia, the method for assessing glycaemic control based on HbA1c adjusted with Hb is also considered. However, because HbA1c is also influenced by the administration of ESA, 16 adjustment of GA with serum albumin (SA) may be more useful and reliable than that with Hb. Therefore, we hypothesized that SA-adjusted GA (adjGA) would accurately reflect the glycaemic control in ESRD patients who are not on haemodialysis. In this study, we examined this issue.
Materials and methods
Study design and patients
Clinical characteristics of study patients.
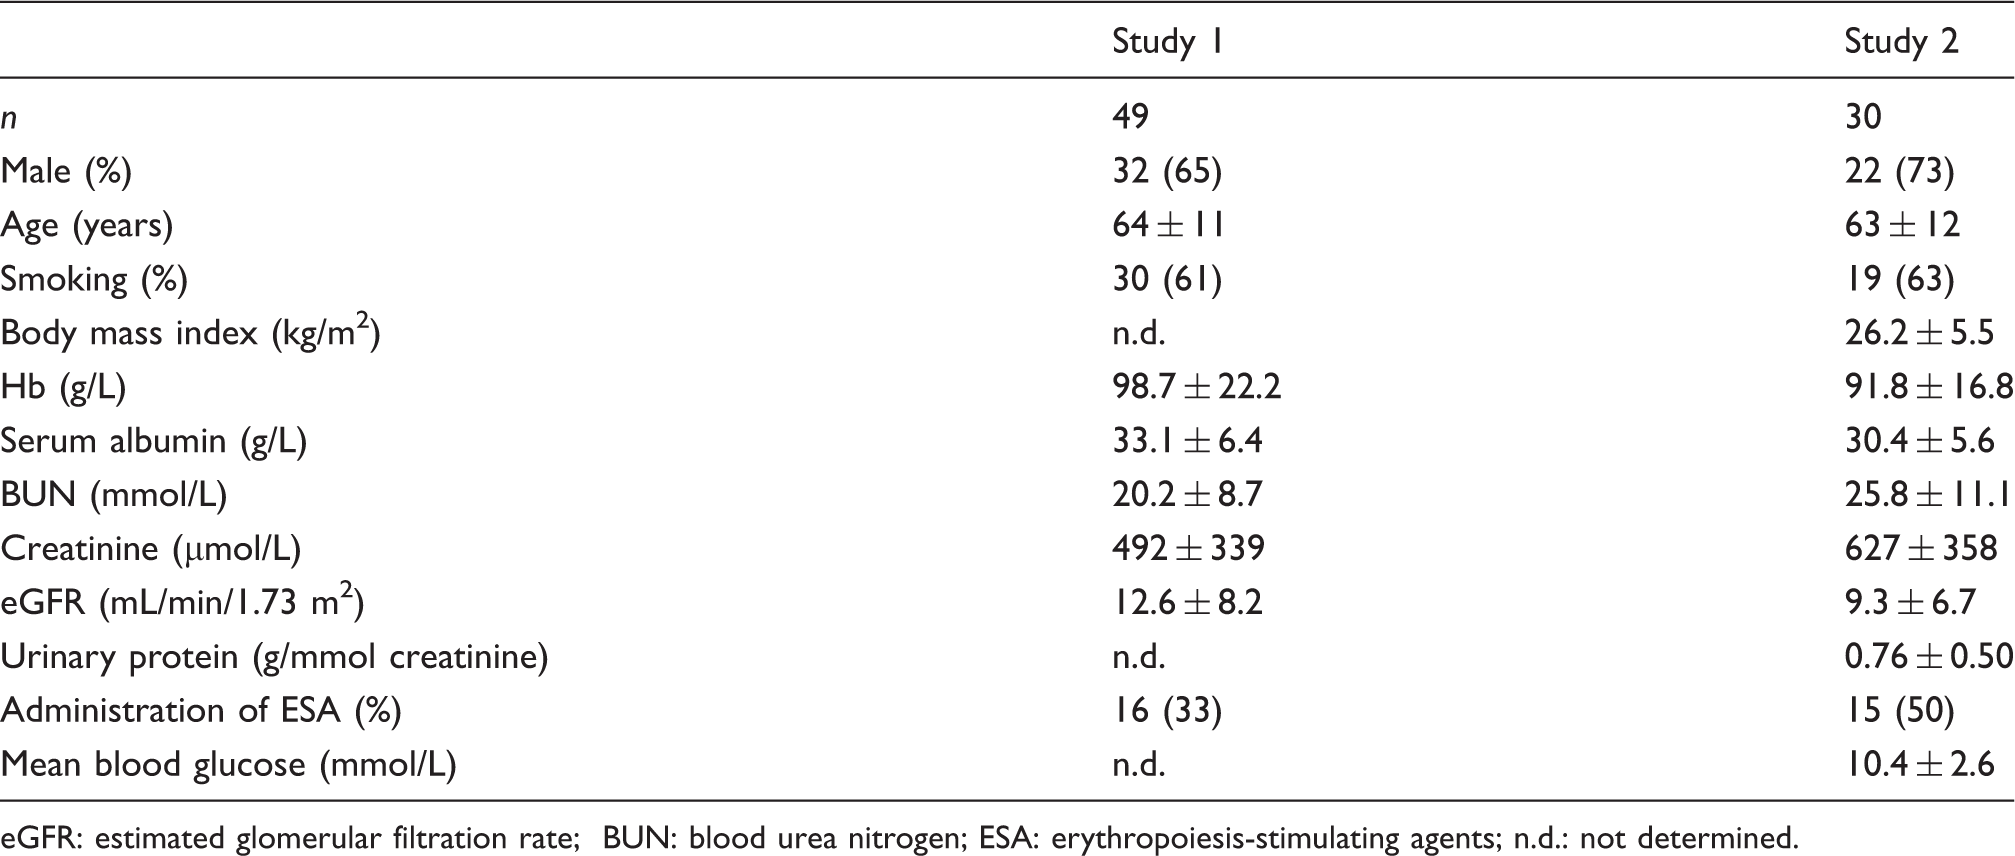
eGFR: estimated glomerular filtration rate; BUN: blood urea nitrogen; ESA: erythropoiesis-stimulating agents; n.d.: not determined.
The participants were underwent a complete history, physical examination and blood chemistry, including SA, HbA1c and GA. Blood samples were collected early in the morning under fasting conditions for the determination of HbA1c and GA, as well as blood biochemical testing. Blood glucose was measured seven times a day (before and after each meal and before bed) and MBG was calculated from these blood glucose values.
Informed consent was obtained from all patients, and the study protocol was approved by the Institutional Ethics Committees of Kurume University School of Medicine, Kinki Central Hospital and Osaka University Hospital, Japan.
Measurements
The blood glucose and SA concentrations were determined by the glucose oxidase and modified bromocresol purple methods, 19 respectively. HbA1c was measured with high performance liquid chromatography using ADAMS-A1c HA-8181 (Arkray Inc., Kyoto, Japan). The HbA1c values were converted to National Glycohemoglobin Standardization Program equivalent values or International Federation of Clinical Chemistry equivalent values in accordance with the official equation. 20 Serum GA was determined by a Hitachi 7600 autoanalyser (Hitachi Instruments Service Co., Tokyo, Japan), using the enzymatic method. This method utilizes albumin-specific proteinase, ketoamine oxidase and albumin assay reagents (Lucica GA-L; Asahi Kasei Pharma Co., Tokyo, Japan). 21 The reference ranges of HbA1c and GA are between 4.6% and 6.2% (26.7 mmol/mol and 44.2 mmol/mol) and 11.7% and 16.0%, respectively. Interassay coefficient variations of HbA1c and GA were 1.3% and 2.5%, respectively.
The eHbA1c was calculated from MBG using Rohlfing’s formula
13
(eHbA1c [%] = MBG [mmol/L]/1.98 + 2.17), as described previously.14,15 Since the GA/HbA1c ratio in patients with type 2 diabetes mellitus was 2.7,
22
eGA was determined by multiplying eHbA1c by 2.7. The adjGA was calculated by the regression formula (GA [%] = 0.432 × SA [g/L] + 4.81), obtained from the correlation between SA and GA in a total of 49 cases as shown in Results section. This is based on the mean GA concentrations (GA; 19.2%) of the 49 cases shown below (Study 1).

Statistical analyses
All data are shown as mean ± SD. To assess the difference between the measured (mHbA1c, mGA) or adjusted values (adjGA) and estimated values (eHbA1c, eGA), paired Student’s t-test was used. To assess the differences between continuous variables, single linear univariate regression analyses and stepwise multiple regression analysis were performed with the StatView computer program (Version 5.0 for Windows, Abacus Concepts, Berkeley, CA). In the stepwise multiple regression analysis, the F-value for the inclusion of the variables was set at 4.0. A P value of <0.05 was considered to be statistically significant.
Results
Correlation between GA and SA in the patients (Study 1)
We examined the correlation between GA and SA in 49 diabetes patients with ESRD not on haemodialysis. There was a significant positive correlation between GA and SA in these patients (r = 0.514, P < 0.001) (data not shown). The regression equation was GA (%) = 4.32 ×(SA [g/L] + 4.81). Since the mean GA concentrations in these patients were 19.2%, we created the formula for adjGA using these data, as described in Materials and methods section.
Clinical characteristics of the patients (Study 2)
The clinical characteristics of the patients in Study 2 are as follows. The eGFR, Hb and SA concentrations in 30 diabetic patients with ESRD who were not on haemodialysis were 9.3 ± 6.7 mL/min/1.73 m2, 91.8 ± 16.8 g/L and 30.4 ± 5.6 g/L, respectively (Table 1). Their urinary protein concentrations were 0.76 ± 0.50 g/mmol creatinine. ESA was administered in 15 patients (50%). MBG concentrations were calculated from diurnal variation were 10.4 ± 2.6 mmol/L.
Correlation between Hb, mHbA1c and eHbA1c concentrations in the patients
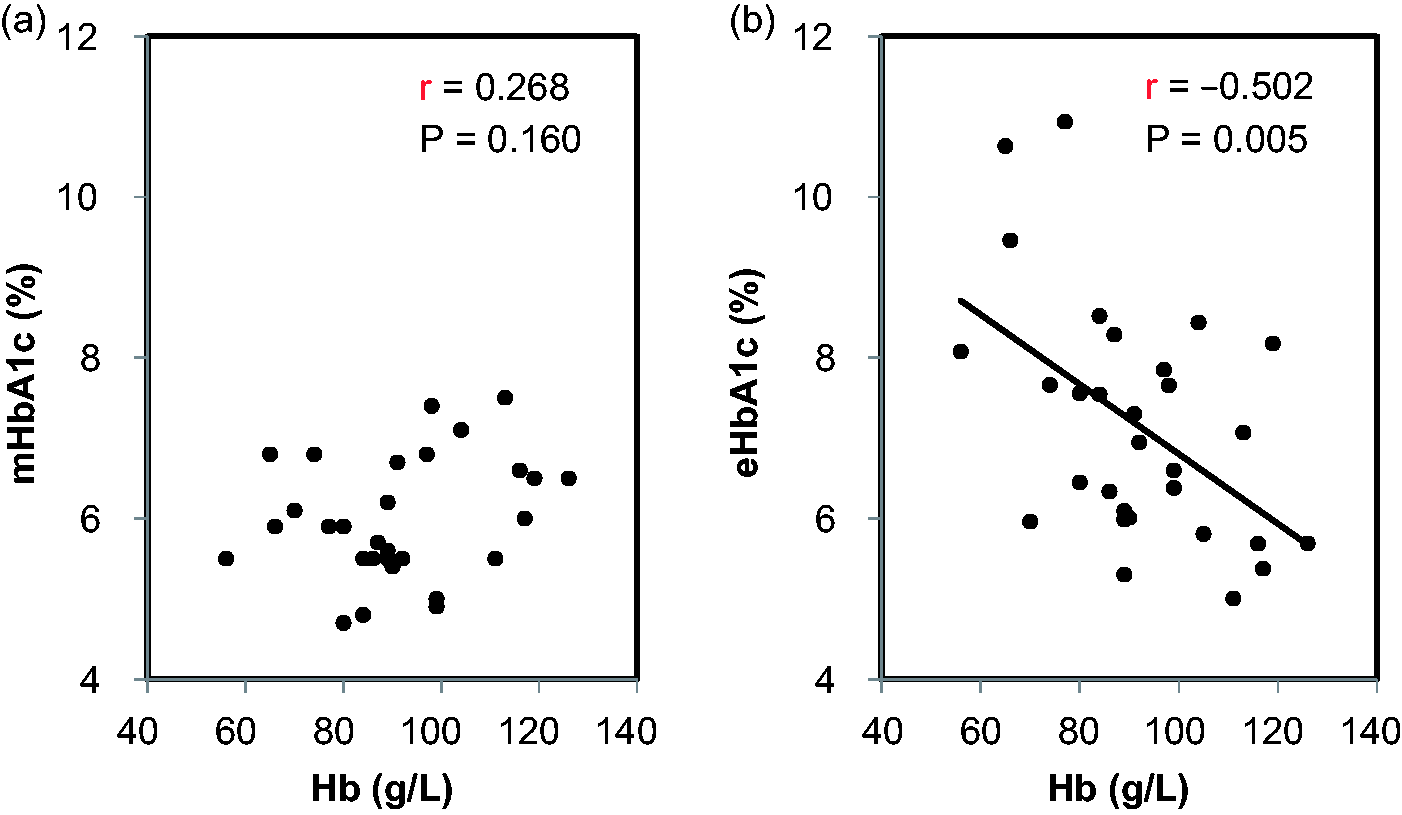
The mHbA1c concentrations in the patients were 6.0 ± 0.8% (42.0 ± 8.3 mmol/mol). The concentrations were less than 8% (63.9 mmol/mol) in all of the patients, and there were only three patients (10%) with a mHbA1c concentration of 7% (53.0 mmol/mol) or higher. On the other hand, eHbA1c concentrations were 7.2 ± 1.5% (54.8 ± 16.3 mmol/mol), which was significantly higher than mHbA1c (P < 0.001) values. The eHbA1c concentrations in half of the patients (15 patients: 50%) were 7% (53.0 mmol/mol) or higher. There was no significant correlation between mHbA1c and eHbA1c concentrations (r = 0.247, P = 0.196), and the majority of the mHbA1c concentrations was positioned under the straight line of y = x (Figure 1a). Furthermore, the mHbA1c/eHbA1c ratio was positively correlated with Hb concentrations (r = 0.632, P < 0.001) (Figure 1b). No significant correlation was found between mHbA1c and Hb concentrations (r = 0.268, P = 0.160), whereas eHbA1c concentrations were significantly and inversely correlated with the Hb concentrations in these patients (r = −0.502, P = 0.005) (Figure 2b). There was no correlation between mHbA1c and eHbA1c in patients with (r = 0.417, P = 0.138) or without ESA (r = 0.406, P = 0.133). There was also no correlation between mHbA1c and eHbA1c in patients with high mHbA1c (mHbA1c ≥6.0%, n = 14; r = 0.246, P = 0.398) or low mHbA1c (mHbA1c <6.0%, n = 16; r = 0.320, P = 0.246).
Correlations between the measured HbA1c (mHbA1c) and estimated HbA1c (eHbA1c) and between the mHbA1c/eHbA1c ratio and Hb levels in the diabetic patients with ESRD not on haemodialysis. The correlation between the mHbA1c and eHbA1c (a) and that between the mHbA1c/eHbA1c ratio and Hb levels (b) are shown. The straight line of y = x (a) and 100% points of the mHbA1c/eHbA1c ratio (b) are shown with dotted lines. Correlations between the measured HbA1c (mHbA1c) or estimated HbA1c (eHbA1c) and Hb levels in the diabetic patients with ESRD not on haemodialysis. The correlations between mHbA1c (a) or eHbA1c (b) and Hb levels are shown.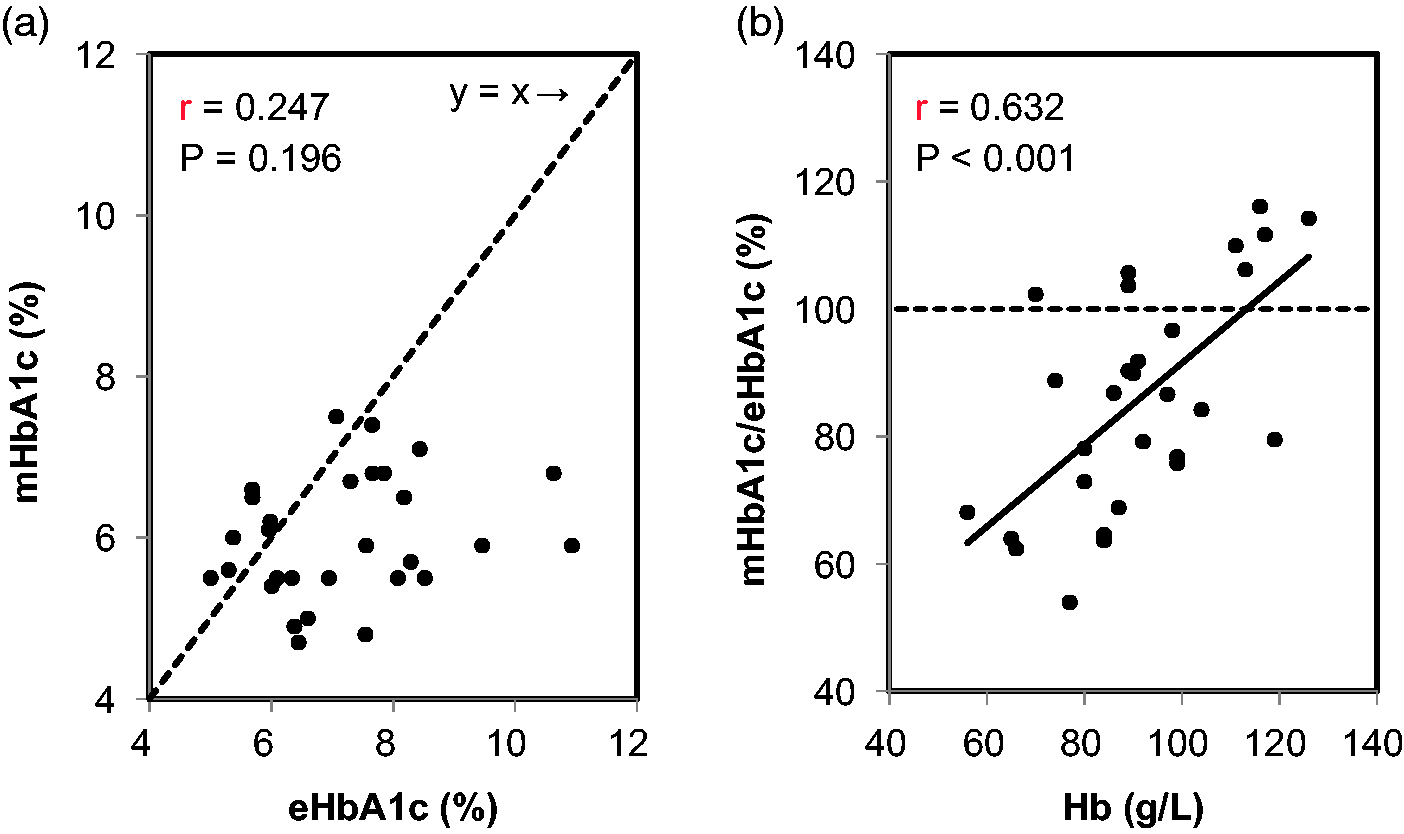
SA-adjGA concentrations are correlated with eGA concentrations in the patients
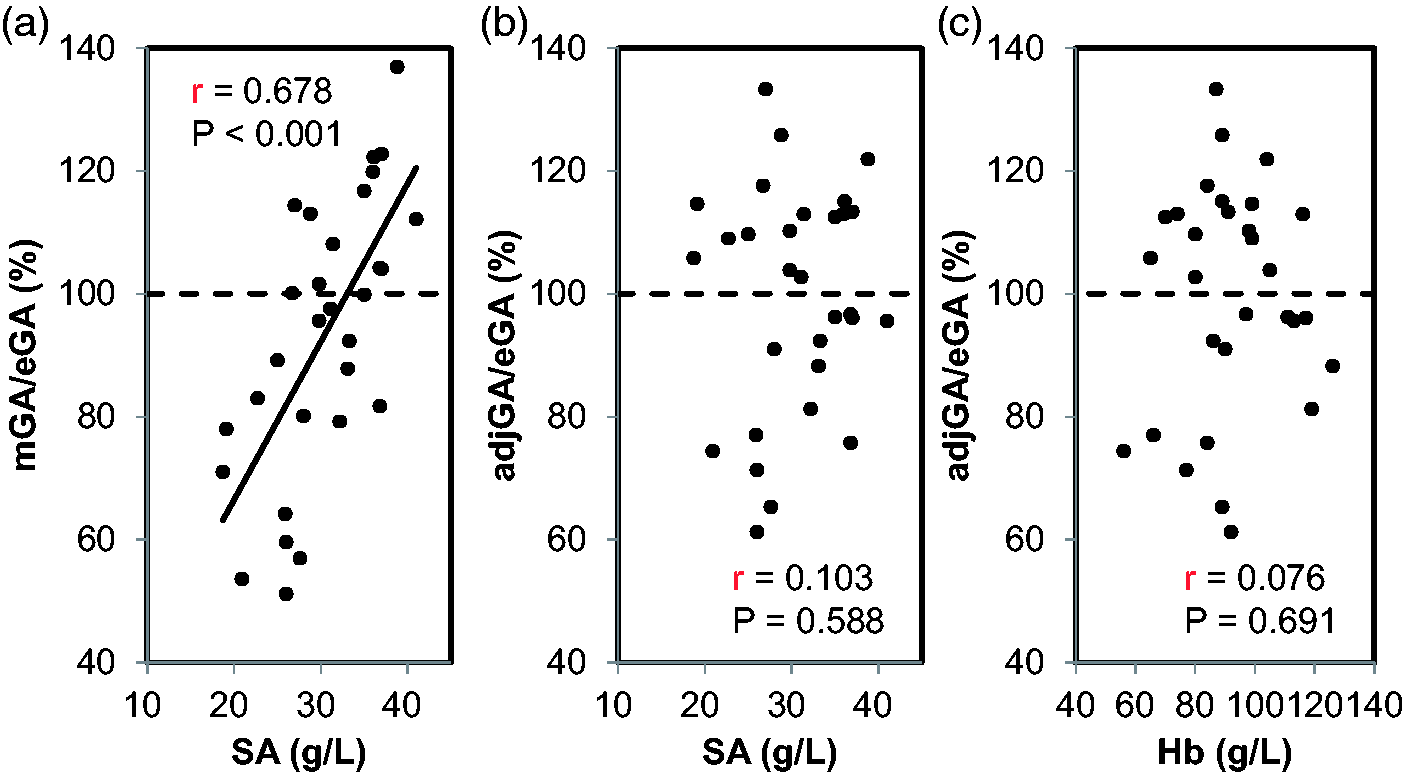
Next, we examined whether the adjGA concentrations were correlated with the eGA values in the patients. The mGA concentrations were lower than eGA concentrations (17.8 ± 4.8% vs. 19.3 ± 4.0%; P = 0.086), whereas no significant difference was observed between the adjGA and eGA (19.1 ± 4.9% vs. 19.3 ± 4.0%; P = 0.744). Although the mGA was positively correlated with eGA (r = 0.409, P = 0.025), the regression formula (y = 0.49 x + 8.3) shifted toward being under the straight line of y = x (Figure 3a). On the other hand, adjGA concentrations were significantly and strongly correlated with eGA concentrations (r = 0.638, P < 0.001), resulting in the regression formula (y = 0.77 x + 4.1) being near to the straight line of y = x (Figure 3b). Furthermore, the mGA/eGA ratio was positively correlated with SA concentrations (r = 0.678, P < 0.001), whereas no significant correlation was found between the adjGA/eGA ratio and SA (r = 0.103, P = 0.588) or Hb concentrations (r = 0.076, P = 0.691) (Figure 4). In addition, we performed stepwise multiple regression analysis with adjGA as an objective variable and with age, body mass index, smoking and eGA as explanatory variables. The result showed that eGA was a sole significant explanatory variables (β = 0.638, P = 0.005).
Correlations between the measured GA (mGA) or adjusted GA (adjGA) and estimated GA (eGA) in the diabetic patients with ESRD not on haemodialysis. The correlations between mGA (a) or adjGA (b) and eGA levels are shown. The straight line of y = x is shown with a dotted line. Correlations between the measured GA (mGA)/estimated GA (eGA) ratio or the adjusted GA (adjGA)/eGA ratio and serum albumin (SA) levels and between the adjGA/eGA ratio and Hb levels in the diabetic patients with ESRD not on haemodialysis. The correlations between the mGA/eGA ratio (a) or the adjGA/eGA ratio (b) and SA levels and between the adjGA/eGA ratio and Hb levels (c) are shown. The 100% points of the mGA/eGA ratio or the adjGA/eGA ratio are shown with a dotted line.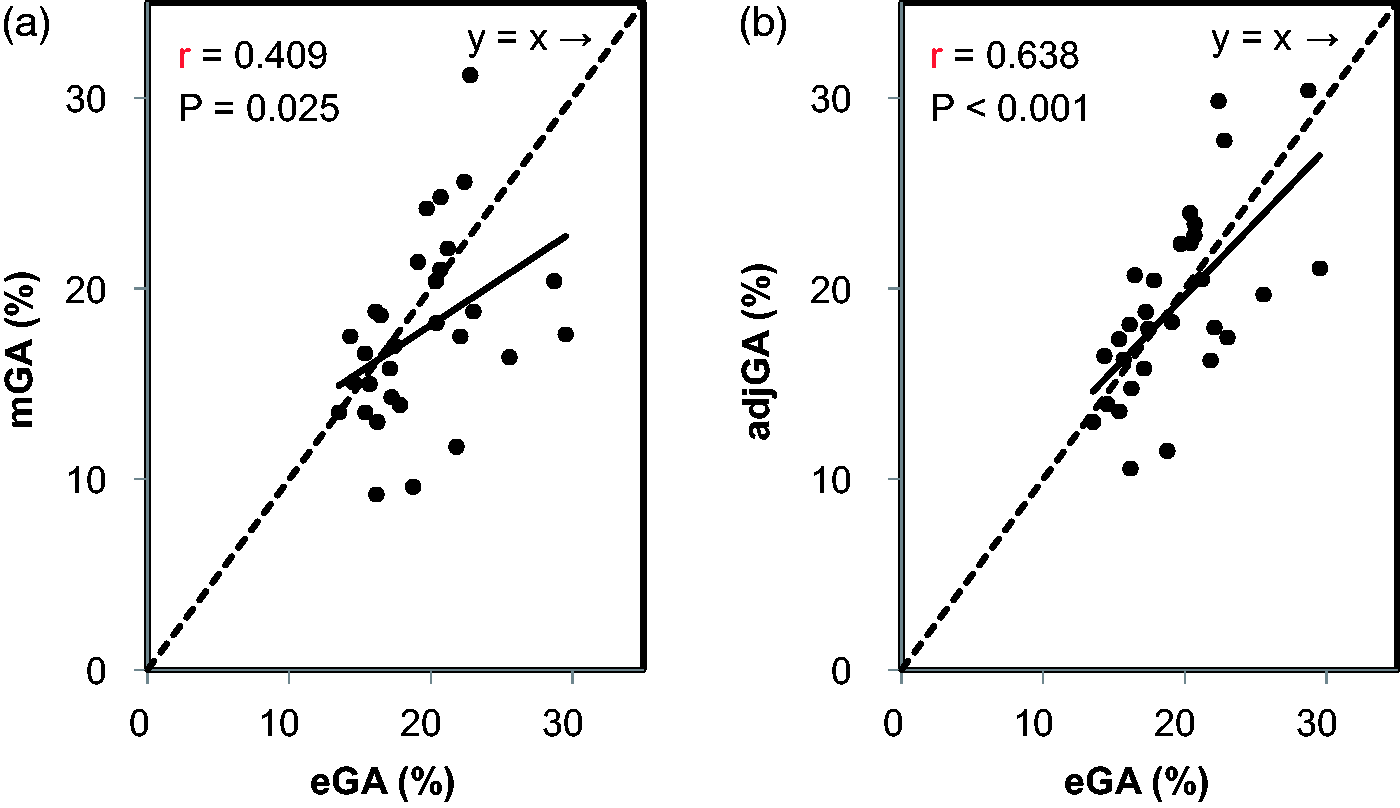
Effects of renal function on estimated glycaemic markers in the patients
Finally, we investigated whether renal function could influence the glycaemic indices in these patients. The eGFR concentrations were significantly and strongly correlated with the Hb concentrations (r = 0.676, P < 0.001), but were modestly correlated with SA (r = 0.443, P = 0.014). Further, the eGFR concentrations were positively associated with the mHbA1c/eHbA1c ratio (r = 0.586, P < 0.001), but there was no correlation of eGFR with the mGA/eGA ratio (r = 0.227, P = 0.227) and adjGA/eGA ratio (r = −0.028, P = 0.885) (Figure 5).
Correlations between the measured HbA1c (mHbA1c)/estimated HbA1c (eHbA1c) ratio, the measured GA (mGA)/estimated GA (mGA) ratio or the adjusted GA (adjGA)/eGA ratio and eGFR in the diabetic patients with ESRD not on haemodialysis. The correlations between the mHbA1c/eHbA1c ratio (a), the mGA/eGA ratio (b) or the adjGA/eGA ratio (c) and eGFR are shown. The 100% points of the mHbA1c/eHbA1c ratio, the mGA/eGA ratio or the adjGA/eGA ratio are shown with dotted lines.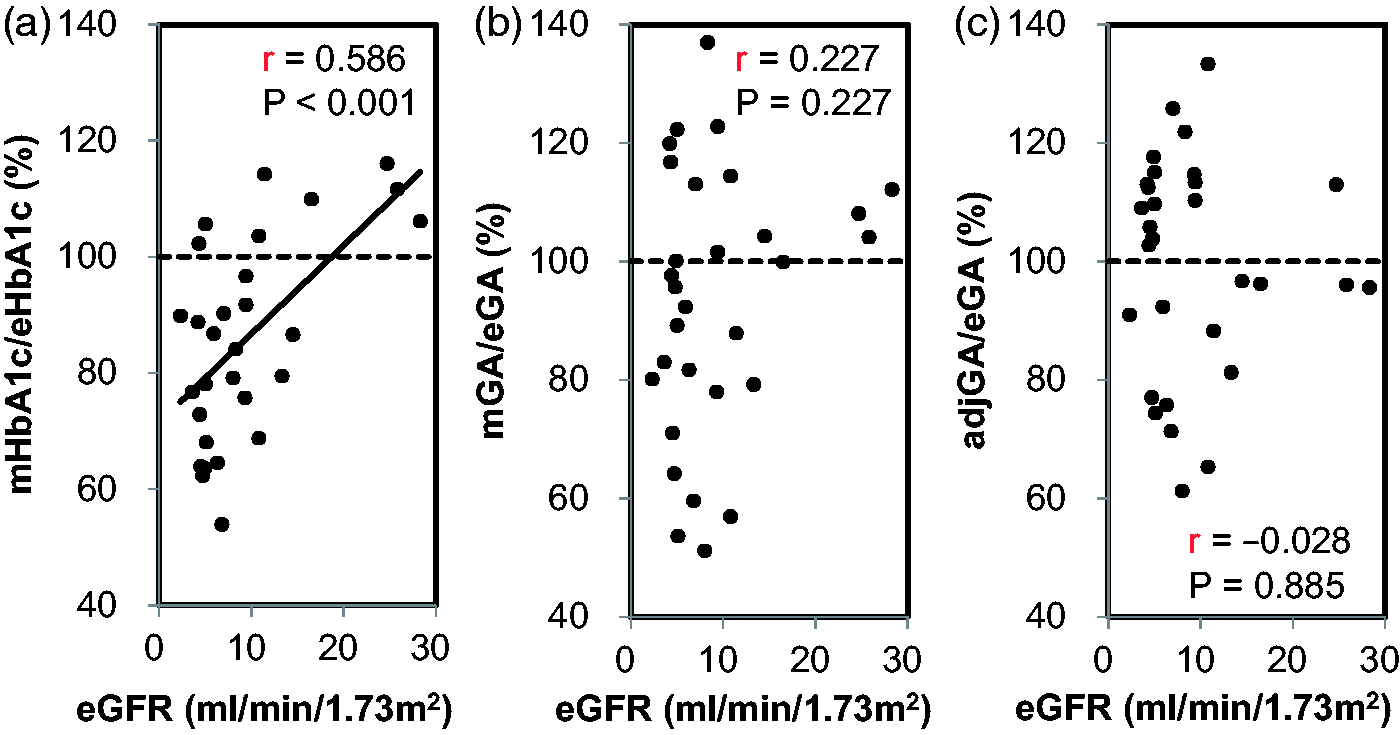
Discussion
In the present study, we found that the concentrations of HbA1c and GA were lower than the real glycaemic control in diabetic patients with ESRD not on haemodialysis, suggesting that glycaemic control was underestimated by evaluating with both HbA1c and GA in these patients. Since the adjGA concentrations could accurately reflect the glycaemic control in such patients without being influenced by anaemia and hypoalbuminemia, the evaluation of glycaemic control by adjGA may be desirable in diabetic patients with ESRD complicated with both renal anaemia and hypoalbuminemia. To the best of our knowledge, this is the first report to investigate an appropriate indicator for glycaemic control in diabetic patients with ESRD who are not on haemodialysis.
A shortened lifespan of red blood cells due to renal anaemia has been reported in diabetic patients with haemodialysis. 9 It has been suggested that HbA1c concentrations are also apparently lower in diabetic patients with ESRD not on haemodialysis.6,9 In the present study, mHbA1c concentrations were found to be significantly lower than eHbA1c, and no significant correlation was found between mHbA1c and eHbA1c, suggesting that HbA1c does not accurately reflect their real glycaemic control in diabetic patients with ESRD who are not on haemodialysis. Furthermore, the mHbA1c/eHbA1c ratio was significantly and positively correlated with Hb concentrations, suggesting that the discrepancy between the two indices becomes greater in accordance with the progression of anaemia. Surprisingly, the Hb concentrations were inversely correlated with eHbA1c, but not with mHbA1c, indicating that the patients with anaemia may presumably be observed without strict glycaemic control because HbA1c concentrations are apparently low. These findings emphasize that the glycaemic control might not be adequately attained when diabetes is treated based on HbA1c in diabetic patients with ESRD who are not on haemodialysis. Therefore, a novel indicator for evaluating glycaemic control accurately is urgently necessity in these patients.
Administration of ESA has been reported to reduce HbA1c concentrations in diabetic patients undergoing haemodialysis because of the shorten lifespan of red blood cells.7,8,23 To the contrary, ESA has also been shown to have no impact on HbA1c concentrations in diabetic patients with ESRD not on haemodialysis. 9 In the present study, HbA1c and Hb concentrations in patients treated with ESA were not significantly different from the concentrations in patients without ESA (data not shown). The effect of the administration of ESA on HbA1c concentrations may be limited in patients who are not on haemodialysis because dose of ESA in these patients is usually lower than that in patients with haemodialysis. Therefore, further clinical studies are required to determine whether HbA1c concentration is directly affected by the ESA treatment in diabetic patients with ESRD who are not on haemodialysis.
Massive urinary protein excretion in diabetic patients with ESRD is not usually disappeared until they start haemodialysis and become anuria. Therefore, GA might be useful for glycaemic control in anuric diabetic patients on haemodialysis.9–11 Furthermore, it has been revealed that the prognosis of these patients becomes poorer in patients with higher GA compared with those with lower GA, indicating that GA per se become a desirable and prognostic indicator in diabetic patients on haemodialysis.24,25 However, in diabetic ESRD patients without anuria, massive proteinuria induces severe hypoalbuminemia, which might accelerate turnover of albumin metabolism, thereby being involved in a lower GA concentrations.11,12 These findings are consistent with our findings showing that the mGA/eGA ratio was positively associated with SA concentrations. To the contrary, no significant difference was found between adjGA and eGA concentrations, suggesting that both indicators are almost equivalent. Since the adjGA/eGA ratio did not show a significant correlation with either Hb or SA concentrations, adjGA could be a useful indicator of real glycaemic control in diabetic patients with both renal anaemia and hypoalbuminemia.
Although the mHbA1c/eHbA1c ratio was positively associated with eGFR, no significant correlation was found between the mGA/eGA ratio and eGFR. These results are consistent with a previous finding showing that the lifespan of red blood cell is positively correlated with eGFR and HbA1c, but not GA. 9 Therefore, HbA1c concentrations might be influenced by renal dysfunction in diabetic patients with ESRD not on haemodialysis. In addition, since no significant correlation was found between the adjGA/eGA ratio and eGFR, adjGA might accurately reflect the glycaemic control conditions unaffected by renal function in patients with ESRD.
In the present study, we found that patients with anaemia might be left under poor glycaemic control when HbA1c is used as an indicator of glycaemic control in diabetic patients with ESRD not on haemodialysis. Although the importance of antihypertensive agents, particularly RAS inhibitors, for diabetic patients with ESRD has been reported,26,27 the clinical impact of glycaemic control in these patients has not been fully understood because of the lack of epidemiological studies associated with the effect of strict glycaemic control on cardiovascular diseases and/or mortality. This might be due to the lack of an appropriate indicator of real glycaemic control in such patients. Recently, GA, but not HbA1c, has been shown to be significantly associated with cardiovascular events and/or mortality in diabetic patients with ESRD on haemodialysis.23,24 These findings might be due to the accurate glycaemic control by measuring GA in these patients.6–8 Therefore, the appropriate glycaemic control using adjGA may improve the patient’s prognosis through the inhibiting the onset and progression of cardiovascular diseases in these subjects. Further clinical prospective studies are necessary to clarify whether the onset and progression of cardiovascular events and/or mortality can be suppressed by the appropriate glycaemic control using adjGA in these patients.
There are some limitations in this study. First, because the number of the patients was small, there is a possibility that the values used for the adjGA might become a factor for variation. Therefore, it will be necessary to make modified calculation formula using a number of patients in future. Second, we estimated HbA1c and GA using MBG obtained from the diurnal variation, not by continuous glucose monitoring (CGM), which is more accurate for evaluating glycaemic control. 28 Third, the adjGA has not been generalized in this population. Fourth, we did not show any reliable data of long-term glycaemic control except for HbA1c or GA. Further, the GA/HbA1c ratio might show the significant diversity in diabetic patients. So, it is hard to evaluate the indices related to HbA1c and GA calculated in the study. Therefore, it is necessary to verify our findings and reliable GA/HbA1c ratio in a long-term and prospective study by using CGM in a large number of diabetic patients with ESRD in the future. Finally, we did not provide the data on proteinuria and MBG in Study 1. Therefore, it might not be comparable between Study 1 and study 2. However, since the SA and GA concentrations in Study 1 were almost equal compared with those in Study 2, urinary albumin and MBG may not be different between Study 1 and Study 2.
In conclusion, the present study demonstrated that the adjGA, but not mHbA1c and mGA, could accurately reflect glycaemic control in diabetic patients with ESRD who are not on haemodialysis. Therefore, adjGA might be a useful indicator of glycaemic control in these patients.
Footnotes
Declarations of conflicting interests
None declared.
Funding
This research received no specific grant from any funding agency in the public, commercial, or not-to-profit sectors.
Ethical approval
The ethics committee at Kurume University School of Medicine (reference number, 13302), Kinki Central Hospital (reference number, 173) and Osaka University Hospital (reference number, 9275) approved this study.
Guarantor
MK.
Contributorship
KF researched literature, researched data, contributed to the discussion, wrote and edited the manuscript. KY and SO contributed to the discussions and edited the manuscript. RS and HN researched data. MK researched literature, conceived the study, wrote the first draft of the manuscript, edited the manuscript and contributed to the discussions. All authors approved its final version.