
Abstract
Introduction
Reliable serum creatinine measurements are of vital importance for the correct classification of chronic kidney disease and early identification of kidney injury. The National Kidney Disease Education Programme working group and other groups have defined clinically acceptable analytical limits for creatinine methods. The aim of this study was to re-evaluate the performance of routine creatinine methods in the light of these defined limits so as to assess their suitability for clinical practice.
Method
In collaboration with the Dutch External Quality Assurance scheme, six frozen commutable samples, with a creatinine concentration ranging from 80 to 239 μmol/L and traceable to isotope dilution mass spectrometry, were circulated to 91 laboratories in four European countries for creatinine measurement and estimated glomerular filtration rate calculation. Two out of the six samples were spiked with glucose to give high and low final concentrations of glucose.
Results
Results from 89 laboratories were analysed for bias, imprecision (%CV) for each creatinine assay and total error for estimated glomerular filtration rate. The participating laboratories used analytical instruments from four manufacturers; Abbott, Beckman, Roche and Siemens. All enzymatic methods in this study complied with the National Kidney Disease Education Programme working group recommended limits of bias of 5% above a creatinine concentration of 100 μmol/L. They also did not show any evidence of interference from glucose. In addition, they also showed compliance with the clinically recommended %CV of ≤4% across the analytical range. In contrast, the Jaffe methods showed variable performance with regard to the interference of glucose and unsatisfactory bias and precision.
Conclusion
Jaffe-based creatinine methods still exhibit considerable analytical variability in terms of bias, imprecision and lack of specificity, and this variability brings into question their clinical utility. We believe that clinical laboratories and manufacturers should work together to phase out the use of relatively non-specific Jaffe methods and replace them with more specific methods that are enzyme based.
Introduction
The accurate measurement of creatinine is essential for the estimation of glomerular filtration rate (GFR). Sources of variability in estimated GFR (eGFR) include biological variability in creatinine, the eGFR calculation and analytical variability in the measurement of serum creatinine both within and between instruments and laboratories. The variability in creatinine measurement was significantly improved following the universal implementation of creatinine methods calibrated to an isotope dilution mass spectrometry (IDMS) reference method. 1 The availability of National Institute of Standard and Technology reference material (SRM 967) and the IDMS reference method for creatinine has led to the international agreement for calibrating routine creatinine methods to higher order reference system. 2 The National Kidney Disease Education Programme working group (NKDEP-WG) has defined the acceptable analytical performance of creatinine methods that maintains eGFR within clinically acceptable limits. This was defined as a contribution of analytical error to GFR estimation that does not exceed 10%. 3 Because of the dramatic reduction in GFR which may occur with serum creatinine concentrations within the reference interval, the impact of bias and imprecision on the error of the eGFR calculation is clinically significant at creatinine concentrations between 85 and 150 μmol/L. This range corresponds to an eGFR of approximately 60 mL/min/1.73 m2 depending on gender, age and ethnicity.3,4 This error would require an imprecision (%CV) of <8% and 5% bias (NKEDP-WG). While the accuracy of creatinine measurement is important in order to obtain a correct classification for GFR, precision is crucial for the identification of changes in serum creatinine concentration that helps in the early detection of acute kidney injury (AKI). While a CV of 8% or less may be acceptable for determination of eGFR, it was recently suggested that a CV% of 4% is the maximum tolerable imprecision to identify reliably an increase in serum creatinine of 26.5 μmol/L with certainty. 5
Non-creatinine chromogens such as ketones, acetone, ascorbate, pyruvate, HbA1c, glucose and a wide range of drugs are a well-recognized source of inaccuracy in Jaffe methods, which is not corrected by re-calibration. Several different creatinine methods are available for routine analysis including, Jaffe-endpoint, Jaffe-kinetic, Jaffe-compensated and enzymatic methods. The latter were developed as attempts to improve specificity of this assay; however, there has been limited success to reduce interference. 6
In this study, we have examined whether international attempts to standardize creatinine methods and consequent manufacturers’ strategies have improved the clinical performance of creatinine assays.
Methods
The study was set up in collaboration with the Dutch, Portuguese, Italian, Spanish and UK external quality assessment (EQA) schemes. The Dutch scheme SKML provided EQA material for creatinine, which had previously been established as commutable and conforming with the CLSI C53P protocol.
Target values were assigned with the isotope dilution mass spectrometry reference measurement procedure.
Six human serum samples frozen at −80℃, with a concentration covering a range of 80 to 239 μmol/L, were circulated to 91 laboratories in four European countries. Sample B (creatinine concentration of 98.1 μmol/L) was spiked with glucose to a concentration of 23.4 mmol/L and sample C (creatinine concentration 80 μmol/L) was spiked with glucose to a concentration of 5.9 mmol/L. The reason for choosing a glucose concentration of 23.4 was based on the findings of a previous pilot study. This showed that Jaffe creatinine methods demonstrated significant interference when serum was spiked with glucose to a concentration of 20 mmol/L. Samples were transported frozen to the central laboratory (EQA Laboratories in each country), and stored at −80℃. Within each country, the sets of samples were distributed frozen from the central laboratory to the participating laboratories. The laboratories were asked to measure the creatinine concentration in all six samples as soon as possible after receipt, or to store the samples at −20℃ and process them within one week, according to the manufacturers’ instructions. Outliers were defined as any result outside four standard deviation limits.
The laboratories were also asked to calculate eGFR for a 55-year old-white female and to report their results, methods, and instruments used. The target eGFR values were calculated using the MDRD equation according to Levey et al. 7 The data were inspected for outliers and those identified were excluded. The method or manufacturer mean was only calculated if results from a minimum of three laboratories were available. The criteria for acceptable bias and precision were based upon those previously described.3,5
Statistical analysis
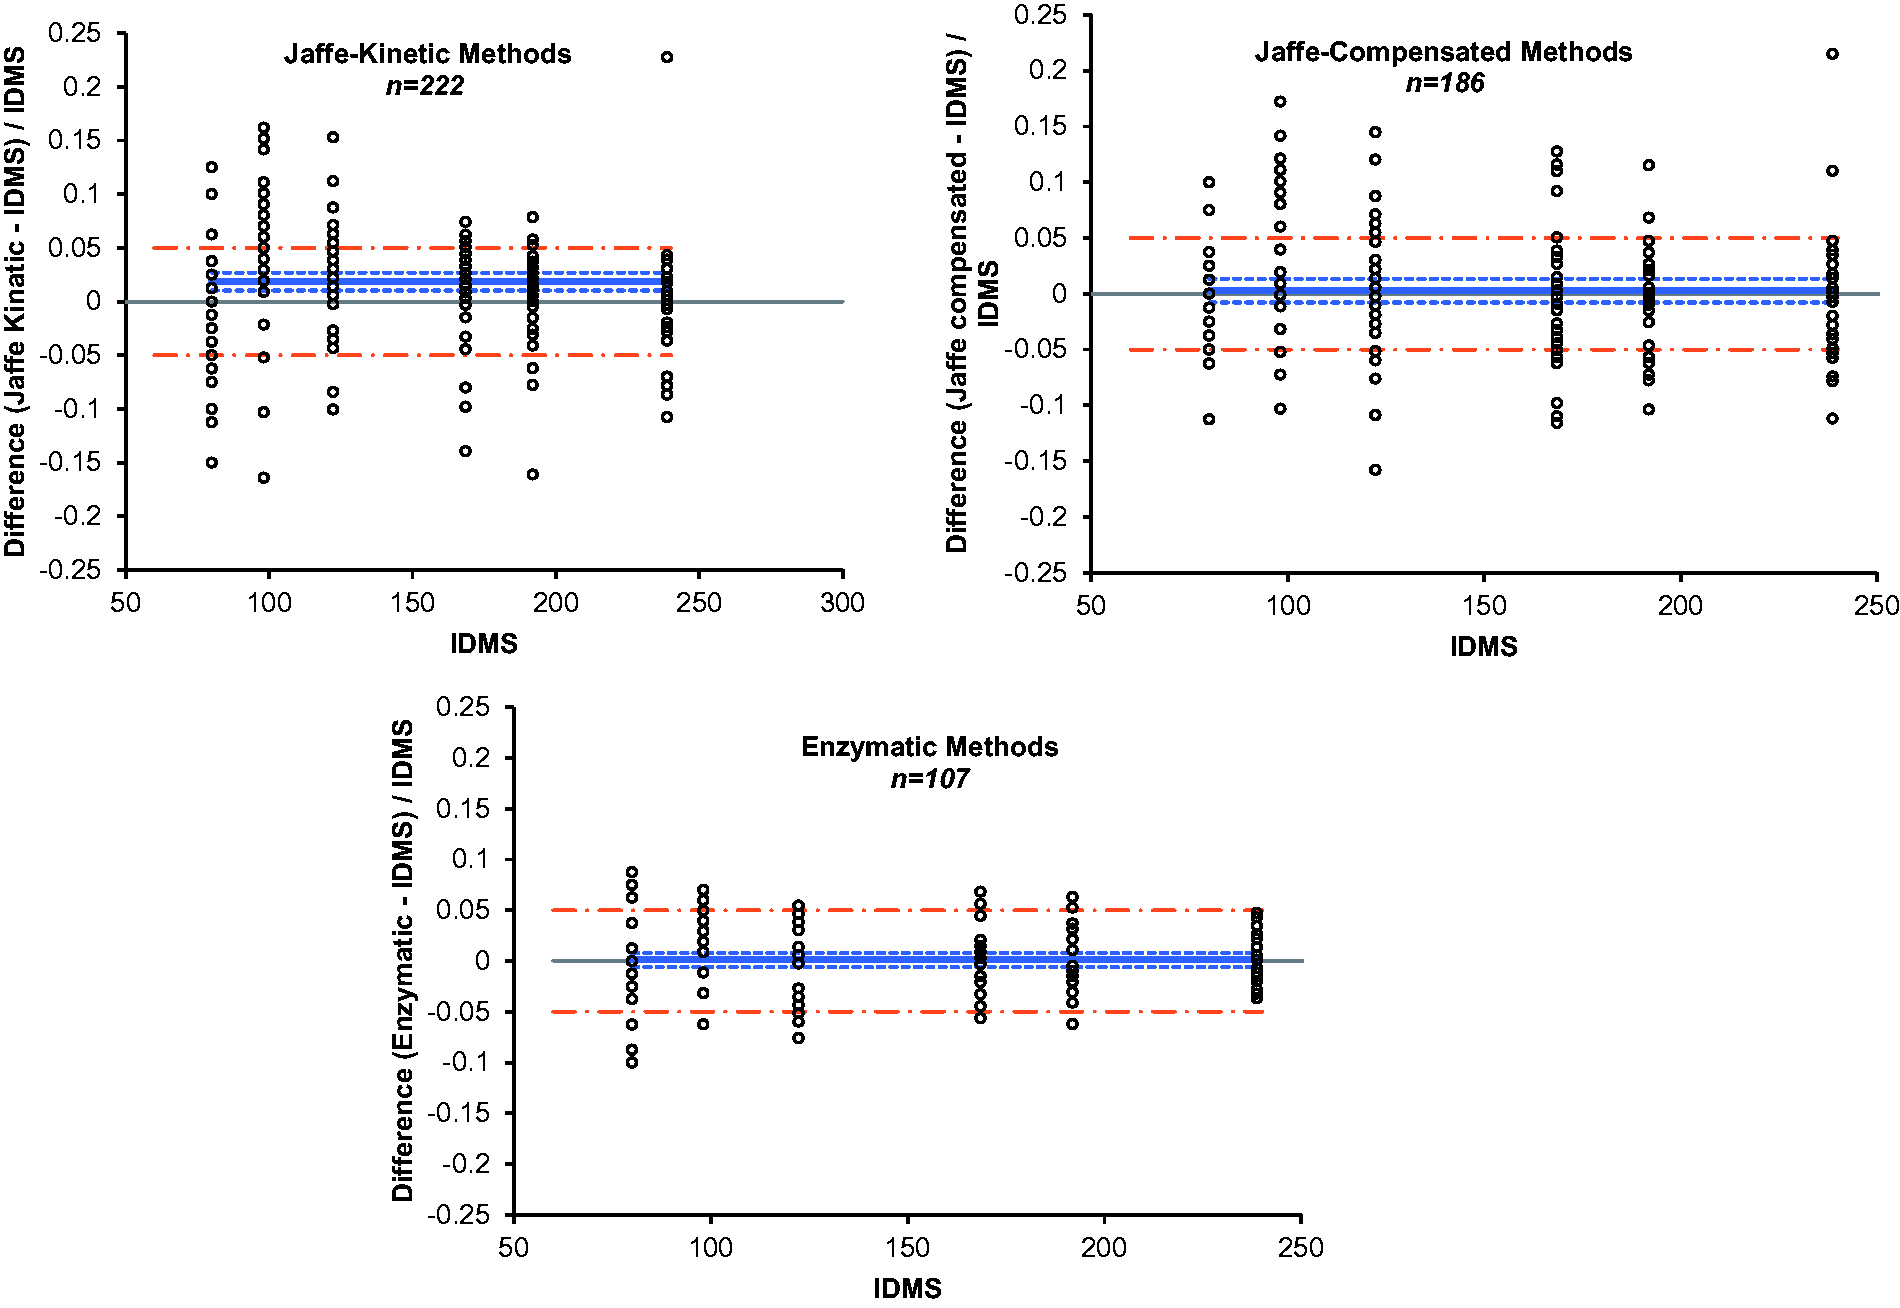
The %CV was calculated for each method group and manufacturer. Four method groups were selected; Jaffe-endpoint, Jaffe-kinetic, Jaffe-compensated and enzymatic. Differences between the results obtained by each method group, and IDMS target values were assessed using Altman–Bland analysis. All statistical analyses were performed using Analyse-it (version 2.10) for Microsoft Excel (www.analyse-it.com).
Results
Distribution of participants, by country, method and manufacturer.
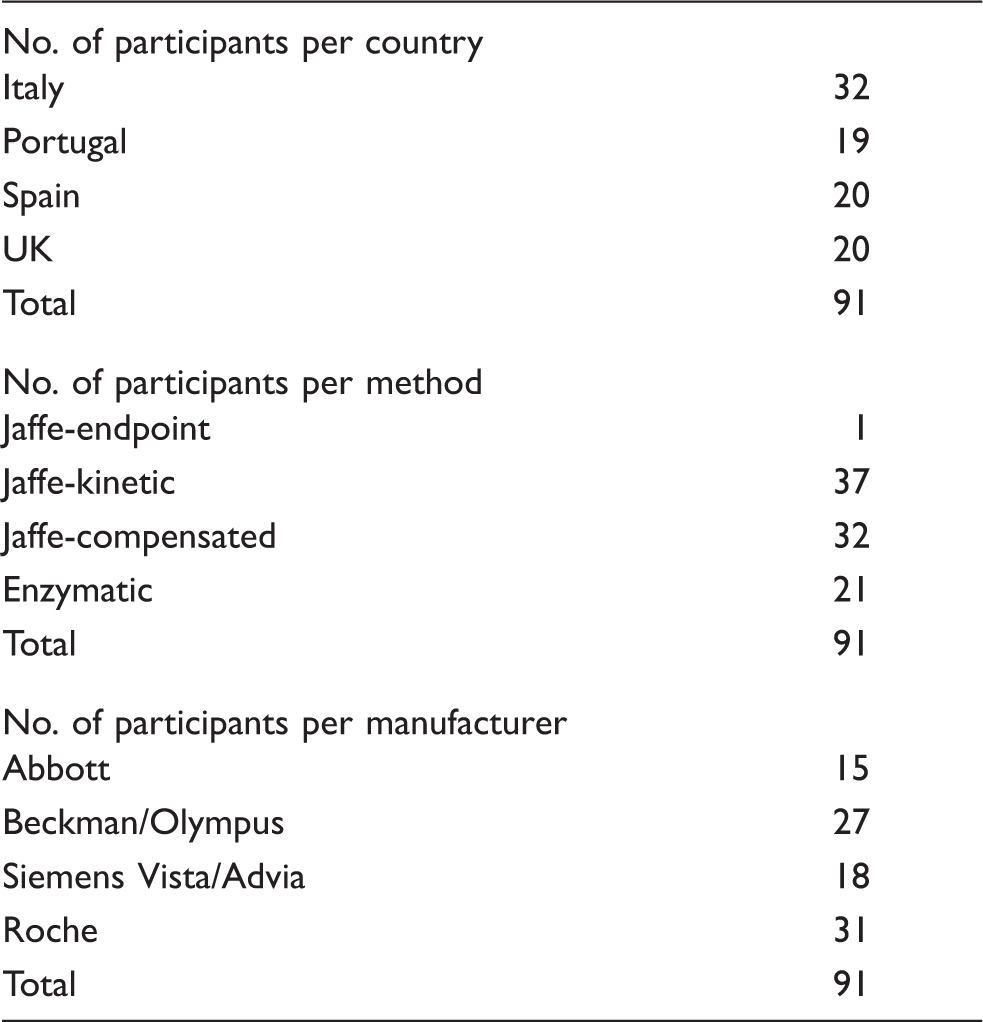
The eGFR values corresponding to creatinine concentrations of 80–239 μmol/L ranged from 24 to 65 mL/min/1.73 m2. Figure 1 presents the bias, calculated as the (Target value−Method mean value/Target value) × 100 for eGFR. With the exception of the Roche, Siemens Advia and Beckman AU enzymatic methods, the difference between the lowest and highest eGFR values for all other methods exceeded the NKDEP-WG recommended error limits of 10%. In this study, the data have not been presented for Abbott enzymatic method as there were less than three users. Although enzymatic methods appeared to be more accurate in measuring creatinine compared with Jaffe-based methods, at a low creatinine concentration they exceeded the clinically recommended limit of 5% (Figure 2).
The impact of the analytical variation of creatinine methods on eGFR bias values. In each method category, there are six sets of columns representing the bias obtained by each manufacturer for each of the six pools of serum circulated. The total number of participants (n) per manufacturer varies from at least 3 to 15. Enzymatic methods; Roche, n = 10; Siemens Advia, n = 3; Olympus, n = 3. Jaffe compensated methods; Roche, n = 15; Olympus, n = 5; Siemens Advia, n = 4. Jaffe Kinetic methods; Abbot, n = 8; Olympus, n = 8; Siemens Vista, n = 4; Beckman, n = 5. Altman–Bland plots of the results obtained using each of the three categories of method for the six serum pools distributed. The dashed line represents the limit for bias.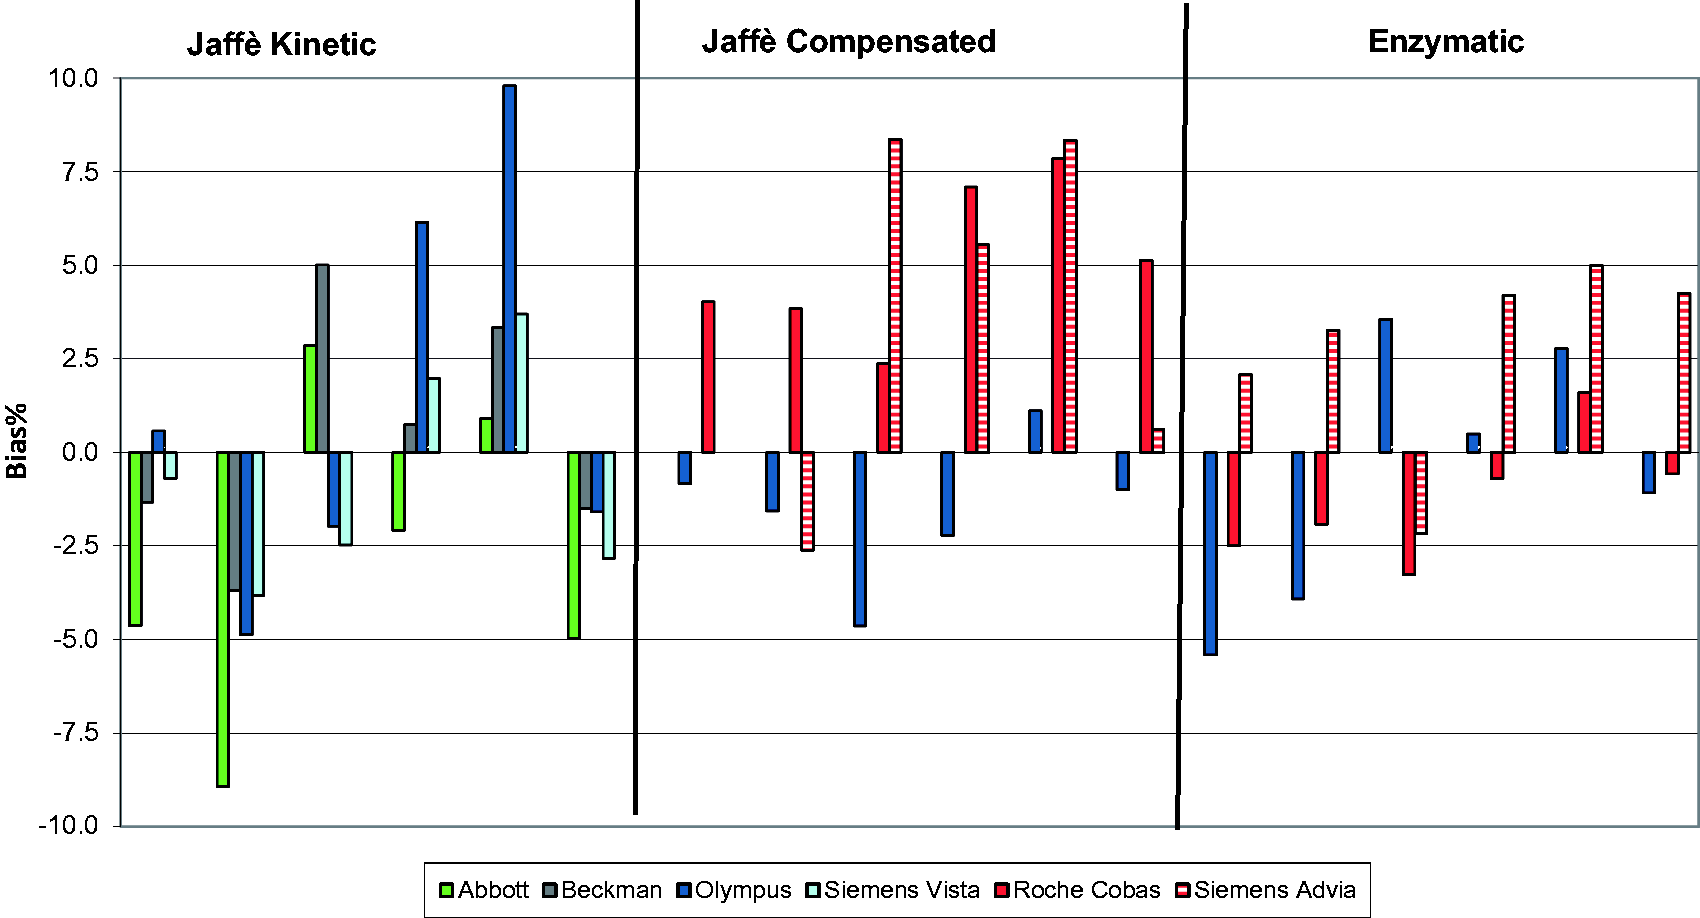
The mean CV%, calculated for each method, is shown across the analytical range of 80 to 239 μmol/L in Figure 3. In order to detect silent kidney injury, a low CV% of ≤4%, has been proposed as a clinically acceptable limit.
5
In our study, at creatinine concentrations below 100 μmol/L, all Jaffe creatinine methods exceeded this limit, whereas all of the enzymatic methods achieved a CV <4% across the creatinine concentration range.
Imprecision of each of the creatinine method groups. Dashed line represents the limit for imprecision.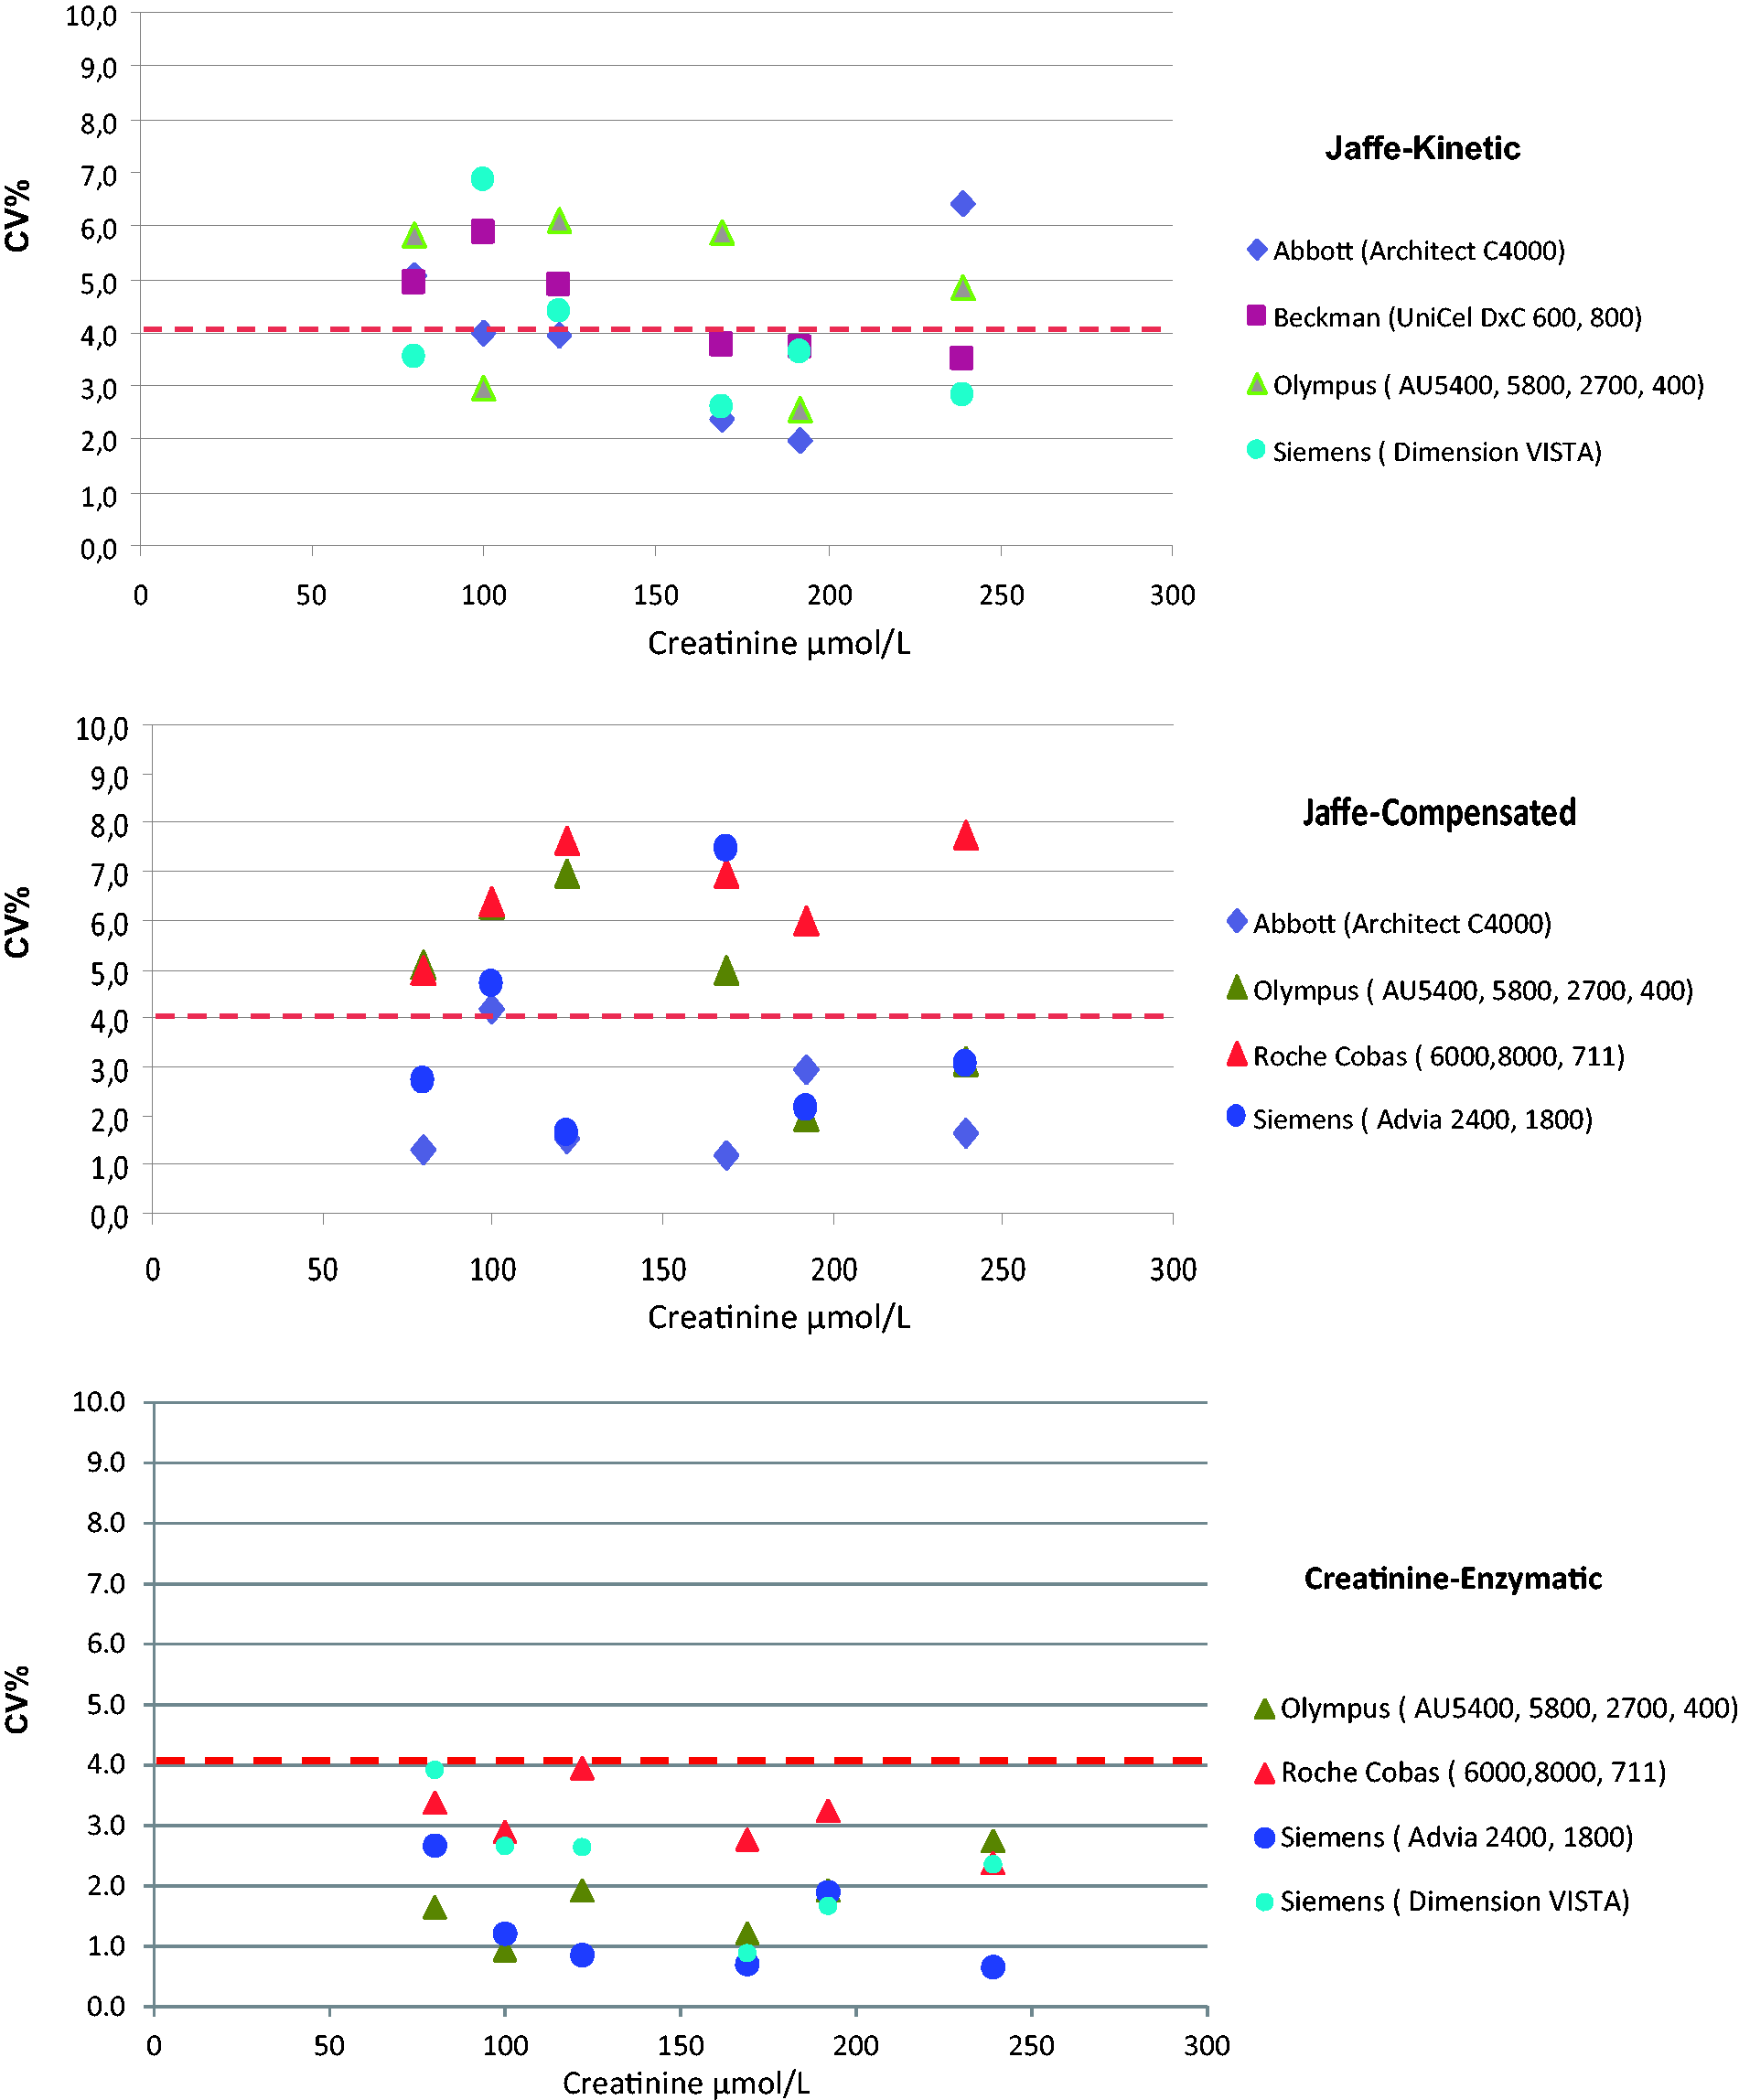
The evaluation of the impact of glucose on the performance of creatinine methods is presented in Figure 4. The results of individual laboratories that used Jaffe methods are shown in Figure 4(a) and for those that used enzymatic methods are shown in Figure 4(b). In both graphs, the star represents the coordinates of the target creatinine concentrations in the unspiked samples, B and C, i.e. 98.1, 80.0. Ideally, all results should have coordinates as close to the star as possible. Results of laboratories with a positive bias without glucose interference are close to the high end of the unity line (and with a negative bias at the low end). Results of laboratories with a positive bias due to the interference of glucose are far away on the right side of the unity line. From Figure 4(a), it can be seen that the results of the Jaffe methods are in a wide range along the unity line indicating substantial between-laboratory imprecision. In addition, the results of many of these laboratories, including 12 out of the 15 laboratories using Abbott methods (yellow dots) appear some way to the right of the unity line, indicating substantial positive bias due to glucose interference. From Figure 4(b), it can be seen that the dispersion of results of the enzymatic methods is limited and that there appears to be no interference from glucose.
Impact of glucose on the performance of creatinine methods. Creatinine in µmol/L by individual laboratories as measured in a sample with a high (x-axis; glucose 23.4 mmol/L) and a low (y-axis; glucose 5.9 mmol/L) glucose concentration. (a) Jaffe methods; (b), enzymatic methods. Coloured circles and squares indicate manufacturer; yellow, Abbott; green, Beckman-Coulter DxC; pink, Beckman-Coulter AU series; blue, Roche; violet, Siemens Advia; amber, Siemens Dimension. The star represents the coordinates of the target values assigned with the reference method. The unity line proportionally expands the ratio of the target creatinine values in samples B and C, to lower and higher creatinine ratio for results without glucose interference.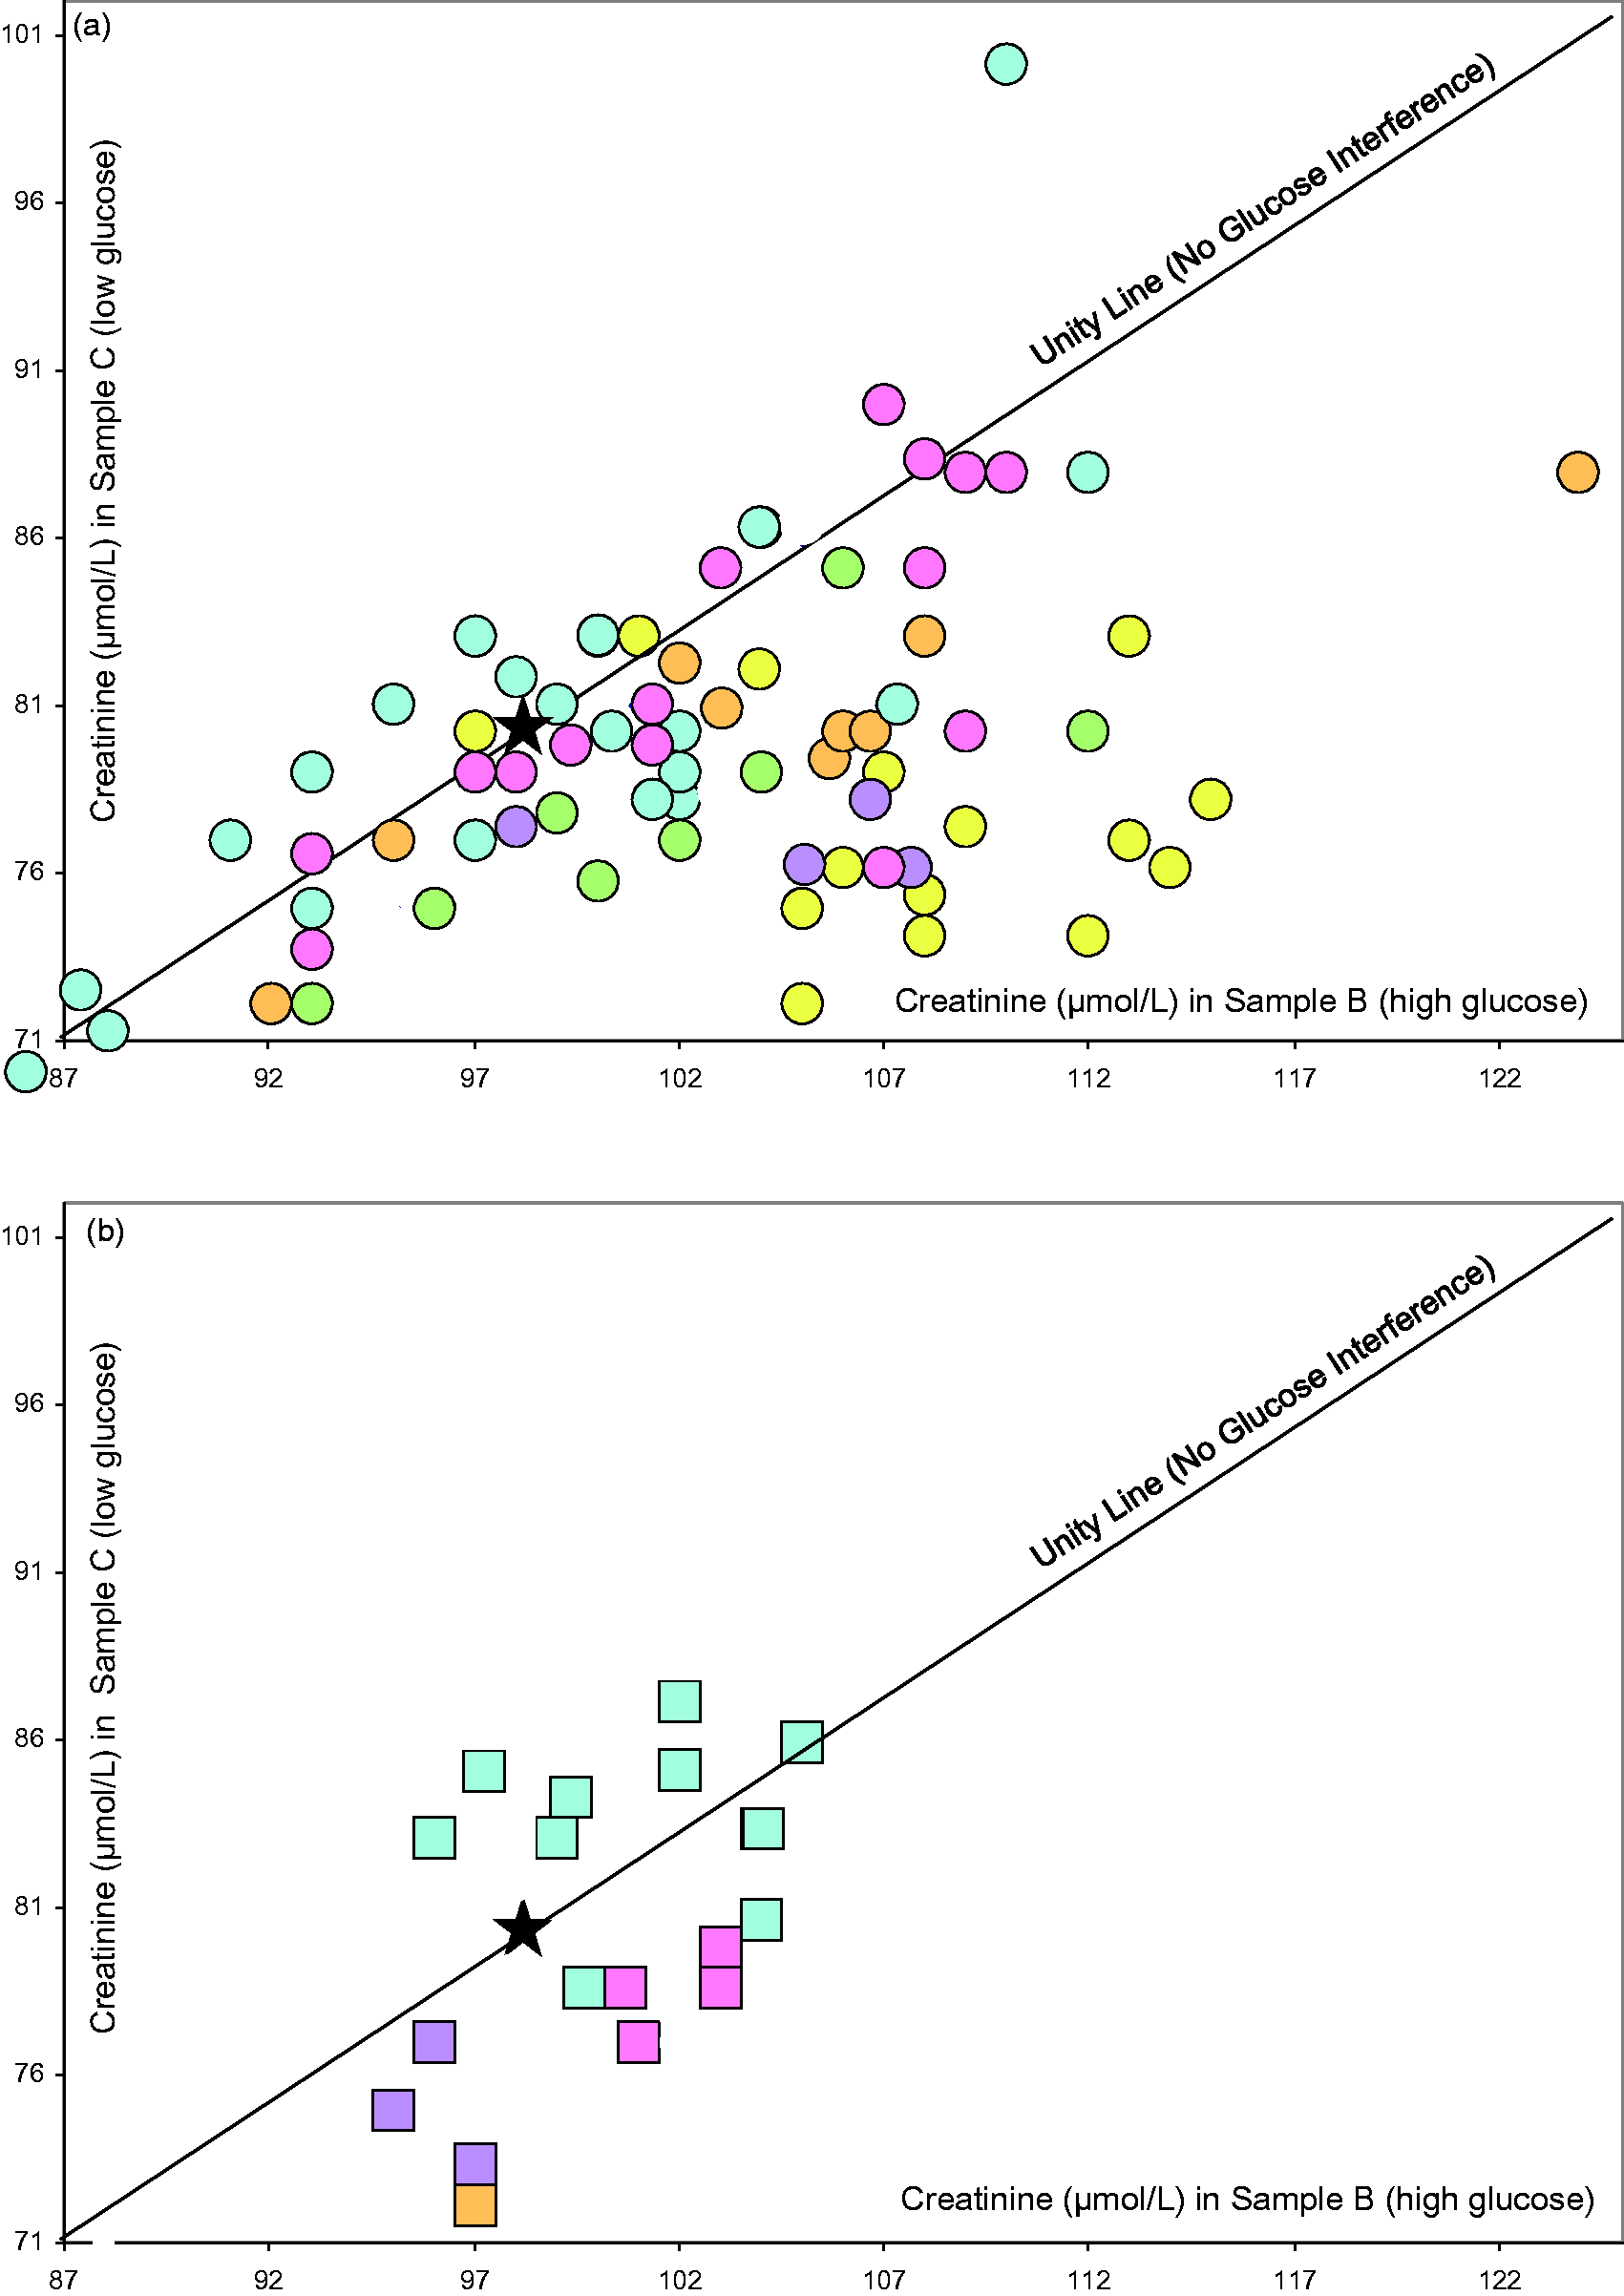
Discussion
Historically, the variability in creatinine methods has been attributed to (1) an inherent imprecision in the actual methods, (2) the lack of standardization and (3) the non- specificity due to reactivity with non-creatinine chromogens. All of these factors therefore combined to produce a substantial uncertainty in creatinine measurements that compromised their clinical utility. A global drive to standardize routine creatinine methods to a higher reference system was therefore established in an attempt to improve the reliability of eGFR measurement in clinical practice. As a result of this, most manufacturers state that calibrators are traceable to an IDMS method.
Our findings show that variability in creatinine measurements using different routine methods still exists despite the introduction of a system for standardization. As this study confirms, Jaffe-based creatinine methods are still widely used in practice. While the standardization of each creatinine method may reduce variation between methods from different manufacturers, it does not eliminate variations due in part to the non-specificity of the method. Our study adds to the growing body of evidence of the unsatisfactory analytical performance of creatinine since standardization.6,8,9
It is generally agreed that the best way to achieve harmonization of results is to ensure the traceability of biochemical results to the highest metrological order and by establishing a comprehensive reference measurement system. One of the critical points of the overall process is the quality of the material used as calibrator. Commutability of the calibrator material is critical for ensuring the trueness transfer in this process. When commutability of a reference material/calibrator is lacking, the results from routine methods cannot be legitimately compared with the assigned value. Additionally, the historical use of non-commutable EQA samples to assess and report on routine methods has been a confounding problem in identifying the lack of harmonization. 10 Non-commutability in EQA samples can be caused by matrix alteration during the sample preparation process or the use of non-native analyte. 11 In studies such as these, that use non-commutable material, the cause of bias cannot therefore be determined with certainty. In the present study, however, we used commutable EQA samples with IDMS target values in order to assess the performances of current creatinine methods and their suitability for their clinical applications. Furthermore, we have studied samples with concentrations of creatinine towards the low end of the analytical range where the analytical variability may have the most significant impact on the validity of clinical decision.
This study shows that the strategies implemented to reduce interference of non-creatinine chromogens have not eliminated all sources of non-specificity of Jaffe-based methods. Non-chromogen interference remains a major source of non-specificity of Jaffe-based creatinine methods. Two creatinine samples used in this study were spiked to glucose concentrations of 5.9 mmol/L and 23.4 mmol/L, concentrations of glucose, which had previously interfered with different methods and variably impacted on creatinine measurements. Our findings suggest that the Abbott compensated and kinetic Jaffe methods seem the most affected by glucose interference. This finding supports a pilot study exploring harmonization of creatinine measurements in ten laboratories in the UK 12 and which also used commutable EQA samples with IDMS target values. A substantial bias was observed by users of the Abbott compensated creatinine method. The finding from this pilot was confirmed by another study from the same working group. In it, Weykamp et al. 13 reported a difference in eGFR of 21 mL/min/1.73 m2 observed in two samples of the same creatinine concentration but one of which was spiked with glucose to a concentration within the reference interval, whereas the other was spiked with a glucose concentration of 25 mmol/L. This study concluded that the Abbott Jaffe-based method was most affected by high glucose concentration.
The assessment of kidney function in diabetic patients is an essential part of diabetes management. The presence of high glucose concentrations in plasma will result in either under or over estimation of GFR, according to the method used and may also lead to errors in classification of CKD. For example, in their study, Klee et al. 14 reported that a positive bias of 20 μmol/L in creatinine measurement, resulted in a three-fold increase the number of patients with GFR value of <60 mL/min/1.73 m2.
Although in our study none of the enzymatic methods showed glucose interference, enzymatic creatinine methods are not immune from the effect of interfering substances. Greenberg et al. 15 assessed the specificity of four enzymatic creatinine methods and three Jaffe-based methods for a wide range of interfering substances. These included endogenous substances (ketones, acetone, ascorbate, pyruvate, HbA1c, glucose) and exogenous, such as drugs (cephalosporins, dobutamine, dopamine, lidocaine) in different patient groups. Almost all Jaffe-based methods and enzymatic methods showed an element of interference to one or more interfering substances. However, the magnitude of interference in enzymatic methods was less than that observed in Jaffe-based methods. 15
Figure 1 shows the impact of variability in creatinine methods on the bias of the calculated eGFR. This graph also shows the difference in magnitude and direction of bias which reflects either a calibration issue or the existence of interfering substances. Many reports in the literature describe the presence of this problem despite the efforts of manufacturers to improve the specificity of alkaline picrate based methods.9,16 Panteghini 17 presented data showing a positive bias of 18 μmol/L obtained from the standardized Jaffe-based creatinine method on a Beckman AU 2700 platform. This bias may well be due to standardization error or non-specificity of the Jaffe-based creatinine method. This study agrees with the previous reports and shows that Jaffe-based methods still suffer from interference from non-creatinine chromogens to such an extent that it may compromise the clinical utility of these methods.
In the 2014 EFLM strategic consensus meeting on analytical performance specifications, 18 it was stated that specifications based on clinical outcome or clinical application should be used when data are available. Since the NKDEP-WG has clearly argued that there is a clinical need for using performance specifications, we have used the NKDEP-WG recommended analytical performance limits to assess the performance of creatinine methods. The NKDEP-WG defined this as a 10% error in eGFR calculation, including the between-methods variability, which corresponds to a creatinine method bias of 5% (compared with an IDMS reference procedure) and a CV% of <8%. Creatinine measurements are also used to detect AKI, for monitoring renal failure in adult and paediatric patients where a CV as high as 8% may compromise the diagnostic utility. Recently, Jassam et al. 5 established the need for a CV of ≤4% if a silent stage of AKI is to be detected with certainty within a clinical network that used various creatinine methods. Although this limit was defined clinically so as to ensure consistent detection of patients with AKI, within a network of laboratories in a region, it also happened to be the same value as the minimal limit that is defined by the biological variability model. 19 Therefore, we used a CV% of ≤4% to assess the clinical suitability of current creatinine methods. Our finding from this study supports those of Pantighini 17 in that the introduction of enzymatic creatinine methods has significantly enhanced the analytical performance of creatinine methods, in terms of both bias and precision.
Previous reports, some of which have been undertaken a decade ago, have raised concern over the lack of improvement in analytical performance of Jaffe-based creatinine methods. Our study agrees with previous reports in that Jaffe-based methods, despite all efforts to improve their specificity and even poststandardization, still display between-laboratories variably. We believe that this analytical variability renders Jaffe-based method unsuitable for clinical practice.
The replacement of Jaffe methods with enzymatic ones is proving to be a slow process, no doubt caused by the more expensive cost of the latter. A study that was conducted in 2005 and included 189 laboratories from 7 EU countries reported that only 17% of their study participants used an enzymatic method. In our cohort, which comprises samples from four EU countries, the majority of the laboratories are still using a Jaffe-based method with only 23% of the laboratories using an enzymatic one. Therefore, we support previous reports in a call for laboratories and manufacturers to work together to replace Jaffe-based methods with a method that is clinically fit for purpose, i.e. an enzymatic method. 13 However, although enzymatic methods reduce the variability in terms of bias and imprecision and also considerably enhance specificity, at low creatinine concentrations, enzymatic methods show a need for further improvement in particular within the clinically important creatinine concentration range.
One of the observations from this study is that the performance of creatinine methods is related to the analytical platform manufacturer, rather than only the actual method. This is in agreement with previous reports. 20 However, one of the limitations of this study was the small numbers in some of the method groups which meant breaking down the performance per analytical platform manufacturer was not possible. This observation needs to be confirmed by a larger study.
In conclusion, our data show that a significant number of routine creatinine methods are still not fit for purpose and that further efforts from both the profession and from manufacturers are required in order to encourage the replacement of current methods with one that delivers the clinical goals. Only through participation in a category-1 EQA scheme 21 using commutable samples with value assignment using reference methods can a laboratory determine whether desired analytical quality specifications are met.
Footnotes
Declaration of conflicting interests
The author(s) declared no potential conflicts of interest with respect to the research, authorship, and/or publication of this article.
Funding
A fund was received from Roche for the UK part of this study.
Ethical approval
Not applicable.
Guarantor
NJ.
Contributorship
CW provided the EQA material and performed data analysis. AT, SS, CP, LS circulated EQA material to participants. NJ and JHB drafted the paper. All authors contributed to the content and the final outcome. All authors reviewed and edited the manuscript.