
Abstract
Background
Subclinical cobalamin deficiency is common in the elderly, but the sensitivity and specificity of serum total cobalamin for this diagnosis is poor. Serum holotranscobalamin (holoTC), a measure of biologically available cobalamin, is considered a better marker for early cobalamin depletion than total cobalamin. However, in elderly populations, health-related reference intervals for holoTC and correlations to renal function are not entirely clear.
Methods
HoloTC was determined with an automated microparticle enzyme immunoassay (AxSYM®) in 790 elderly non-vitamin-supplemented Swedish men, median age 75.3 years. Renal function was assessed with creatinine, cystatin C and estimated glomerular filtration rate (eGFR calculated from creatinine).
Results
Median holoTC was 51.8 pmol/L, the health-related reference interval 19.6–132.3 pmol/L. There was no significant difference in mean holoTC in probands with normal compared to high creatinine (P = 0.80) and cystatin C (P = 0.82). No significant differences between the quartiles of creatinine or cystatin C in mean of log holoTC were seen. HoloTC correlated strongly with total cobalamin (r = 0.69, P < 0.001), weaker with eGFRcreatinine (r = −0.09, P < 0.05) and creatinine (r = 0.09, P < 0.05), the latter correlation was only seen in subjects with creatinine <100 µmol/L. HoloTC correlated negatively with plasma total homocysteine (r = −0.24, P < 0.001), but not with cystatin C and age.
Conclusions
Serum holoTC in healthy elderly men shows the same distribution as earlier described for a younger reference population. In this group of elderly subjects, holoTC did not correlate to reduced renal function. Thus, holoTC appears to be a promising tool for evaluating cobalamin status also in elderly populations.
Introduction
Subclinical deficiency of cobalamin (vitamin B12) is common in the elderly, 1 mainly due to malabsorption caused by atrophic gastritis, an age-related, irreversible and slowly progressing disorder of both hereditary and acquired aetiology.2,3 Early and reliable diagnosis of cobalamin deficiency is important, since potentially irreversible neurological damage may be the first clinical sign. In non-vitamin-supplemented populations, the prevalence of atrophic body gastritis exceeds that of macrocytic anaemia caused by cobalamin deficiency,2,4 illustrating the slow progress of the atrophy and the long time needed to deplete cobalamin stores. Serum concentrations of total cobalamin have low sensitivity and specificity for diagnosing deficiency, particularly in the large grey zone of values surrounding calculated lower reference limits.4,5 The reason for these shortcomings of serum total cobalamin lies in the nature of what is measured; total cobalamin measure the sum of both biologically active cobalamins (those bound both to transcobalamin, TC) and the unavailable fraction bound to haptocorrin (HC). Very low total cobalamin (<100 pmol/L) have a rather high specificity for diagnosing deficiency, 5 and concentrations >250 pmol/L are rarely seen in deficient subjects. On average, only 30% of serum total cobalamin consists of holotranscobalamin (holoTC).6,7 HoloTC reflects the fraction of total cobalamin available for cellular uptake and is suggested a better8,9 and the most sensitive marker for early cobalamin deficiency.10,11
The commercially available radioimmunoassay (RIA) for holoTC is labour intense 6 and therefore unsuitable in clinical routine. In the last years, a new method, AxSYM® HoloTC Axis-Shield Diagnostics, a microparticle enzyme immunoassay (MEIA)12,13 has been developed. HoloTC is a stable analyte and stable in storage at −20℃ to −70℃ at least for 16 months.8,14 Published decision limits for cobalamin deficiency as defined by serum holoTC vary from 11 to 45 pmol/L, 15 depending on method and study population used. The reference intervals appear to be related to age and sex in some,16,17 but not other13,18 studies. Likewise, holoTC has been reported to correlate positively with creatinine in some19–21 but not other16,18,22 studies. Plasma total homocysteine (tHcy) and serum methylmalonic acid (MMA) are, as markers of intracellular vitamin metabolism, of potential benefit for diagnosing vitamin deficiency in subjects with serum cobalamin within the large grey zone. tHcy accumulates in deficiency of cobalamin and folate, whereas MMA increases in cobalamin deficiency. However, both metabolites correlate with glomerular filtration rate (GFR) also in subjects with normal renal function as determined by creatinine or cystatin C 23 and are markedly elevated by renal insufficiency. Furthermore, the decision limits for deficiency, also in subjects with normal renal function, need to be higher than the upper health-related reference limits. 24 In practice, this limits the usefulness of tHcy and MMA 25 as single gold standards for cobalamin deficiency in elderly populations, for whom varying degrees of reduced glomerular filtration is a rule. It seems clear, that both tHcy and MMA must be combined with a reliable marker of cobalamin stores, ideally independent of renal function.
Within a large population-based study of elderly, free-living Swedish men, we investigated possible determinants and health-related reference intervals of holoTC in relation to total cobalamin, tHcy and markers of GFR.
Material and methods
Study subjects – MrOS
Exclusion criteria for the calculation of reference intervals for the healthy subgroup for holoTC, total cobalamin and tHcy in the total study group (n = 790).
After exclusions according to all criteria, 261 subjects remained.
Clinical examination
Body height and weight were measured using standard equipment and all measurements were carried out by the same staff. Body mass index (BMI) was calculated as weight in kilograms divided by height in meters squared (kg/m2).
Blood sampling and analytical methods
Venous blood samples were collected at 8:00 a.m. after at least 10 h of fasting and non-smoking. Haemoglobin (Hb), erythrocyte indices and blood cells were analysed immediately on an automated cell counter (CellDyn 4000, Abbott) at Sahlgrenska University Hospital, Göteborg, Sweden. Samples of serum and plasma were drawn from April 2002 until December 2004, frozen within an hour and stored at −80℃ until analysed. HoloTC was analysed in November 2007 at Sahlgrenska University Hospital and was determined by an automatic method, AxSYM® HoloTC (Abbott), a MEIA. 12 A specific monoclonal antibody against holoTC was fixed to latex microparticles and was used to capture holoTC in the serum. Hereafter, a detection antibody labelled with alkaline phosphatase was used. A substrate system was utilized in the last step and the fluorescence signal was proportional to holoTC in the sample. Suggested cut-off limit for low values, as suggested by the manufacturer, is 19 pmol/L. 13 Total cobalamin (pmol/L) was analysed using ECLIA (Electrochemiluminescence Immunoassay) on the Cobas Modular (Roche Diagnostics). Serum folate was determined by radioassay (Solid Phase No Boil Dualcount, Diagnostic Products Corp., Los Angeles, CA, USA). Serum creatinine was analysed by an enzymatic method, Roche/Modular (Roche Diagnostics Scandinavia AB, Stockholm, Sweden). Plasma tHcy and serum cystatin C were analysed at the Department of Clinical Chemistry, Lund University Hospital, in 2006. Total Hcy (tHcy) was measured on a Hitachi Modular-P (Roche), upper reference limit according to laboratory standard is 20 µmol/L in subjects >65 years. Cystatin C concentrations in serum were measured by immunoturbidimetry, 27 using the Hitachi Modular-P analyzer with reagents and calibrators from Daco A/S, Copenhagen. The total imprecision was 2.1%. The standard upper reference limit was 1.44 mg/L in 2006. GFRcreatinine was indirectly calculated from the Lund-Malmö equation 28 : e x −0.00587×age+0.00977×LBM(lean body mass), where x = 4.95−0.0110×creatinine (if creatinine <150 µmol/L) and x = 8.58+0.0005×creatinine–1.08× ln(creatinine) (if creatinine ≥150 µmol/L).
Lean body mass (LBM) was calculated according to the formula:
LBM = 1.10 × weight – 120 × (weight/height) 2 .
The estimated glomerular filtration rate eGFRcystatinC was calculated using the following formula: eGFRcystatin C = 79.901 × (cystatin C)−1.4389. This proxy for eGFR has a strong correlation with iohexol clearance (R2 = 0.956). 29
Reference intervals according to laboratory standards were for serum total cobalamin 140–500 pmol/L, serum folate 7.0–40 nmol/L and serum creatinine 60–105 µmol/L.
Statistical analyses
Standard methods were used for tests of correlations between variables. The Pearson correlation test was used for determination of univariate correlations and linear regression models were used for test of correlations adjusted for confounding factors, giving standardized β-values. Differences in means between two groups were tested with the Welch–Satterthwaite t-test. Calculations of central 0.95 interfractile intervals were done using the REFVAL program. 30 Parametric determinations of reference limits were used. Since many of the variables showed skewed distributions, all continuous variables were analysed in the log scale, except in the REFVAL program. Outliers were treated according to the Dixon range statistic. 30
One outlier value of holoTC, 1783, was assigned to 950 before taking the log. Double-sided tests were used throughout and a significance level of P < 0.05 was regarded as statistically significant. To examine the assumption of a homogeneous linear association between holoTC and creatinine, a scatterplot with a lowess regression curve was calculated. The lowess method (locally weighted scatterplot smoothing) gives a smooth curve of the moving trend in the data.
The software used was SAS for Windows, version 9.1 and a database and statistics program package developed at the Department of Community Medicine and Public Health, Gothenburg University.
Results
Characteristics of the MrOS study cohort, n = 790, the healthy subgroup, n = 261 and the non-healthy subgroup, n = 529.
% abnormal indicates the percentage outside reference values according to the laboratory (Hb, MCV, creatinine, cystatin C), the literature (S-folate) or our own calculated reference intervals (cobalamin, holoTC, tHcy).
HoloTC
Means, medians and central 0.95 fractile intervals for the TSG (n = 790), and for apparently healthy subjects (n = 261) are shown in Figure 1. The central 0.95 fractile interval was 18.3–140.1 pmol/L in the TSG (n = 781) and the reference interval in the healthy subgroup 19.6–132.3 pmol/L (n = 263). In the non-healthy subgroup, low holoTC, <19.6 pmol/L, was seen 16/524 (3.1%; Table 2).
Central 0.95 fractile intervals for holoTC, total cobalamin and tHcy in the total study group (TSG) and in the healthy subgroup, the figures are log transformed.
Total cobalamin
The median value in the TSG was 310 pmol/L. The central 0.95 fractile interval was 150.0–697.0 pmol/L in the TSG (n = 745) and 152.6–680.8 pmol/L in the healthy subgroup (n = 254; Figure 1). The proportion of non-healthy subjects with ‘low’ serum concentrations when defined as <152.6 pmol/L were 16/491 (3.3%; Table 2).
Homocysteine
Median tHcy in the TSG was 14.2 µmol/L. The central 0.95 fractile interval in the TSG (n = 780) was 8.7–27.8 µmol/L and the reference interval in the healthy subgroup was (n = 260) 8.1–19.7 µmol/L (Figure 1). In the non-healthy subjects, high tHcy defined as tHcy >19.7 µmol//L was found in 81/520 (15.6%; Table 2).
Renal function
Median values and range for creatinine, cystatin C, eGFR cystatin C and eGFR creatinine are shown in Table 2. In the non-healthy subjects, according to the laboratory, high creatinine (>105 µmol/L) was found in 150/525 (28.6%) and high cystatin C (>1.44 mg/L) was found in 9.0% (47/524).
Correlations between holoTC, laboratory and clinical variables
Simple correlations, (Pearson correlation coefficient) n = 790, all serum/plasma concentrations are log transformed.
P<0.001.
P<0.05.
P<0.01.
HoloTC/total cobalamin and renal function
In the TSG, there were no significant differences in mean values of holoTC and total cobalamin in probands with normal as compared to high creatinine (<105 µmol/L vs. ≥105 µmol/L) (holoTC 62.5 vs. 61.4 pmol/L, P = 0.80 and total cobalamin 342.3 vs. 340.0 pmol/L, P = 0.84) and cystatin C (<1.44 mg/L vs. ≥1.44 mg/L) (holoTC 62.2 vs. 64.8 pmol/L, P = 0.82 and total cobalamin 339.9 vs. 383.4 pmol/L, P = 0.06). There were no significant differences between the quartiles of creatinine or cystatin C in mean of cobalamin and holoTC, but a significant trend (P < 0.05) of higher mean holoTC in lower quartiles of eGFRcreatinine, which was not seen for cobalamin, data not shown. No correlations between total cobalamin and creatinine, cystatin C or eGFRcreatinine were seen in the TSG, the healthy subgroup or non-healthy subgroup (Table 3).
However, in the TSG (n = 790), holoTC correlated weakly with creatinine (r = 0.09, P < 0.05) and eGFRcreatinine (r = −0.09, P < 0.05; Table 3), but not significantly with cystatin C (r = 0.07, P = 0.059). A plot showing simple correlations in TSG between holoTC and creatinine is shown in Figure 2.
Simple correlation between holoTC and creatinine n = 765. Values of holoTC ≥160 pmol/L are excluded, n = 16. The regression curve is calculated according with the lowess method.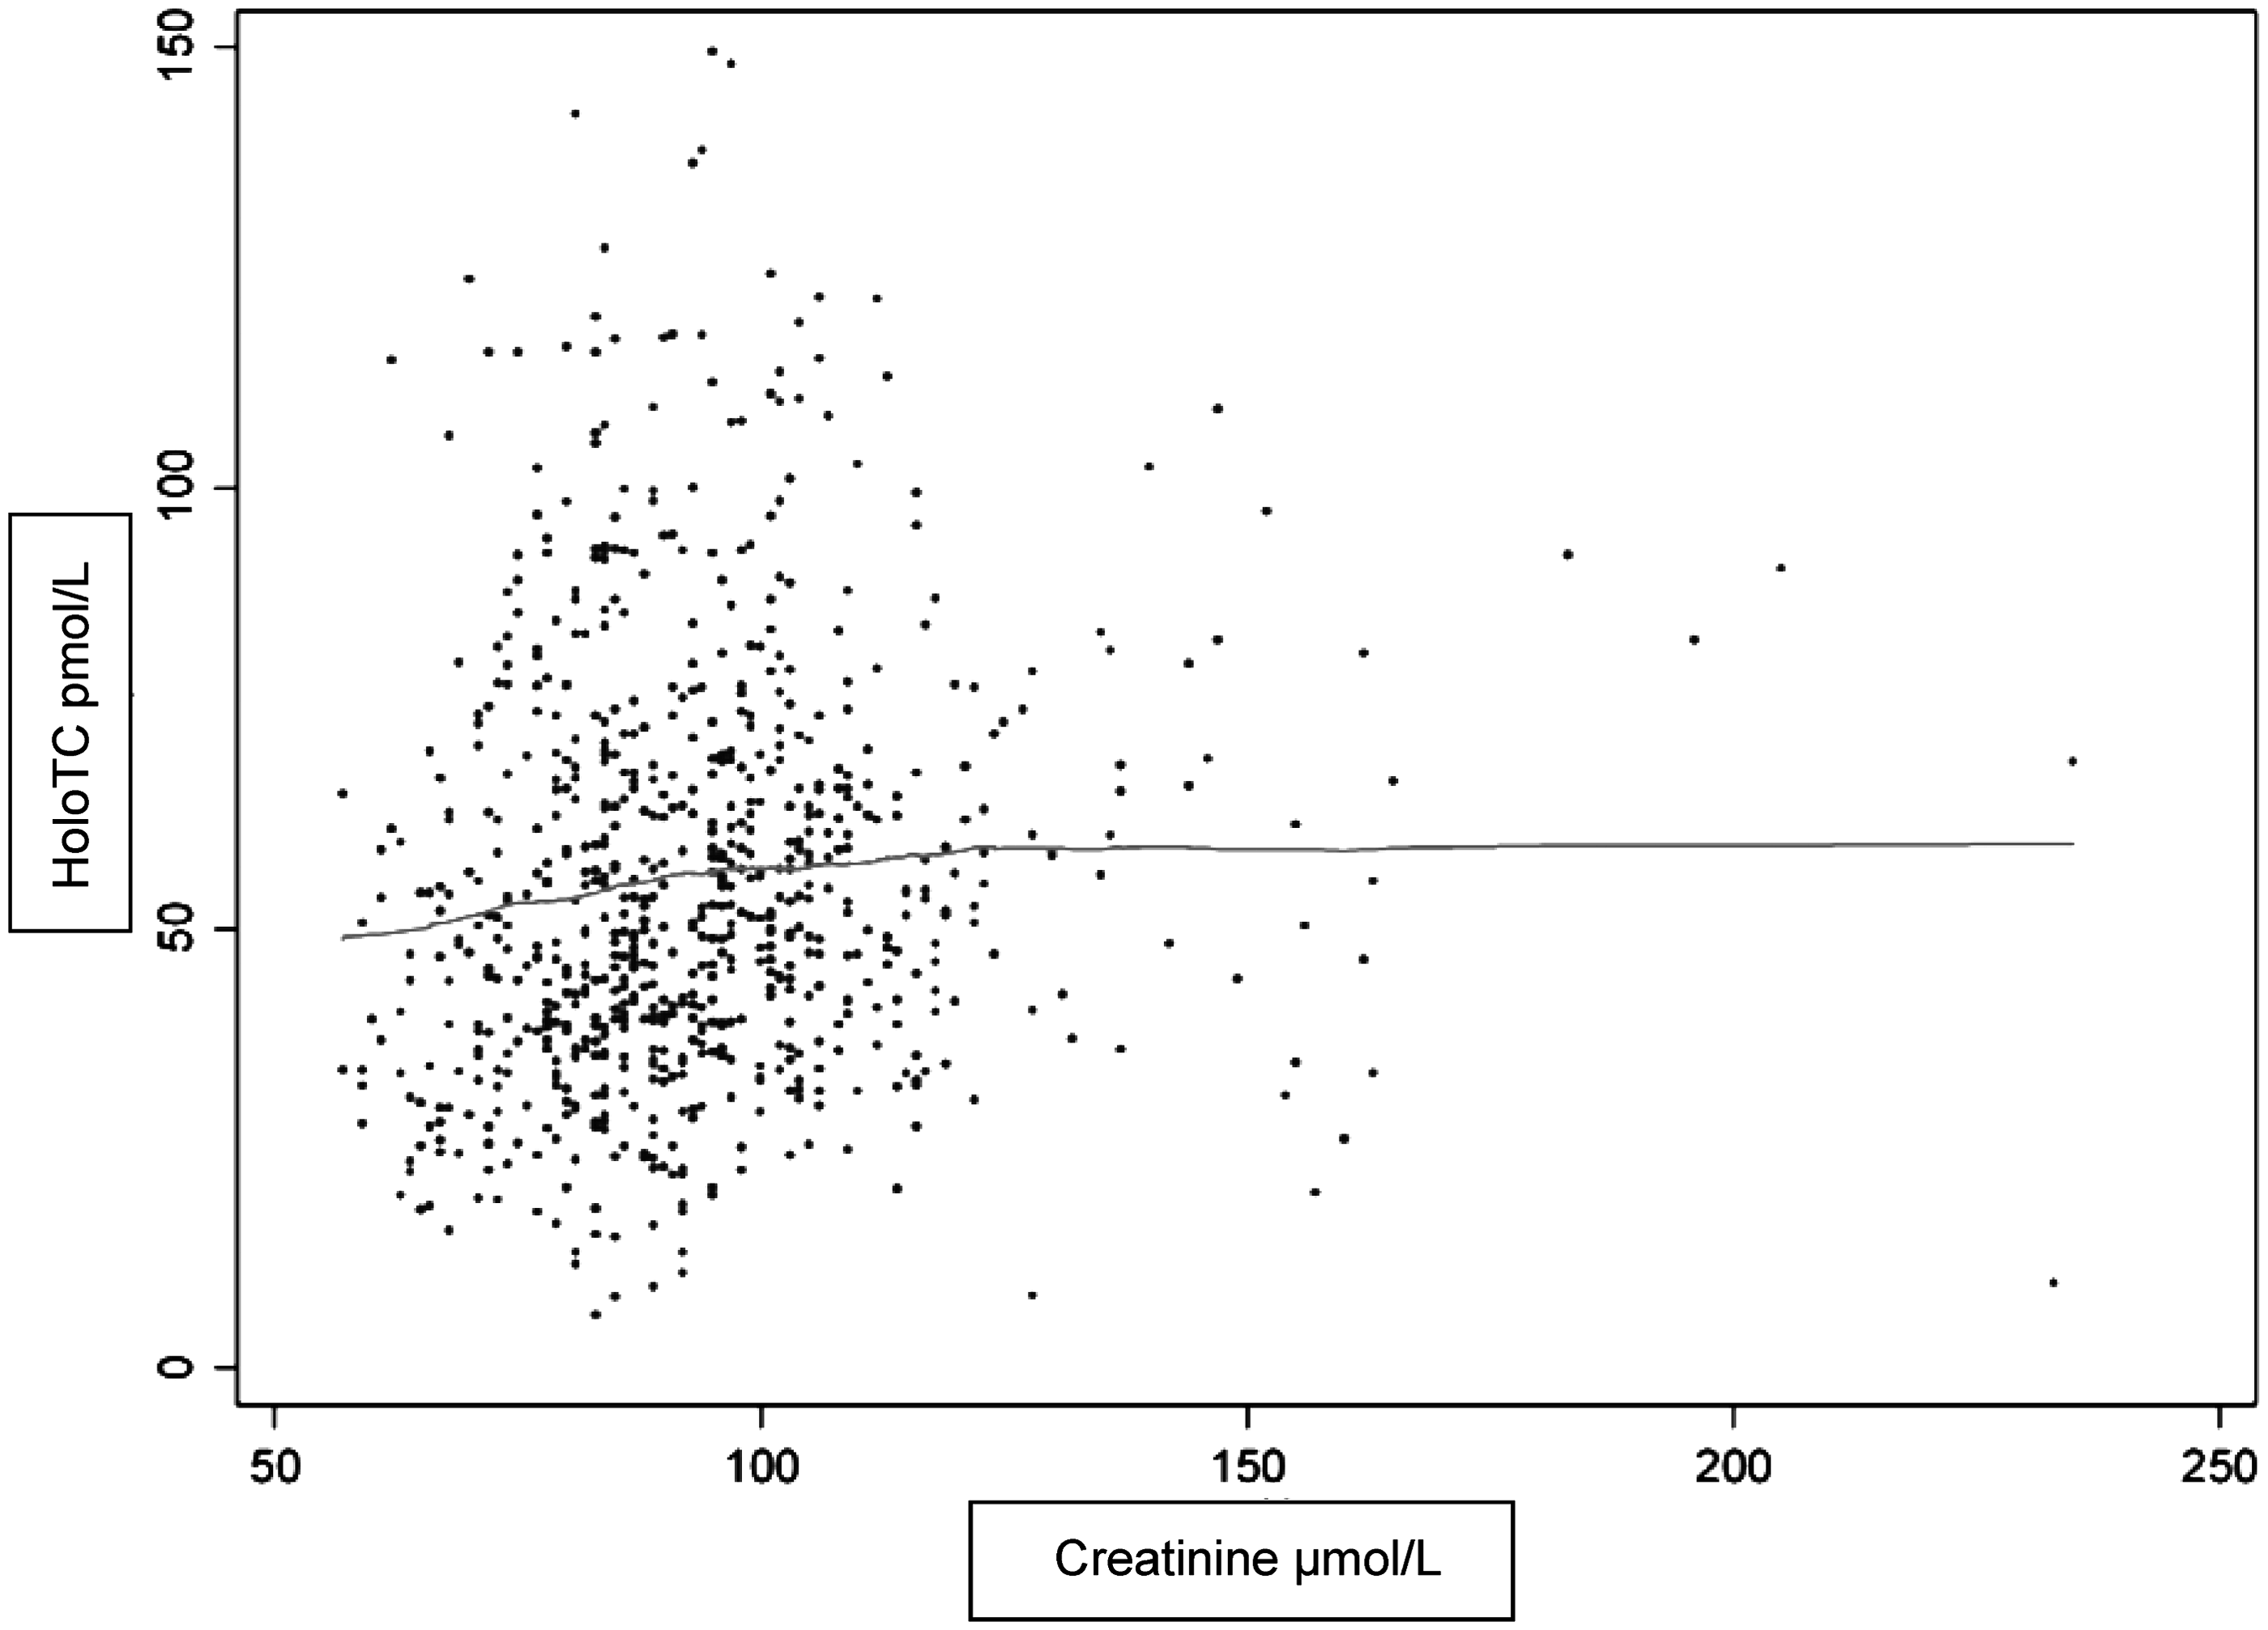
Further analyses showed that there was a significant correlation between holoTC and creatinine which was only seen in subjects with creatinine <100 µmol/L (n = 506, r = 0.10, P < 0.02). HoloTC did not correlate to eGFRcreatinine in none of the following subgroups according to creatinine (<100 µmol/L, r = −0.06, P = 0.16, >100 µmol/L, r = −0.05, P = 0.94).
Relationships between low total cobalamin, holoTC and high tHcy
We used the calculated health-related reference limits to calculate, in the non-healthy subgroup (n = 491 with complete data available), the numbers of subjects with low holoTC, low total cobalamin and high tHcy and combinations thereof. Seventy-six (15.5%) had high tHcy, of whom seven had low holoTC, nine low total cobalamin and five both. Of these 76 subjects, 41 (54.0%) had creatinine >105 µmol/L, 22 (28.9%) had cystatin C >1.44 mg/L, 26 (34.2%) had folate <10 nmol/L and 11 (14.5%) had both creatinine >105 µmol/L and folate <10 nmol/L.
Among the 65 subjects with high tHcy but ‘normal’ total cobalamin and/or holoTC, 38 (58.5%) had elevated creatinine (>105 µmol/L), 22 (33.8%) had folate <10 nmol/L and 11 (16.9%) had both.
Discussion
Within the framework of a large prospective study of elderly men, we studied 1010 elderly, free-living men with a median age of 75.3 years. We selected 790 probands without ongoing B vitamin medication or supplementation for this study. In order to calculate health-related reference intervals, further exclusions were undertaken. We used a fully automated MEIA method for holoTC, and standard methods for the other analyses. HoloTC was strongly and positively correlated with total cobalamin (r = 0.69), as reported by others. 17
For holoTC, we found a lower reference limit of 19.6 pmol/L, which is in accordance with the manufacturer’s recommendations and some 13,25 but not other 32 studies, probably due to different populations studied. When calculating reference intervals we used exclusion criteria for the healthy subgroup partly based on our previous data, 33 and we used very strict criteria when excluding unhealthy individuals. For holoTC and total cobalamin, the lower reference limits did not markedly change after exclusion of ‘non-healthy’ subjects and they were in the same range as laboratory standards. Therefore, the reference limits for vitamin concentrations for younger populations may be applied also in an elderly population.
In the light of the low prevalence of vitamin deficiency in the present population, we had an opportunity to study the effect of renal function, measured with creatinine, cystatin C and eGFRcreatinine, on the vitamin markers.
As expected, reduced renal function was very common in this group of elderly community dwelling men without a diagnosis of renal insufficiency. When using the reference values according to the laboratory, the upper reference limits according to laboratory standards were, for creatinine 105 µmol/L and for cystatin C 1.44 mg/L. Approximately 20% had high creatinine and 7% had high cystatin C levels using these cut off levels. This discrepancy might be caused by known confounders for creatinine, e.g. muscle mass. After exclusion of subjects with high creatinine (in addition to other criteria), the upper reference limit for tHcy decreased from 27.8 until 19.7 µmol/L, in accordance with laboratory standards. HoloTC showed a partial correlation to low/normal range creatinine values only. Thus, the reduced renal function found in one-fifth of the TSG caused higher tHcy values, whereas holoTC was unaffected. In fact, creatinine in itself is related to tHcy. The concentration of tHcy is not only related to GFR, but also to the production of creatinine. 34 HoloTC is subject to glomerular filtration and is quantatively reabsorbed in the proximal tubulus; 35 however, most of studies regarding renal tubular uptake of cobalamin are based on experiments in animal models. HoloTC in relation to renal function has previously been studied in some settings, and some have, using creatinine16,19,20 or eGFR, 36 found correlations between renal function and holoTC, whereas others 37 have not. These discrepancies may be due to differences in methods used, in populations studied with respect to number of participants, age range, sex, ethnic origins, cobalamin status and degree of renal impairment. In this large cohort of elderly men, we failed to find significant correlations of holo-TC and renal function along the spectrum of values for GFR markers. Creatinine is related to age, sex and muscle mass 38 and correlates significantly to both tHcy and MMA, 23 making elevations of these two metabolites less specific for the diagnosis of early cobalamin deficiency in the elderly. We also evaluated a potentially better marker for renal function, cystatin C, in addition to creatinine, with in principle the same outcome. There was no correlation between holoTC and reduced renal function as determined with cystatin C in the TSG or non-healthy subgroup. There are very few studies addressing the association between holoTC and cystatin C. In a population based study of elderly (>65 years) men and women, no correlations between holoTC and either cystatin C or creatinine were seen. 37
We did not analyse MMA, the other marker of intracellular cobalamin metabolism. This would hardly have affected the results, since MMA also to a large extent is dependent on glomerular filtration. In a study of 700 elderly subjects, holoTC was judged as the best performing marker to detect true cobalamin deficiency even among those with the most impaired renal function (eGFR 15–29 mL/min) compared with MMA, tHcy and total cobalamin. 25 We did not further investigate the cause(s) of the prevalent reduced renal function in this aged population, but there is no reason to believe that the selection of probands might result in an accumulation of subjects with renal disorders.
However, our data point to the necessity of taking renal function into account when judging many laboratory data in the aged, not least serum/plasma levels of intracellular B-vitamin dependent metabolites. We did not find any correlations between holoTC and age; however, the age-interval was relatively narrow in this population making it difficult to draw any conclusions about the relation between holoTC and age in this study.
We did not see any correlations between folate and on the other hand creatinine, cystatin C or eGFRcreatinine. In the unhealthy subgroup, elevated tHcy was caused by cobalamin deficiency in about 10%, in a significantly higher percentage the reason was impaired renal function (up to 50%), folate deficiency or the combination of both. This indicates further the limitations using tHcy as the only marker for cobalamin deficiency.
A possible limitation of this study would be that it was restricted to men. However, in the elderly, vitamin replete men have higher tHcy values than women, 33 pointing to the necessity of adequate vitamin measurements for the diagnosis of deficiency in the old age groups. Although our study, from a strict epidemiologic perspective might have some selection bias, we believe that the results are applicable to the elderly population.
In conclusion, holoTC is strongly correlated to total cobalamin also in an elderly population. The health-related reference interval of holoTC is not, in contrast to tHcy, influenced by decreased renal function. Thus, holoTC is a promising tool assessing cobalamin status also in elderly.
Footnotes
Acknowledgements
None.
Declaration of conflicting interests
None declared.
Funding
This research was supported by the Swedish Research Council and the ALF/LUA research grant in Gothenburg.
Ethical approval
The study was approved by the local ethics committee at Gothenburg University (M 014-01).
Guarantor
CL.
Contributorship
DM, CO, and MK supervised the study. DM and CO were involved in patient recruitment. SJ was involved in laboratory measurement; CL performed data analysis; and CL and HNE wrote the manuscript. All authors reviewed the manuscript and approved the final version of the manuscript.