
Abstract
Background
The results of free light chains quantitation in the cerebrospinal fluid were recently compared with the presence of cerebrospinal fluid-restricted oligoclonal IgG, but not oligoclonal free kappa light chains and oligoclonal free lambda light chains. We therefore aimed to compare the performance of the quantitative tests with the qualitative one for the same molecule.
Methods
Seventy-five paired cerebrospinal fluid and serum samples were analysed for oligoclonal IgG, oligoclonal free kappa light chains and oligoclonal free lambda light chains. Cerebrospinal fluid and serum free kappa and lambda light chains were quantified using Freelite™ kits on SPA Plus analyzer. ROC curves were analysed for the prediction of intrathecal synthesis and compared for cerebrospinal fluid concentration, cerebrospinal fluid/serum quotient (QfLC) and index (QfLC/QAlbumin). The presence of cerebrospinal fluid-restricted oligoclonal free kappa light chains and oligoclonal free lambda light chains bands was used as reference.
Results
No statistically significant differences were observed among cerebrospinal fluid concentration, QfLC and index for the prediction of free light chain intrathecal synthesis. Each parameter was able to predict the occurrence of cerebrospinal fluid-restricted oligoclonal free light chain bands (AUCs 0.932–0.999). However, we noted elevated cerebrospinal fluid free light chain concentrations in the absence of cerebrospinal fluid-restricted oligoclonal free light chain bands in two patients with very high serum free light chain values.
Conclusions
Quantitation of cerebrospinal fluid free light chains reliably predicts their intrathecal synthesis. Yet, cerebrospinal fluid/serum quotient may still be preferred to correct for high serum free light chain concentrations. An appropriate formula should be sought to correct for blood–cerebrospinal fluid barrier status.
Introduction
Several recent reports propose cerebrospinal fluid (CSF) free light chain (fLC) measurement as a valuable marker of intrathecal immunoglobulin synthesis that has predictive value similar to oligoclonal IgG (o-IgG).1–4 Up to now, CSF fLC measurements have only been compared to o-IgG as a gold standard. This approach, however, does not compare exactly like with like. We therefore aimed to compare the performance of the quantitative tests with the qualitative one for the same molecule, i.e. oligoclonal free kappa light chains (fKLC) and oligoclonal free lambda light chains (fLLC).
Methods
Seventy-five paired CSF and serum samples under o-IgG analysis were also analysed for o-fKLC and o-fLLC, as described elsewhere. 5 Samples were then kept frozen at −30℃ until quantitative fLC measurements. CSF and serum fKLC and fLLC concentrations were determined on the SPA Plus turbidimetric analyser using dedicated Freelite™ kits (The Binding Site Ltd.) CE marked for CSF analysis (Ref. No. LK016.L.S and LK018.L.S.). Statistical analysis was performed using MedCalc Software. Presence of CSF-restricted o-fLC and o-IgG bands was used as a reference. CSF samples measured as <0.1 mg/L were analysed as 0.09 mg/L. P values < 0.05 were considered significant.
Results
Using cut-offs for CSF-restricted bands (≥4 for IgG, ≥6 for fKLC and ≥2 for fLCC) determined in our laboratory, 5 26 samples were positive for o-IgG, 30 for o-fKLC and 28 for o-fLLC. All samples positive for o-IgG were positive for o-fKLC; three samples positive for o-IgG were negative for o-fLLC and five samples negative for o-IgG were positive for o-fLLC.
CSF fKLC concentrations varied between <0.1 and 1.33 mg/L (median: 0.20; interquartile range: 0.11–0.27) in the o-fKLC negative group and between 0.80 and 16.90 mg/L (6.62; 2.71–11.61) in the o-fKLC positive group. CSF fLLC concentrations varied between <0.1 and 1.44 mg/L (0.22; 0.17–0.29) in the o-fLLC negative group and 0.24 and 12.03 mg/L (1.55; 0.56–3.08) in the o-fLLC positive group. Among patients without CSF-restricted o-fLC bands, one patient had high CSF (1.33 and 1.06 mg/L) as well as serum (97.63 and 84.48 mg/L) fKLC and fLLC concentrations and one patient with detectable fLLC paraproteinaemia had high CSF (1.44 mg/L) and serum (223.05 mg/L) fLLC values (see Supplementary File 1).
Analysis of ROC curves for the prediction of appropriate o-fLC positivity showed no significant differences between CSF fLC concentration only or CSF/Serum Quotient (QfLC) or index (QfLC/QAlbumin). AUCs for fKLC and fLLC were 0.998 (95% confidence interval: 0.948–1.000) and 0.954 (0.879–0.989), respectively, for CSF concentrations; 0.999 (0.949–1.000) and 0.977 (0.913–0.998) for QfLC; 0.991 (0.935–1.000) and 0.932 (0.848–0.997) for fLC index. Associated criteria were as follows: CSF fKLC > 0.56 mg/L; CSF fLLC > 0.43 mg/L;QfKLC > 39.2 10−3; QfLLC > 36.3 10−3; fKLC index >6.07; fLLC index >6.68.
When ROC curves for CSF fLC quantitative data as predictors of intrathecal IgG synthesis were compared, CSF fKLC performed best: AUC = 0.997 (95% confidence interval: 0.946–1.000; criterion: >1.38 mg/L), followed by QfKLC: AUC = 0.994 (0.940–1.000; >70.7·10−3), fKLC index: AUC = 0.989 (0.931–1.000; >7.67) and fLLC index: AUC = 0.978 (0.914–0.998; >5.58). AUCs for CSF fKLC, QfKLC, fKLC index and fLLC index proved significantly larger than those for CSF fLLC and QfLLC; other differences were not significant (see Supplementary File 2).
CSF but not serum fKLC/fLLC ratio was significantly higher in samples positive for o-IgG (median, 3.137; interquartile range, 1.929–16.482) as compared to negative ones (0.938; 0.679–1.157) (Mann-Whitney test, P < 0.0001).
Although fKLC measurements were able to predict intrathecal IgG synthesis, such a prediction is not perfectly appropriate since o-fLC are sometimes detected in the absence of o-IgG and o-fKLC are more frequently observed in inflammatory CNS diseases than o-fLLC. 5 Nevertheless, we proved that CSF fLC quantitation can predict intrathecal fLC synthesis. Although we did not aim at diagnosis-related analysis, it is of note that two patients with CNS inflammation proved positive for both o-fLC, while negative for o-IgG; 19/20 patients with MS or CIS (95%) were both o-IgG and o-fKLC positive and 17 (85%) were also o-fLLC positive. There was almost perfect agreement between qualitative and quantitative fLC data in this subgroup (see Supplementary File 1).
fLC index did not perform better than QfLC or CSF fLC only. This led us to investigate the relation of QfLC to QAlbumin in more detail (Figure 1).
Quotient diagrams for fKLC (A) and fLLC (B) with local regression smoothing trend lines.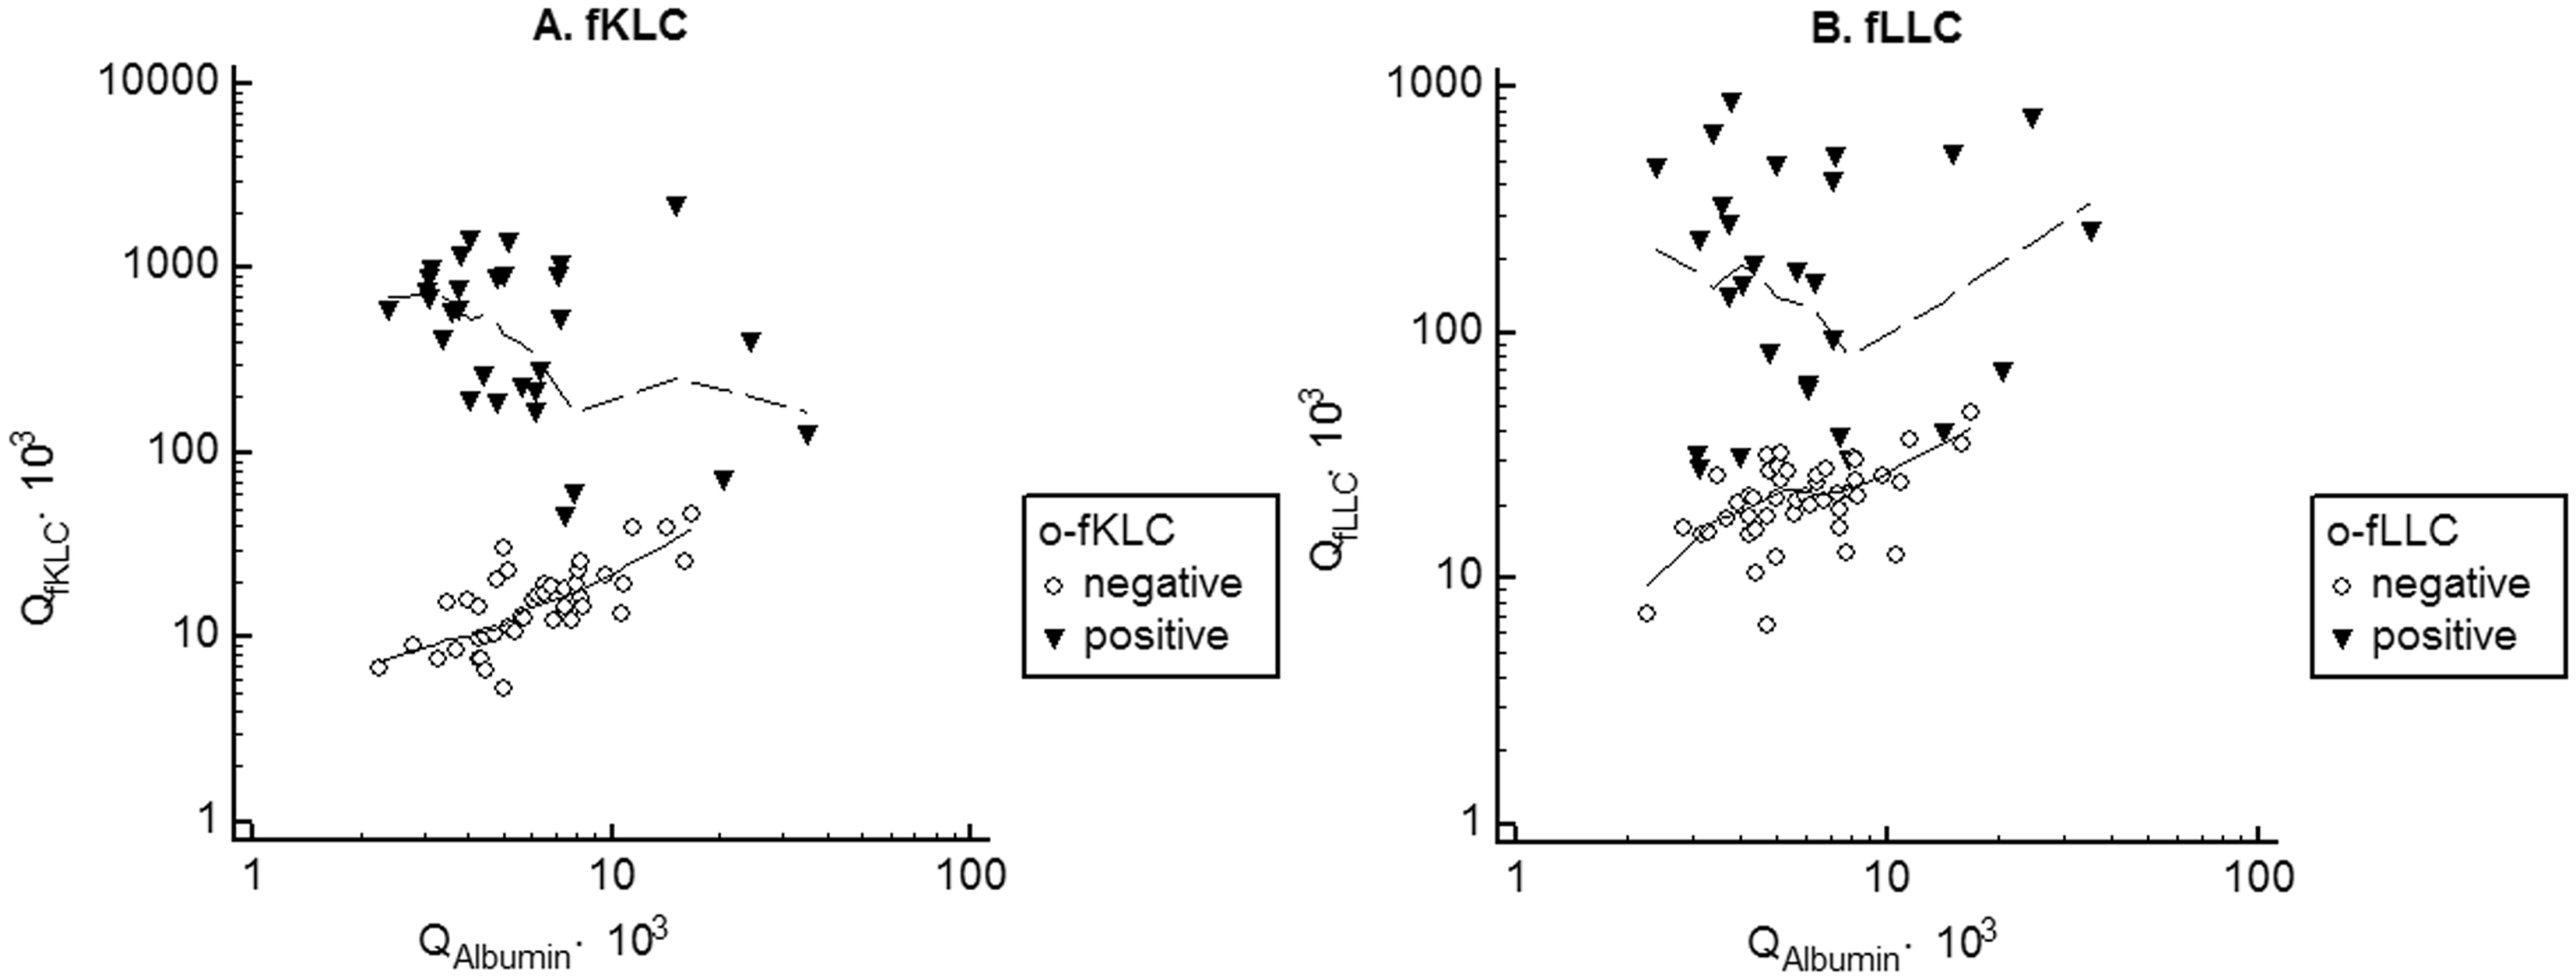
Proposing Reiber’s hyperbolic function for the estimation of intrathecal fLC synthesis1,2 is a misconception.
6
Since fLCs have a smaller molecule than albumin, theoretically an inverse function should be used i.e.
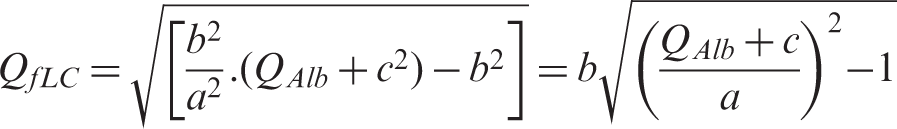
Larger data set, however, is needed to verify our hypothesis (see Supplementary File 3).
Conclusions
Quantitation of fLCs in CSF enables reliable prediction of intrathecal fLC synthesis. QfLC may be preferred to correct for elevated serum fLC concentrations. Correction for blood–CSF barrier status seems reasonable, but the most suitable formula remains to be determined. We further suggest that both fLC be analysed together because of substantial differences in the CSF fKLC/fLLC ratios among o-fLC positive patients that might be of some (although yet unknown) significance.
Footnotes
Acknowledgements
We are greatly indebted to Dr. Ulrich Wurster (CSF Laboratory, Medizinische Hochschule Hannover) for fruitful discussions and suggestions; to Ilona Faruzelová, Lenka Fürstová, Renata Malečková and Olga Michnová for their skillful technical assistance; and to Monika Hradecká for language corrections.
Declaration of conflicting interests
The authors declared no potential conflicts of interest with respect to the research, authorship and/or publication of this article.
Funding
This study was supported by MH CZ – DRO-FNOs/2014.
Ethical approval
The study was approved by University Hospital Ostrava Ethics Committee (Ref. No. 319/2014).
Guarantor
DZ.
Contributorship
DZ and PK conceived the study. DZ and VB performed the experiments. DZ, PK and VB analysed the data. VB checked statistical calculations. PH, BK and OZ provided clinical diagnoses and were involved in gaining ethical approval and sample collection. DZ wrote the first draft of the manuscript. All authors contributed substantially to the interpretation of data, edited the manuscript and approved the final version of the manuscript.
References
Supplementary Material
Please find the following supplemental material available below.
For Open Access articles published under a Creative Commons License, all supplemental material carries the same license as the article it is associated with.
For non-Open Access articles published, all supplemental material carries a non-exclusive license, and permission requests for re-use of supplemental material or any part of supplemental material shall be sent directly to the copyright owner as specified in the copyright notice associated with the article.