
Abstract
Background
In the UK, a common reference interval for serum albumin is widely used irrespective of age or sex. Implicit in this is that laboratories produce analytically similar results. This paper challenges the validity of this approach.
Methods
A three-week collection of results sent to all primary care centres in England has been analysed by age, sex and laboratory. In all, 1,079,193 serum albumin reports were included in this analysis.
Results
The mean population serum albumin concentration increases to peak at around age 20 years and then decreases with increasing age. Values in females decrease more rapidly but become close to male values at 60 years. The variation between laboratories was large and potentially clinically significant.
Conclusions
Reference intervals for serum albumin should be stratified by age and sex. Until there is greater methodological standardization, laboratories should determine their own reference intervals and not accept a single consensus reference interval.
Introduction
Albumin is the most abundant plasma protein and acts as a transporter for many substances, such as calcium and some drugs, while also having an important role in maintaining oncotic pressure.
Serum albumin concentration is used in the monitoring of renal and liver disease, staging of myeloma, assessment of nutritional status and assessment of risk of toxicity from unconjugated hyperbilirubinaemia and some albumin bound drugs.
There are a number of factors that need to be considered to ensure that the results of measurements are meaningful and clinically useful, and that clinical guidelines for disease diagnosis and patient management can be used to best effect.
Among these factors are matters related to the standardization/harmonization of the analytical measurements themselves, to ensure that there is comparability between results produced by different laboratories and different methods. 1 In addition, there are issues regarding the appropriateness of reference intervals for use in the interpretation of results.
In the UK, initiatives seeking to establish common reference intervals for individual analytes to be used by all laboratories have been promoted. 2 This has led to a wide adoption of 35–50 g/L as the reference interval for serum albumin.
While a common and uniform reference interval for albumin may be desirable, it can only be successfully utilized provided that (i) all laboratories are producing results of a comparable analytical quality and that (ii) there are no clinically significant differences in albumin concentration between the sexes nor clinically significant variation of albumin with age.
There are relatively few studies, which have investigated the effects of age and sex on serum albumin concentration and of those that have been performed there is a lack of consistency in the findings. One study reported that there was neither variation in albumin concentration between sexes nor variation with age. 3 Data from Manolio et al. 4 covered the age range of 18–30 years and did not show any changes with age or sex. However, other studies agree in that serum albumin concentration decreases with age. McPherson et al. 5 demonstrated a reduction in concentration of 10% over the age range 18–65 years in 1000 blood donors; in addition, values were lower by approximately 2 g/L in females until those ages associated with the menopause. Similar findings have been reported by Kallner et al. 6 using results from primary care to assess the suitability of such data for determining reference intervals. Payne and Barth 7 reported on serum albumin in the context of adjustment of serum calcium for albumin concentration and concluded that any differences in serum albumin by age and sex were not significant in calculating serum adjusted calcium. For some studies, the age range of the subjects included was limited with a focus on the frequency of low serum albumin concentrations in the elderly8,9 and in general the number of subjects in the study was only sufficient to allow for analysis of variation by age group rather than by year of age.
In the present study, a very large data set, consisting of 1,079,193 serum albumin results (482,607 male and 596,586 female), in people attending primary care physicians in community settings, has been utilized in order to further investigate the variations of albumin with sex and by age. The size of the data set allows stratification by sex, age (1–90 years) and also by laboratory.
Methods
All test results for routine biochemistry and haematology tests ordered in primary care for the NHS in England are reported electronically using messages that are transmitted in Edifact format via the NHS spine data transfer service (DTS). As part of an audit of data quality sponsored by the UK Department of Health and governed by the Royal College of Pathologists, messages were captured from the DTS for a period of 23 days (3.7 million messages containing 38 million test results on approximately 1129 differently named analytes) in July 2012. They were processed in a secure centre and a pseudonymized extract made available for analysis of compliance with NHS coding standards. A subset was extracted for results for albumin that comprised the following parameters: an anonymized laboratory code, an anonymized GP practice code, the year of birth of the test subject, gender, the test name (reported as either serum albumin or plasma albumin), the test result, the unit of measurement and the reference interval low and high values. Clinical information regarding the reason for investigation was not available. In total, 145 different data sources were identified, each representing an individual laboratory or group of laboratories. Only data sources which provided at least 1000 results (139 in total) were included in this study. For simplicity, this paper uses the term ‘serum albumin’ to cover both serum and plasma sample types, although serum samples accounted for 96% of the reports used in this study. Access to information on race/ethnicity was not possible for this study. For descriptive statistics, the mean and standard error were determined. Population comparisons were undertaken using the Mann-Whitney test. Statistical calculations were made using the statistical package R. 10
Results
The albumin data have been examined (i) by aggregating the results from all laboratories and (ii) by individual laboratory.
Aggregated data
The mean population serum albumin concentration (Figure 1) increases to a peak at about age 20 years and then decreases with increasing age. Values in females decrease more rapidly but become close to male values at age 60 years. There is a dip in mean serum albumin concentration at 12 years of age in both males and females (Table 1). The very large number of results in the data produces very small error limits for each of the calculated means, even though there are biases between the results produced by individual laboratories (discussed below).
Mean serum albumin concentration +/− SEM for each year of age by sex.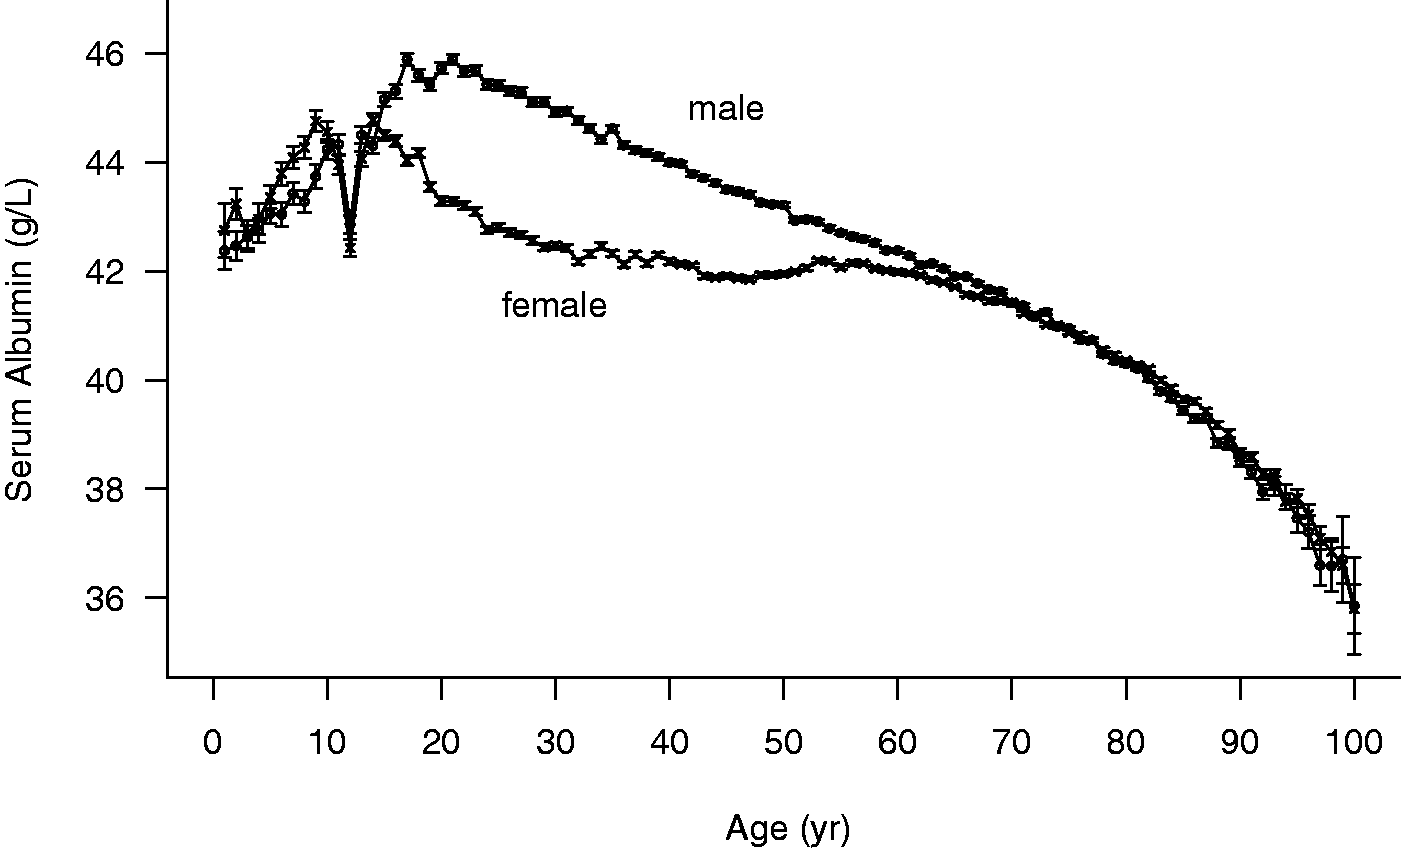
Data analysis by individual laboratory
Data were subdivided into groups by sex and decade, and the mean albumin concentration calculated for each individual laboratory for each group. For age less than 20 years, there were insufficient data to allow division into so many sub-groups and so the analysis was not performed for that age range.
Median serum albumin concentrations stratified into age groups of five years and male and female gender.
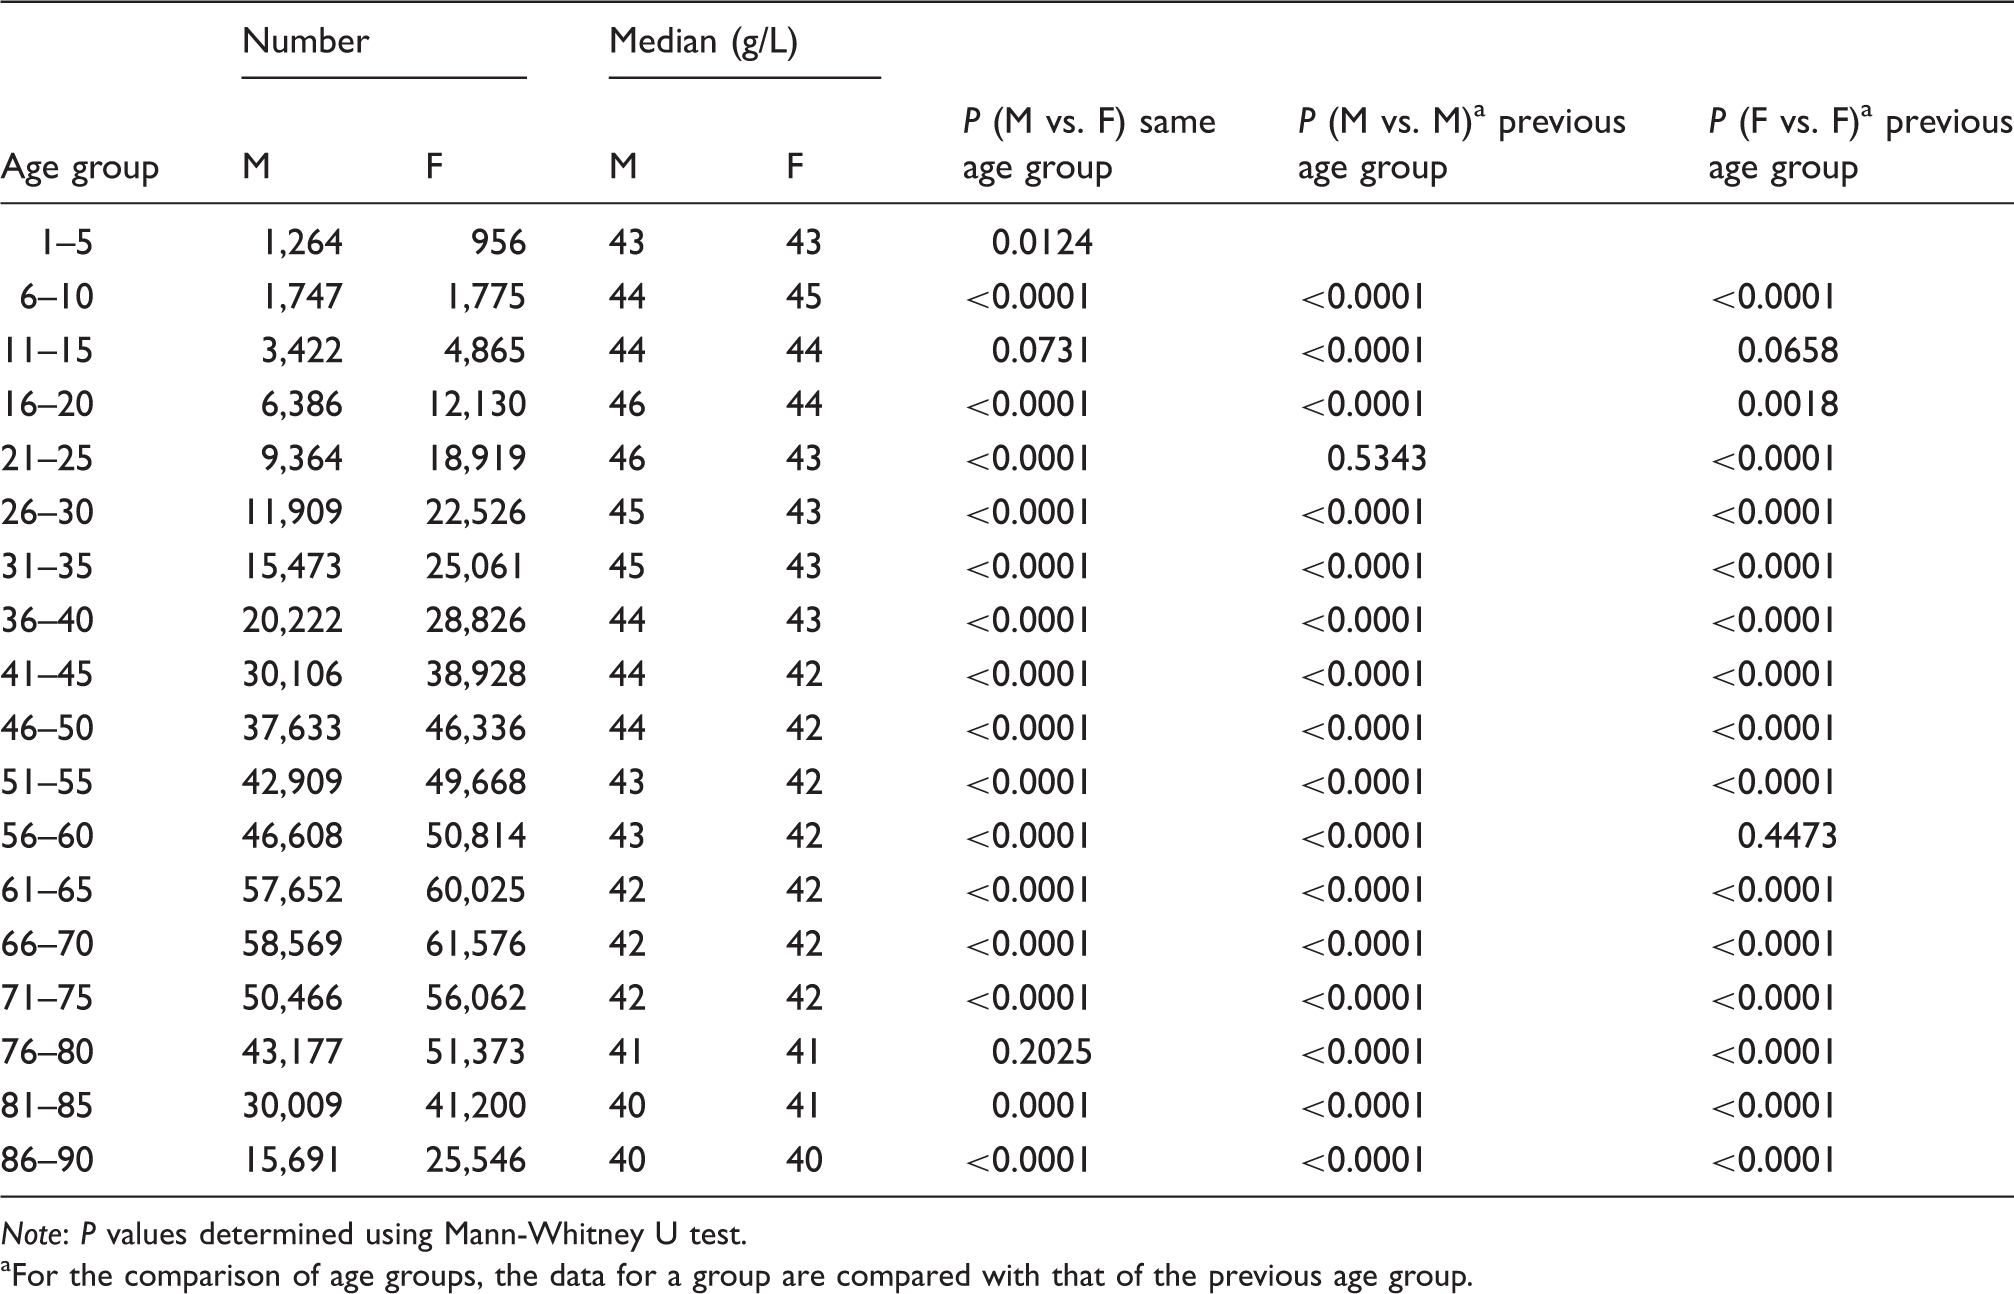
Note: P values determined using Mann-Whitney U test.
For the comparison of age groups, the data for a group are compared with that of the previous age group.
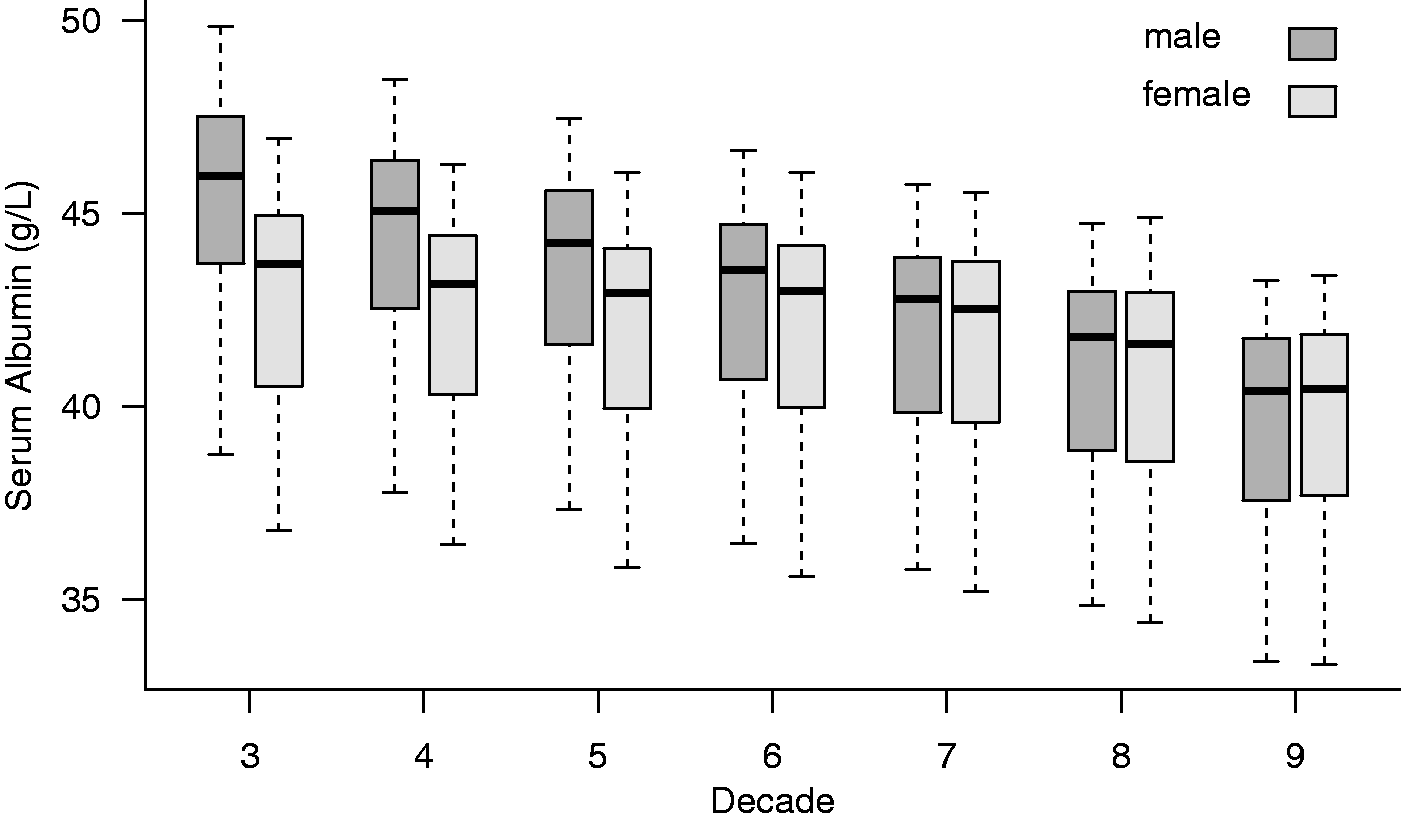
Box and whisker plots illustrating the distribution of serum albumin concentrations of individual laboratories, stratified by age decade and gender for 139 laboratories included in this study. Decade 3: age 21 to 30 years, etc. Box, interquartile range; bar, median; whiskers, maximum and minimum vales.
Five laboratories were selected for more detailed analysis, chosen so as to cover the range of mean albumin concentrations, and all using a reference interval of 35–50 g/L. Data from these laboratories show that the overall pattern seen in aggregated data is present in individual laboratories.
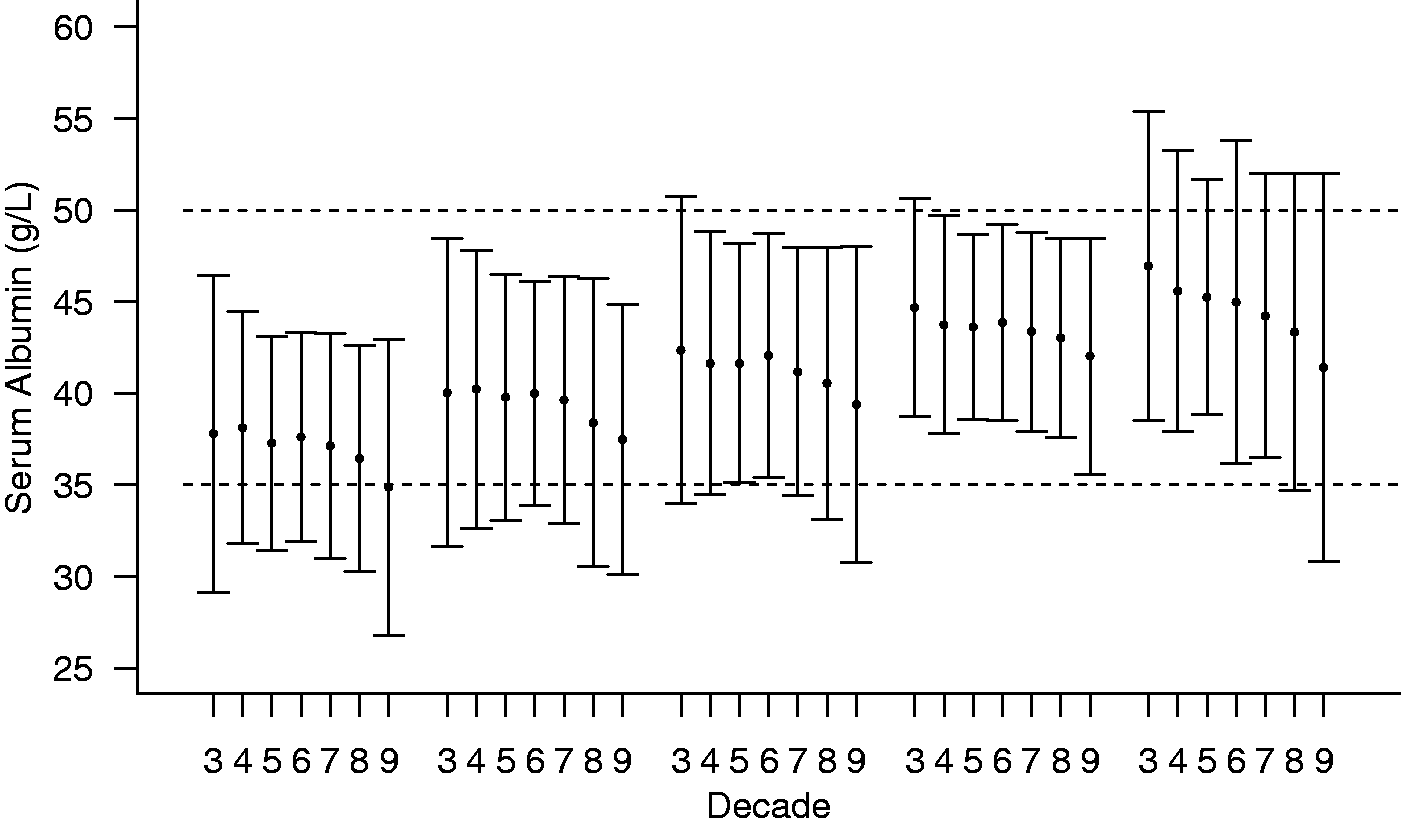
Figure 3 shows the data for males by decade of life and Figure 4 for females for the same five laboratories. The profile of decrease with age is mirrored regardless of the absolute mean population concentration.
The mean serum albumin concentration +/− 2sd by decade for males from five laboratories chosen by quartile of the distribution of mean values from all laboratories. Decade 3: age 21 −30 years, etc. The dashed lines indicate the Harmony recommended reference interval of 35–50 g/L. The mean serum albumin concentration +/− 2sd by decade for females from five laboratories chosen by quartile of the distribution of mean values from all laboratories. Decade 3: age 21–30 years, etc. The dashed lines indicate the Harmony recommended reference interval of 35–50 g/L.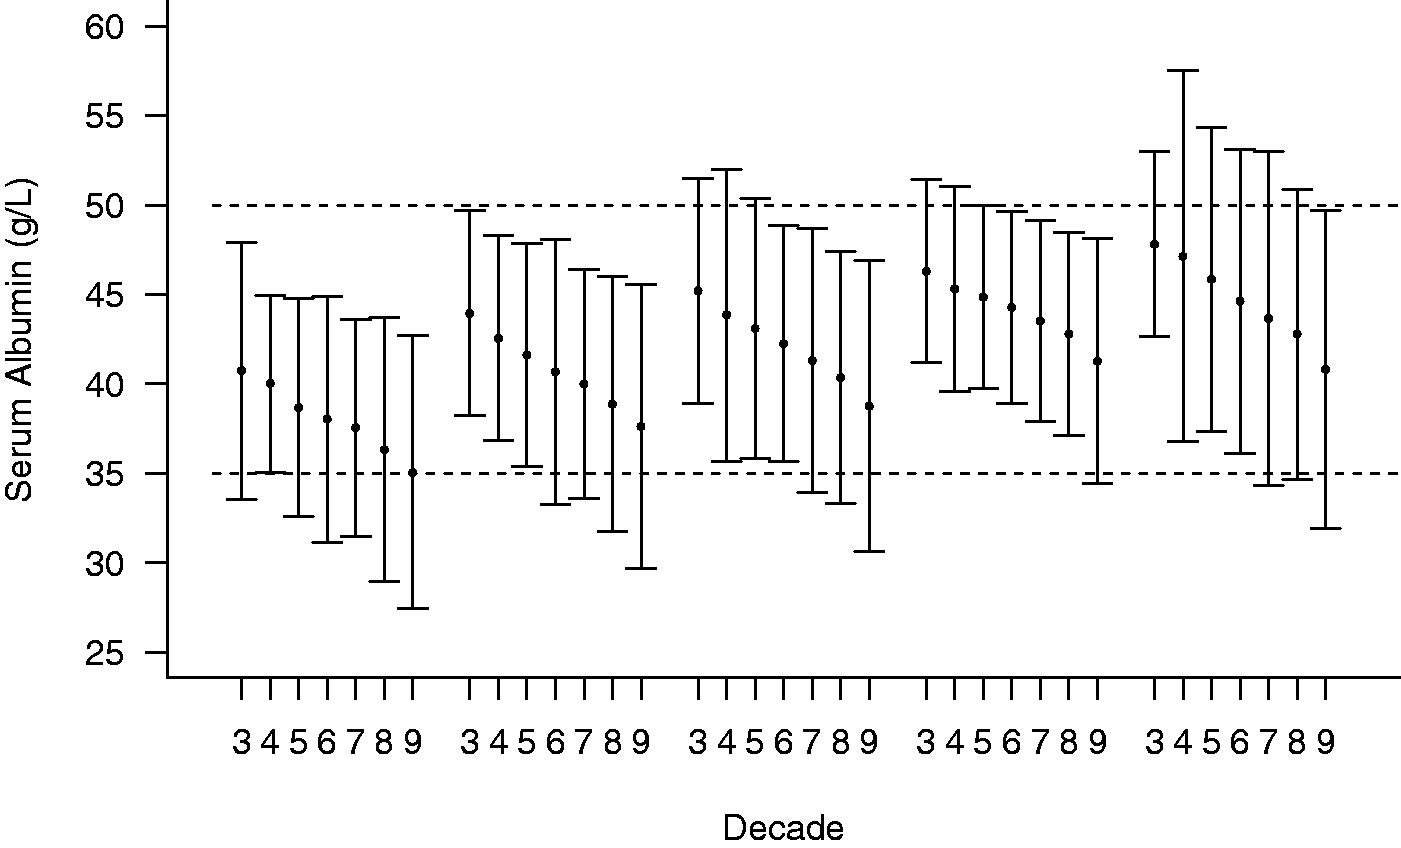
Discussion
The strength of these findings derives from the large number of results available for analysis. In addition, all laboratories showed the same pattern of results although at different overall mean values. Although population-based reference intervals incorporate a wide range of sources of variation, midpoint values are considered to be robust. 6 The three-week window of data collection was chosen to reduce the number of repeat samples on the same patient. It is likely that the population attending primary care includes a relatively high proportion of patients with chronic disease and while this may impact on the changes with age it cannot explain the sex differences. The data from McPherson et al. 5 showed that women taking oral contraception had serum albumin values approximately 2 g/L lower than those who were not, thus supporting a hormonal basis for the differences between males and females seen in this study. The peri-puberty dip in mean serum albumin concentration is apparent in both sexes and requires further investigation.
The large differences in mean values between laboratories is unlikely to be due to the use of different dye binding techniques as differences between bromocresol green (BCG) and bromocresol purple (BCP) were shown to be small in the study by Lo et al., 11 and UK NEQAS results show no systematic differences between these methods. Our observations of EQA returns in two UK schemes indicate values higher by 1.5 g/L from laboratories using BCG assays from those using BCP. However, this difference is small compared with the differences seen between laboratory mean values for each age group. Even differences in IVD manufacturers’ method standardization are unlikely to explain the differences between laboratory findings. Furthermore, there is a disparity between range of results reported by some individual laboratories and the reference interval used by that laboratory to assist interpretation. We have not been able to study the impact of differences in race in the communities served by the laboratories included in this work.
In conclusion, for each of the age/sex groups there is a very large variation in the average results produced by individual laboratories, demonstrating the need for greater methodological standardization. This needs to be addressed if common reference intervals are to be used nationally as currently recommended in the UK. 12 Consideration also needs to be given to the use of age- and sex-related reference intervals.
The impact of both laboratory/methodological variation together with the failure to recognize age and sex differences on clinical use of results affects both the direct use of serum albumin results and the analysis of compounds largely bound to albumin such as calcium and drugs. The use of formulae to adjust serum calcium to a single standard serum albumin value is also challenged by these findings.
Further population studies with additional information on laboratory methods and standardization would be of value.
Footnotes
Acknowledgement
G Weaving and G Batstone wish to acknowledge the immense contribution to this work by Professor R Jones, who sadly passed away during the final preparation of this article.
Declaration of conflicting interests
None.
Funding
This research received no specific grant from any funding agency in the public, commercial, or not-for-profit sectors.
Ethical approval
Not applicable.
Guarantor
GW.
Contributorship
All three authors contributed to the design of the study. GW and GB researched the literature, wrote the first draft of the paper and edited the final manuscript. GW performed all statistical analyses. RJ was responsible for the initial data acquisition and also contributed to the first draft of the paper. Sadly, RJ passed away during the final preparation of the manuscript – written consent from his next of kin is available approving publication on his behalf.