
Abstract
Background
Average of normals is a tool used to control assay performance using the average of a series of results from patients’ samples. Delta checking is a process of identifying errors in individual patient results by reviewing the difference from previous results of the same patient. This paper introduces a novel alternate approach, average of delta, which combines these concepts to use the average of a number of sequential delta values to identify changes in assay performance.
Methods
Models for average of delta and average of normals were developed in a spreadsheet application. The model assessed the expected scatter of average of delta and average of normals functions and the effect of assay bias for different values of analytical imprecision and within- and between-subject biological variation and the number of samples included in the calculations. The final assessment was the number of patients’ samples required to identify an added bias with 90% certainty.
Results
The model demonstrated that with larger numbers of delta values, the average of delta function was tighter (lower coefficient of variation). The optimal number of samples for bias detection with average of delta was likely to be between 5 and 20 for most settings and that average of delta outperformed average of normals when the within-subject biological variation was small relative to the between-subject variation.
Conclusions
Average of delta provides a possible additional assay quality control tool which theoretical modelling predicts may be more valuable than average of normals for analytes where the group biological variation is wide compared with within-subject variation and where there is a high rate of repeat testing in the laboratory patient population.
Background
Currently, quality control (QC) protocols in clinical chemistry laboratories generally rely on repeated analysis of known materials and comparison of the results with a range of expected values. An alternative method for identifying changes in assay performance is the average of normals (AON), where the average of a number of patients’ results is used to identify assay changes.1,2 This process is used most commonly on routine haematology analysers and referred to as Bull’s algorithm. 3 A key variable in implementation of the AON is the number of results included in the AON function (NAON). The major determinant of the utility of the AON approach is the ratio of the coefficient of variation (CV) of the results from the population of sample tested (CVp) to the analytical coefficient of variation (CVa), i.e. CVp/CVa. When this parameter is larger, i.e. the between-person biological scatter is high compared to the assay imprecision, the method is less useful. Put another way, as CVp/CVa increases, a larger number of patients’ results are required to accurately define the precision of the assay against the background of patient variation. An AON approach may have benefits over traditional QC methods by providing information about assay performance either more rapidly or more cheaply. These benefits will vary between laboratories depending on the number and type of samples received by the laboratory. For example, a laboratory with a high volume of outpatients’ samples may be more likely to gain useful information than a laboratory with a low throughput of samples taken predominantly from critically unwell patients.
Another tool used to assess laboratory quality is a delta check procedure, where the latest result of a patient is compared with the previous value of the same patient.4,5 This process is generally used to detect individual results which may be affected by various errors, either preanalytical or analytical.
In this paper, I consider the effect of combining the process of AON with delta checking to form a new QC tool, the average of delta (AOD). The AOD is similar to the AON except that rather than taking the average of a number of results from individual patients, an average of a number of delta values from individual patients is made and this value tracked over time.
Methods
Models were developed for both AOD and AON to allow comparison of performance of the two methods with the same input parameters.
The factors which combine to give the variability in individual results taken from a healthy population are the CVa, the within-person biological CV (CVi) and the between-person biological CV (CVg). All three of these factors are combined to give the spread of results found in a population (CVp). The relationship between these parameters is shown in equation (1)
When using an AON approach, the effect of increasing the number of samples included in the calculation is to narrow the scatter of the result of the calculation by dividing by the square root of the number of samples (equation (2))

The factors which combine to give the variability of results in a patient in steady state are the CVa and the CVi. The total variation in a set of results from the same patient when in steady state is (CVa2 + CVi2)0.5. The difference between two results in the same person is the combined uncertainty of each of the two measurements which is expressed as √2 × (CVa2 + CVi2)0.5. If a number of these differences (NAOD) are averaged, the expected CV of this AOD function can be described as

An inspection of equations (2) and (3) indicates that the scatter of the AON function (relative to CVa) is dependent on the relative magnitude of both CVi and CVg to CVa, whereas the scatter of the AOD function is related only to CVi. This suggests that AOD may perform better than AON in cases where CVg is large compared to CVi.
The AOD and AON functions can be used to detect changes in assay bias when the value of the function exceeds a preset limit. Variables which can be adjusted include the number of delta or patient values included in the function, any data truncation applied to exclude extreme results, the amount of change in this function required to trigger the rule and any time limit on the data used for the calculation. A comparison of the relative utility of AOD and AON functions will also depend on the number of results with previous samples from that patient to allow calculation of the delta value. In this study, I have investigated the effects of various values of N on the scatter of the AON and AOD functions, the response of the functions to the introduction of bias and the number of delta value or patients’ results required to be analysed to trigger the functions with 90% probability for various example analytes.
A spreadsheet application was developed in Excel 2010 (Microsoft, USA). The CVi, the CVa and the CVg were modelled by separate sets of random numbers generated using the Excel random number generator with the normal distribution function. For assessing the delta value, the difference between the most recent value and the previous value from the same patient, a separate set of random numbers was used to generate the previous value. Input values for CVi, CVa and CVg were changed to simulate the relationships found in different analytes. AOD and AON were modelled by taking the average of N consecutive delta values or sample values, respectively, with sequential addition of a new data point and removal of the oldest data point simulating response to a new patient’s result. A rule was said to have fired if it passed a certain preset value, described in terms of the CV of the AOD function. For the purposes of this study, a limit of 2.5 times the CVAOD or CVAON was selected to trigger the rule. Changes in bias were modelled by adding a fixed value, expressed as a multiple of the CVa to all results from a set point onwards. A total of 200 sets of data were generated and assessed for each set of input criteria.
Examples for illustrative purposes were developed using values for CVi and CVg from the Carmen Ricos Biological Variation database 6 and for CVa from a Roche Modular analyser with Roche reagents for chemistry analytes and a Beckman Coulter analyser for haematology in routine use in our laboratory. Note that while CVs are used in the analysis, the use of standard deviations is mathematically equivalent as all values are multiplied by the same factor, i.e. the average analyte concentration. Example data for the number of requests with previous results in different clinical settings was taken from the SydPath laboratory which serves an acute care hospital as well as providing services to general practitioners. Data for requests over three months were assessed for requests within various time periods up to one month.
For the purposes of the model, it was assumed that all parts of the model, e.g. within subject, between subject and analytical variation are distributed in a Gaussian manner. No ethics committee oversight was sought as the analysis is based entirely on theoretical analysis.
Results
The spreadsheet application generated data for the AOD function for various values of CVa, CVi and N. An example of the effect of changing values NAOD on the scatter of the AOD function is shown in Figure 1. The figure shows one example data-set derived from the spreadsheet application and also the flagging limits for these values of NAOD set at 2.5 times the CV of the AOD functions. It can be seen that with higher values of NAOD, the scatter of the AOD function is reduced.
Example of the effect of the number of data points (NAOD) on AOD functions. Average = 1.0, CVa = 0.1, CVi = 0.2.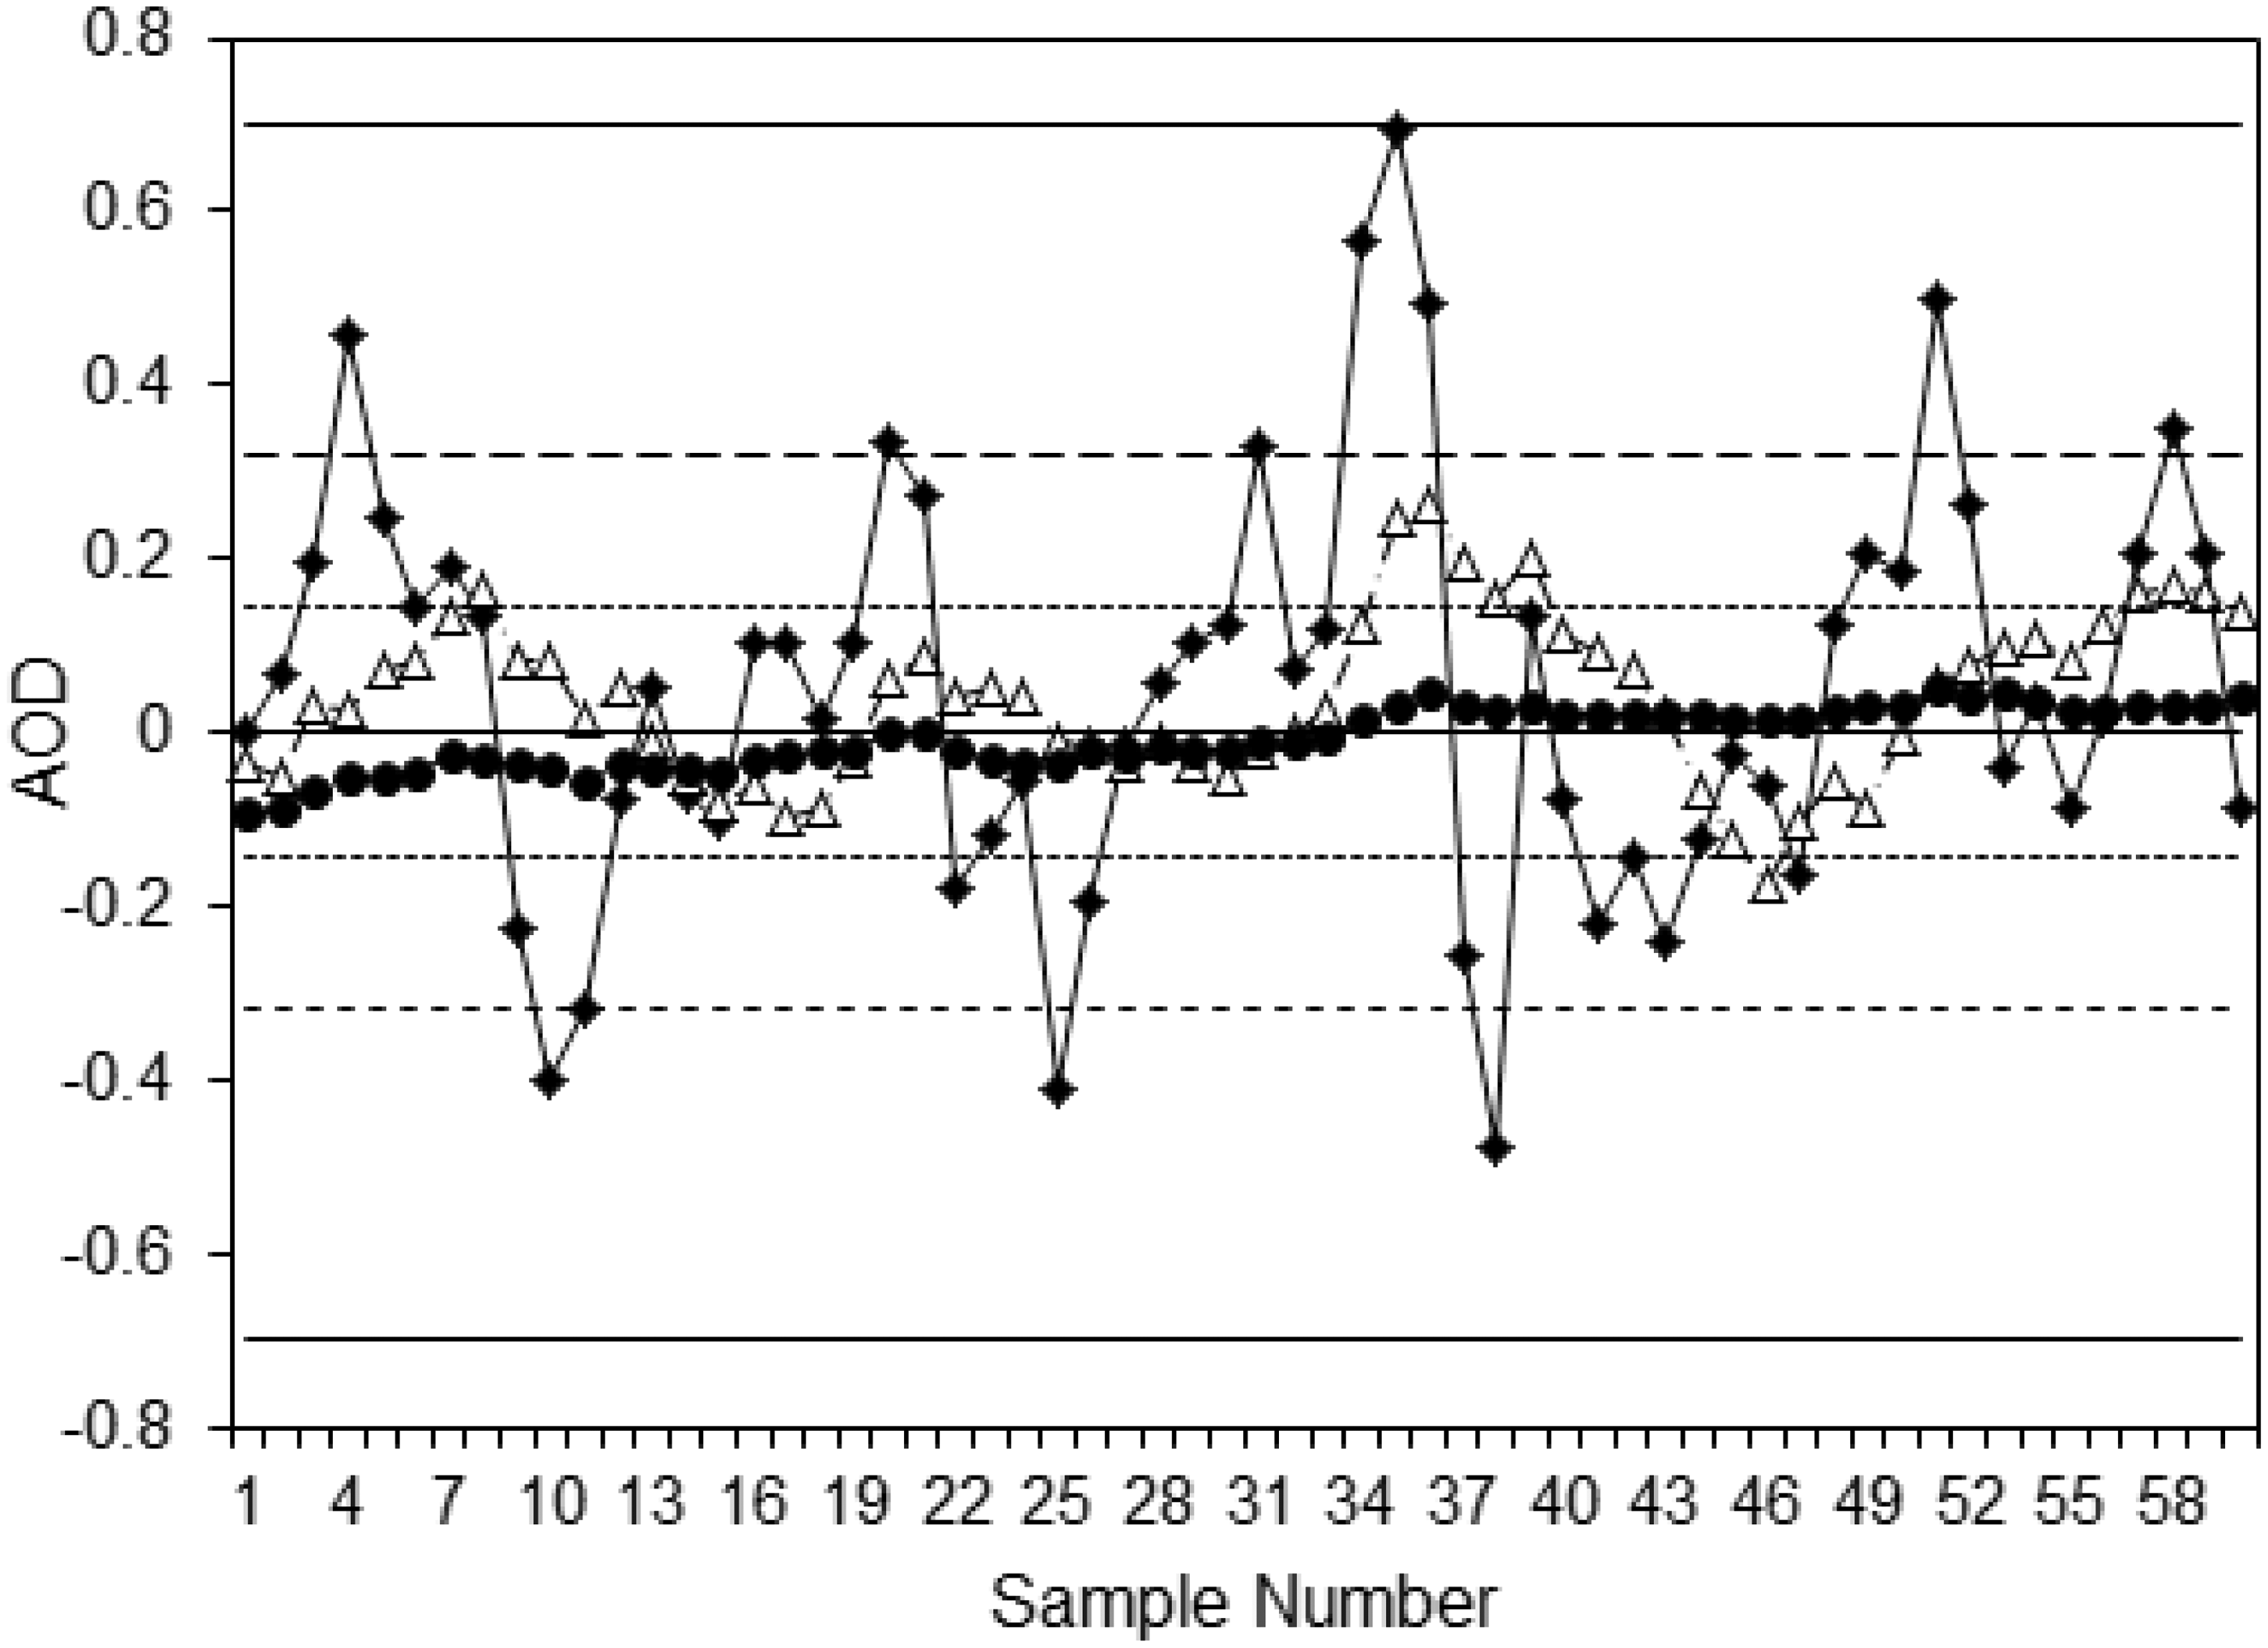
Another feature seen from observation of these AOD function is the nature of the variation between successive values. With NAOD = 2, the function is highly variable from result to result, whereas with higher values of NAOD, the function moves more slowly relative to the ±2SD limits. This affects the performance of the AOD function, as successive points, although randomly distributed, are not independent of previous values. This affects the sensitivity of an AOD function for an assay shift depending on where the AOD function is located prior to the onset of the shift and the nature of this random background variation. Thus, while AOD functions with a larger number of sample pairs included show less overall variability, as seen by the smaller CVAOD, they may respond more slowly to change in assay performance. The same effect is seen with AON functions (data not shown).
The effect of adding a fixed bias to the results on the AOD function was modelled in the spreadsheet application. Examples are shown in Figure 2 with CVi/CVa = 2, and a fixed bias of three times the CVa added after sample number 10. All AOD functions start to increase after the change in bias with those with higher values of NAOD increasing more slowly, but with less scatter around the line. Each data-set trends towards a new set point, three times the CVa from the starting point, taking NAOD new data points to reach a new steady state, i.e. when all the data points in the AOD function have been produced since the introduction of the bias. The change in the mean of the AOD can be predicted as it takes NAOD data points for the AOD function to reach the new set point. The ±2SD limits of scatter around the mean follow changes in the mean. Thus, the slope of the mean and ±2SD limits of an AOD function can be described as follows: Slope of AOD = Assay shift/NAOD.
Example of adding a fixed bias to AOD functions.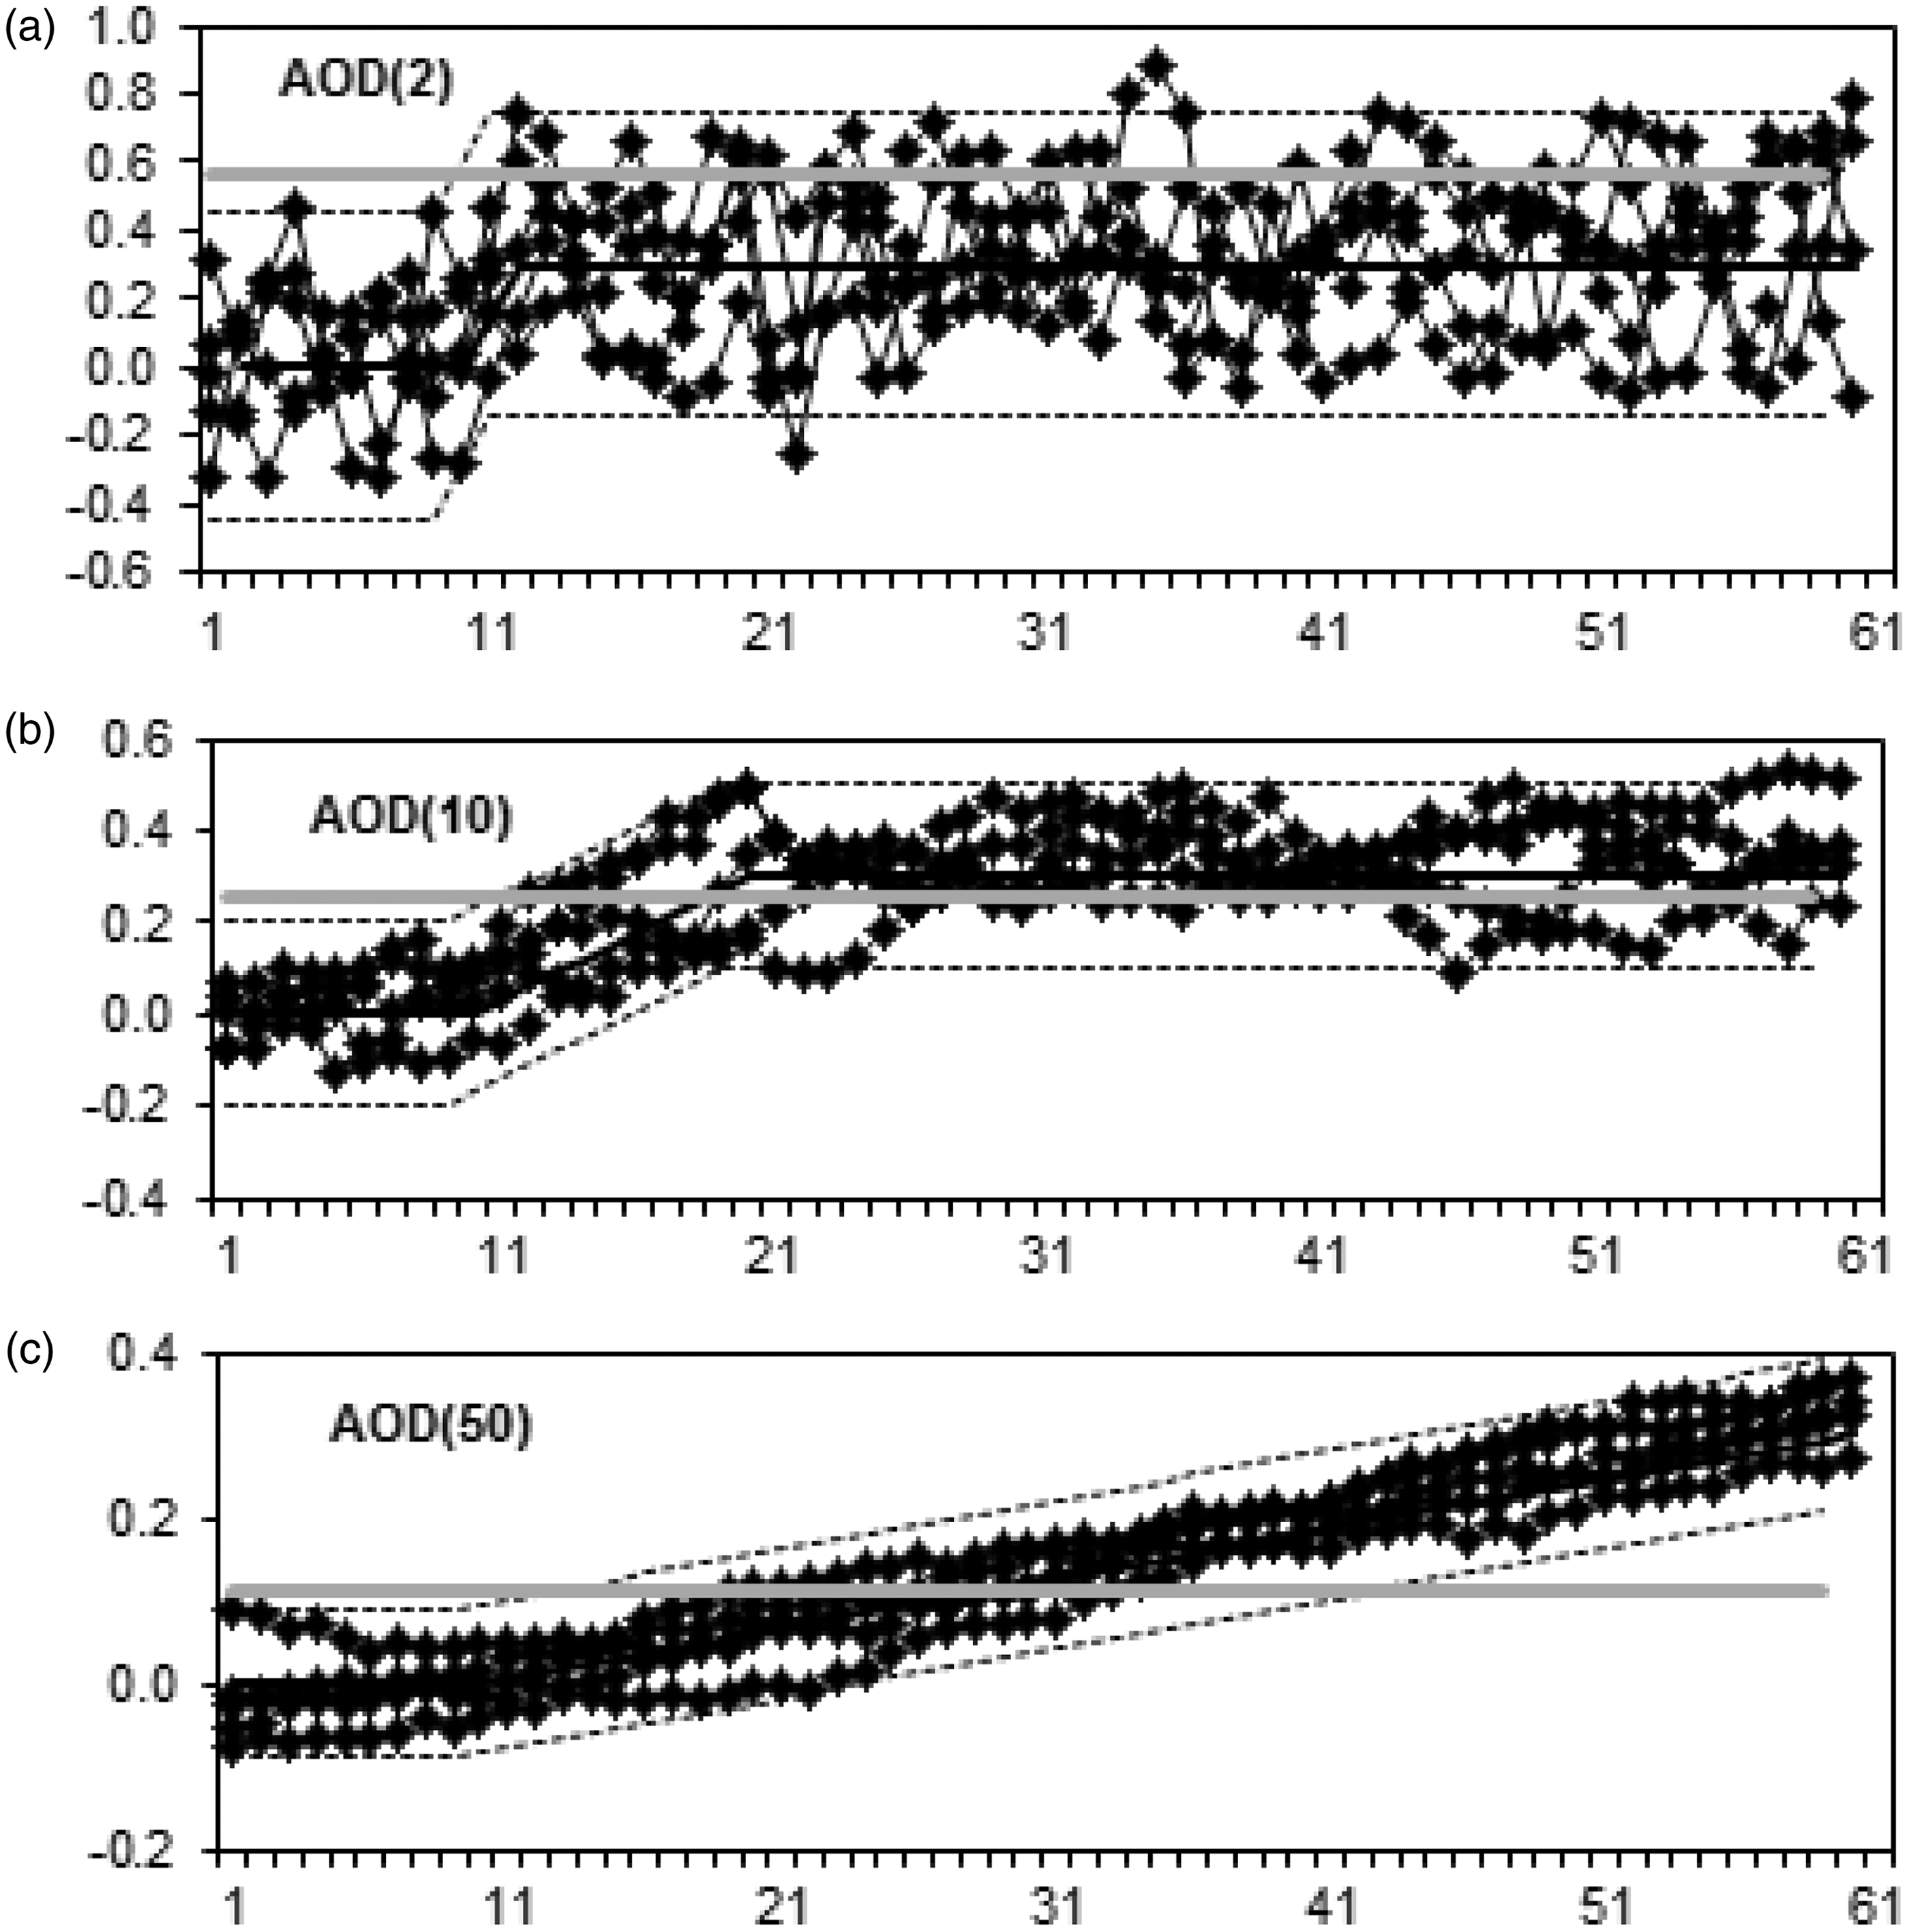
The number of patients’ samples required to fire a rule after the introduction of a fixed bias was assessed using 2.5 times the CV of the selected AOD function as the trigger to fire the rule. For each set of variables (CVa, CVi, CVg, NAOD and NAON), the number of samples following the onset of the bias which were required for firing of the AOD and AON rules in 90% of the assessments were determined. Introduced biases equivalent to two, three and four times the CVa were assessed. An example of these data is shown in Figure 3 for sets of variables based on serum gamma-glutamyl transferase (GGT) (a high CVg:CVi ratio and a high CVi:CVa ratio) and serum sodium (CVg, CVi and CVg all similar). From this, a number of observations can be made. Firstly, as expected, in all cases, a larger assay bias is detected earlier than a smaller bias with both functions and at all values for NAOD and NAON. Secondly, the relationship between CVa and CVi markedly affects the number of samples needed to detect a bias with AOD. For example, it takes approximately 90 sample pairs to reliably detect a 3 × CVa shift for GGT (CVa = 2.4%, CVi = 13.4%) and fewer than 10 sample pairs for the same relative bias for sodium (CVa = 0.6%, CVi = 0.7%). A similar effect is seen for AON based on the relationship between CVg and CVa. Thirdly, the model shows that fewer data points are required for error detection with AOD compared with AON when CVg is large compared with CVi. In the example of GGT, AON takes over twice as many data points than AOD depending on the amount of bias and the numbers in the formulae. By contrast with sodium, there was never more than 30% between the required number of data points for AOD and AON. Finally, it can be seen is that the number of samples required for AOD and AON functions in the data sets modelled is generally quite small, typically between 5 and 20 samples. For examples such as GGT, where substantially more delta values must be analysed to achieve 90% error detection than are included in the AOD function, this indicates the added bias is smaller than the AOD trigger limit and the rule fires intermittently as the AOD function moves within its new range.
Examples of 90% error detection with AOD and AON functions for various values of NAOD and NAON. (a) Based on serum GGT (CVa = 2.4%, CVi = 13.4%, CVg = 42.5%); (b) based on serum sodium (CVa = 0.6%, CVi = 0.6%, CVg = 0.7%). Closed symbols – AOD functions; open symbols – AON functions. Circles – added bias of 2 × CVa, squares – added bias of 3 × Cva, triangles – added bias of 4 × Cva. Black dotted line – data points below this line indicate the function has 90% error detection with fewer samples than are included in the function.
To obtain some examples of expected effects in various analytes, common chemistry and haematology analytes were assessed. The value for NAOD and NAON was set at 10 in all cases, a shift of 3 × the CV of the function was used to trigger the rule and a 2.5 × CVa bias used for demonstration purposes. The results are shown in Figure 4. For many tests, there is little difference in the number of data points required to trigger the rule. For alkaline phosphatase (ALP), mean cell haemoglobin (MCH), creatinine, mean cell volume (MCV), monocytes and lymphocytes the AOD function required fewer than half the number of data points required for the AON function, all tests where the CVg is over three times the CVi. The feasibility of AOD in different settings was assessed using example data from our laboratory. For the tests included in a full blood count or a ‘Electrolytes, Urea and Creatinine’, the highest repeat testing rate was the intensive care units where 65% of requests had a previous result from within the last 24 h and 92% in the previous 48 h. For all hospital inpatients, 33% had a previous result from within 24 h, 58% from within 48 h and 67% within seven days. The repeat rate for general practice was much lower with fewer than 2% having a previous result within seven days and only 8% within one month.
Examples of 90% error detection with AOD and AON functions for various example analytes. The CVa, CVi and CVg in percent are shown following the test names (CVa, CVi, CVg). The graph shows the number of data points needed to trigger the functions with 90% probability of detecting a 2.5 × Cva bias. Black squares – AOD; grey circles – AON.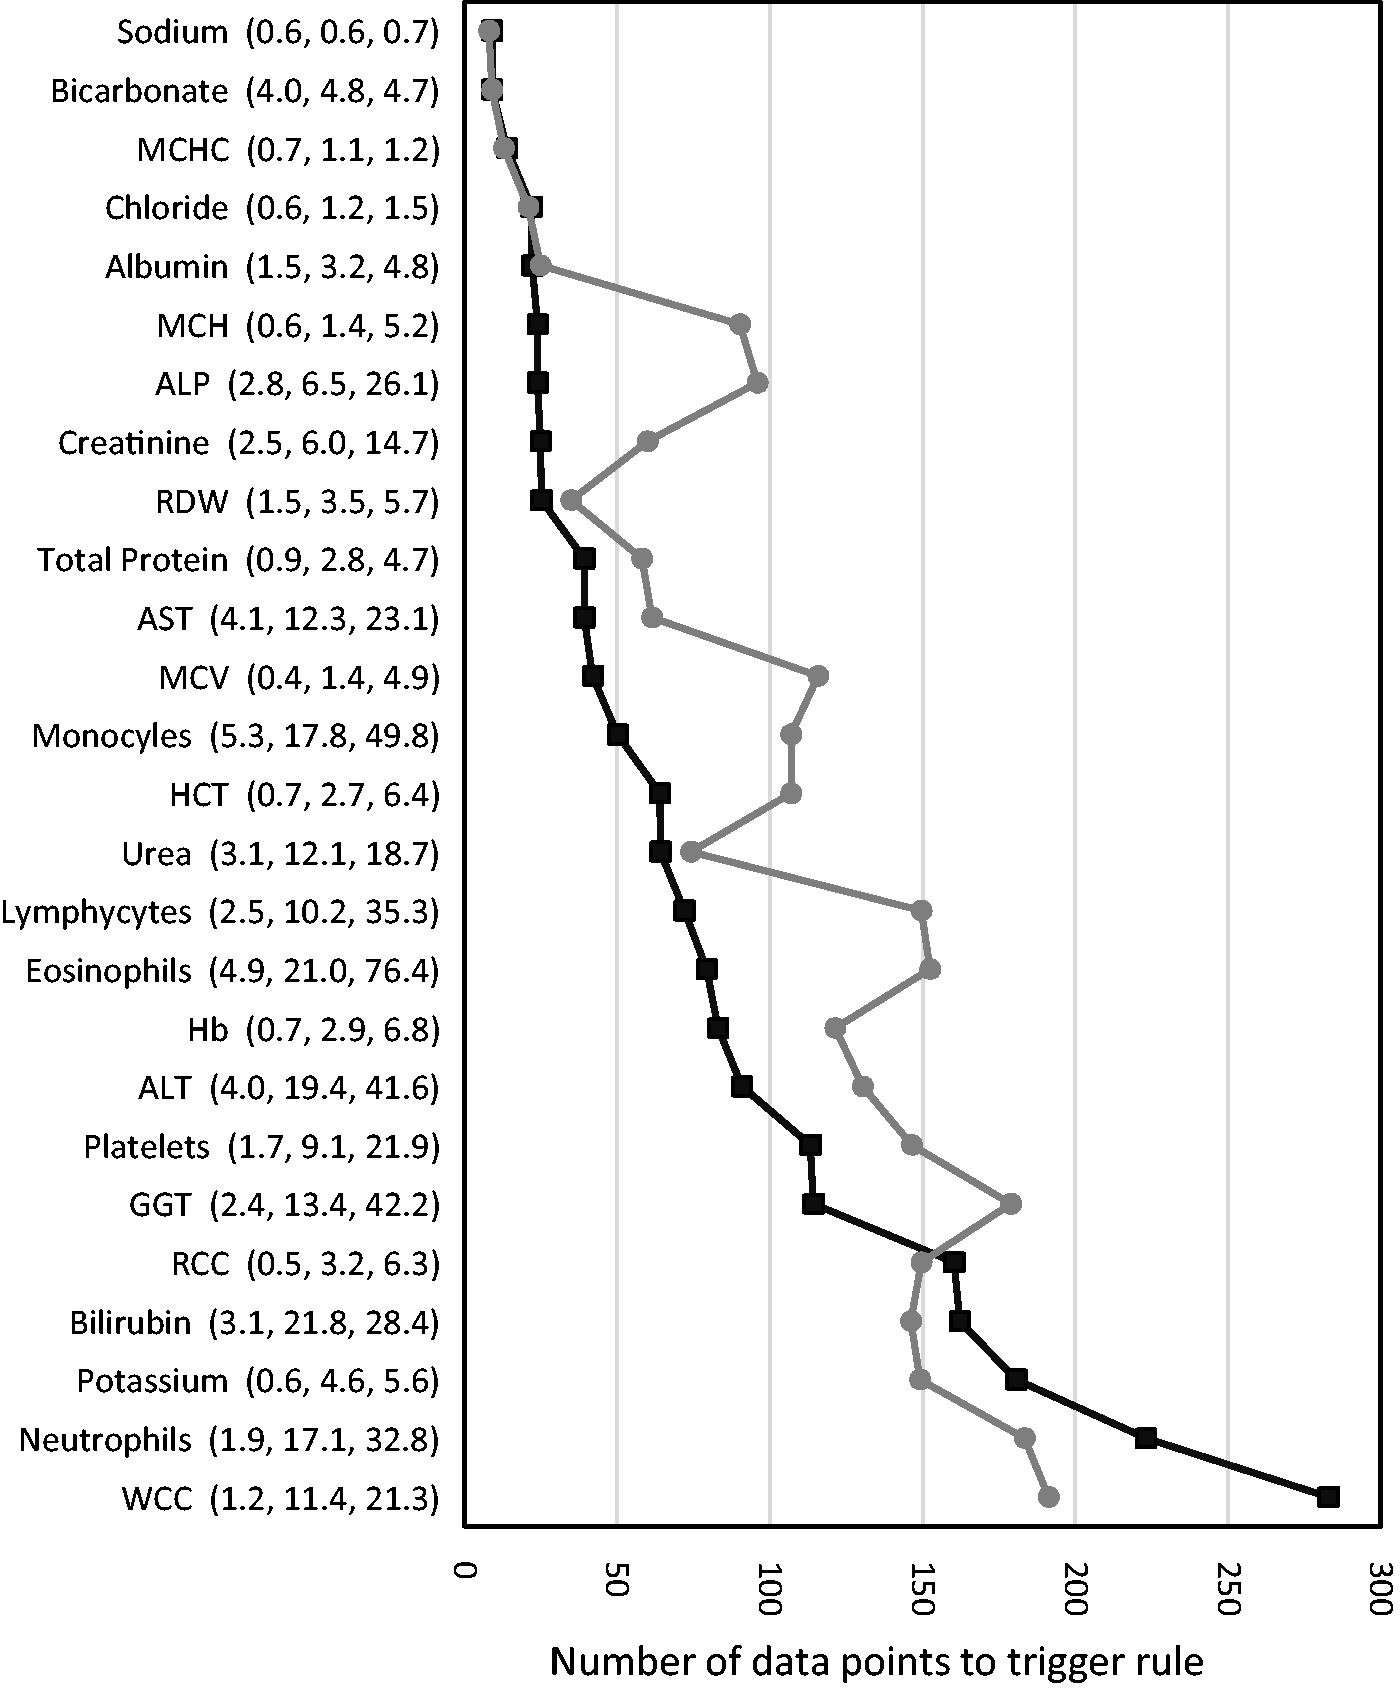
Discussion
The concept of AOD developed here began with an observation from a laboratory scientist who was validating routine results and commented that a change in assay performance should have been obvious as there had been several ‘delta fails’ on the same analyte in a short period of time. From this observation came the concept of formally assessing sequential delta values and therefore the need to determine the likely clinical utility of this approach. The general concept has been developed independently in two locations leading to publications in abstract format.7,8
This study is a theoretical exploration of ‘Average of Delta’ introducing the concept, developing terminology and providing some introductory modelling and comparison with the more established ‘Average of Normals’. On the basis of this study, it can be seen that analytes which may be well served by the AOD approach as opposed to the AON approach are those where the within-subject variability is small relative to the between-subject variability. If AOD is aimed at gathering information between standard QC testing intervals, then the studies performed indicate that fewer samples (with previous results) are needed for AOD compared with number of samples for AON when the analyte has a smaller CVi relative to its CVg. The potential advantage of AOD requiring fewer input data points than AON for some analytes can only be realized in an environment where a high proportion of samples have a previous result for comparison. From the data from our laboratory, this is more likely in the hospital inpatient environment, especially in the intensive care setting.
The shapes of the curves in Figure 3 predicting the number of samples to reliably detect added biases under various conditions are complex and driven by a number of different factors. For any circumstances where the shift being detected exceeds the flagging limit by more than twice the SD of the AON or AOD function, then the number of samples required to detect the shift is always less than the number of samples in the function. An example of this condition being met is seen in Figure 2(c) where the 95% confidence limits of the AOD functions passes the flagging limit within the number of samples used in the function. In Figure 3(b), this condition is met for N of 5 and above for a shift of 4 × CVa and N of 20 and above for a shift of twice or three times the CVa, illustrated as data points below the dotted line. In these cases, the number of samples needed increases with increasing numbers in the function. This condition will not be met if the shift is insufficient for the function to completely cross the flagging line for the number of samples in the function as shown in Figure 2(a) and (b). In these cases, the number of samples required to detect the change with 90% confidence will exceed the number of samples in the function. In these circumstances, the functions may cross back within the flagging limits even though the error is still present indicating that the error detection in the model presented depends on acting on the first flagging of the functions. It is also worth noting that these are the number of samples predicted to flag the change with 90% confidence, i.e. the shift will usually be flagged much earlier after its onset.
The performance of AOD and of AON is dependent on the nature of the population being served. If there are a large number of abnormal results, then the AON function may either exclude these results, reducing the number of results available for inclusion in the analysis, or include them with the effect of increasing the CV of the population and thus reducing the sensitivity of this QC protocol. Similarly, if the patient population includes a high proportion with rapidly changing results, the performance of the AOD function may be degraded; however, the inclusion of results from patients with stable abnormalities may favour the use of AOD over AON. As the models presented are based on assumptions of only healthy people being included, the predicted performance of AOD and AON needs to be assessed in different real-world laboratory settings.
It is possible that AOD may have advantages over AON where there are short-term changes in patient averages, for example, with variation during the day due to changes in patient mix such as the presence of various specialty clinic samples or a change in the mix between inpatients’ and outpatients’ samples. 9 As the AOD process identified changes compared with samples for the same sample, this effect of change in testing populations should be avoided. In contrast, the AOD function, but not the AON function, has a lag phase after restarting a method after any assay change as only results produced after the change can be included in the function. The length of this delay depends on the average time between repeat requests. This may be a single day for inpatient populations and much longer for outpatient populations.
A number of practical issues arise with the concept of AOD. Obviously, both the current results and any previous results must be available in a computer package to make the calculations and provide real-time warning signals. For assays being performed in batches, the calculation of AOD would be performed in the tested batches rather than the sequential updated proposal presented here for random access analysers. As with AON, 2 there are a range of variables to be established with any routine use of an AOD function. These include the number of results to include, the limits for triggering the rule and any outlier exclusions. These involve a trade-off between false triggering of the rule and improved sensitivity for degrees of introduced bias. Additionally, the time period between samples within which there is utility in including the difference in the AOD function is unknown and is likely to depend on the long-term stability of the analyte in the patient and of the analytical method.
This study has a number of specific limitations. It is based on theoretical data with well-defined biological and analytical conditions. It is expected that different performance would be obtained in practice and may be very different in different laboratory settings. Variability may be due to the ‘unwellness’ of the patient population, the number of repeat samples, the time between repeat samples, within and between day patient population differences, deviation of analytical performance or preanalytical factors from the Gaussian model. The model here also assumes that the variability between patient results is constant over time; however, this may not be the case for some analytes.10,11 The study was also limited to assessment of assay bias with error detection of changes in imprecision not included in this analysis.
This paper presents the theoretical concept of AOD for development as a QC tool in routine clinical laboratories. It provides the possibility of improved error detection by comparison with AON depending on a range of test and population specific factors with use as a supplement to standard QC protocols. Further analysis is required to determine the utility of AON in the routine laboratory environment.
Footnotes
Acknowledgements
I acknowledge Marianne Roser for making the observation in the laboratory which led to the development of the concept.
Declaration of conflicting interests
None declared.
Funding
This research received no specific grant from any funding agency in the public, commercial, or not-for-profit sectors.
Ethical approval
Not applicable.
Guarantor
GRDJ.
Contributorship
GRDJ conceived, executed and wrote the study.