
Abstract
Background
We have reported that the blood glucose normalization treatment reduced the albumin glycation sites and the intensity of albumin AGE fluorescence in patients with abnormally high glycated albumin levels. To clarify the relationship between glycaemic control status and levels of glycated proteins and related markers, we studied the change of the markers of the DM patients with and without fatty liver, liver cirrhosis and dialysis before and after the intensive diabetic treatment.
Methods
Eight diabetic patients with abnormally high glycated albumin levels (no complications: 2, fatty liver: 3, liver cirrhosis: 2, dialysis: 1) were recruited. In the hypoglycaemic treatment for these patients, the HbA1c, glycated albumin, albumin AGE fluorescence, pentosidine, endogenous secretory receptors for AGE (esRAGE) and glycation sites of albumin were determined.
Results
Glycated albumin and HbA1c levels dropped after the treatment. Albumin glycation sites decreased in almost the same pattern, irrespective of the type of complications. The fluorescence intensity and pentosidine concentrations decreased significantly. However, post-treatment pentosidine concentrations were higher than the reference interval in all cases. Average esRAGE concentrations did not change and were lower than the reference interval.
Conclusions
Hypoglycaemic treatment reduced the glycated albumin levels, glycation sites of albumin and AGE concentrations but not esRAGE concentrations in diabetic patients with or without fatty liver, liver cirrhosis, and dialysis. Checking and maintaining low glycated albumin levels would prevent the formation of AGE and may be useful to prevent the onset or progression of diabetes complications.
Introduction
Diabetes is a chronic disease and requires consistent glycaemic control and the reduction of multirisk factors such as blood pressure and lipids. 1 Large-scale clinical studies such as DCCT, 2 Kumamoto study 3 and UKPDS 4 have shown that improving glycaemic control inhibits the occurrence and progression of diabetes complications.
Haemoglobin A1c (HbA1c) is frequently used as an index of glycaemic control, 1 whereas the measurement of glycated albumin (GA) showing an average condition of blood glucose control for two or three weeks has been put into use in clinical practice. For evidence regarding GA and diabetes complications, a case cohort study for DCCT/EDIC study showed that GA is a risk factor equivalent to HbA1c in the microvascular complication of diabetes. 5 The ARIC study that followed nearly 11,104 patients for 20 years showed that GA, like HbA1c, is related to total mortality and heart disease. 6
Albumin is distributed throughout a living body. It is known that albumin (1) accounts for almost the entire amount of drug binding in plasma, 7 (2) behaves as an antioxidant, 8 and (3) acts as an esterase, 9 and that the glycation of albumin produces the impairment of these properties in association with an increase in fluorescence. It is known that the rise of the glucose concentration and the change of albumin to GA induce the functional changes of albumin, such as changes in the drug binding ability and the deterioration of antioxidative properties.7,8 In addition, GA is reported to guide many different factors that induce diabetic complications, such as fibronectin and collagen IV production by glomerular endothelial cells, 10 nitric oxide production in vascular smooth muscle cells 11 and the self-death of the beta cells of the pancreas. 12 This suggests the possibility that GA may directly cause diabetes, complications in small vessel and large vessel.
Furthermore, it is known that the persistence of a hyperglycaemic condition changes GA to an advanced glycation end product (AGE). Elevated AGEs elicit severe downstream consequences via their binding to receptors of AGEs (RAGE). Pentosidine is one of the well-characterized AGEs. The effects of AGE are known to include oxidative stress and oxidative modifications of biological compounds, together with heightened inflammation. 13
Endogenous secretory RAGE (esRAGE) is one of the circulating soluble AGE receptors, and esRAGE acts as a decoy for RAGE ligands by sequestering RAGE ligands or competing with full RAGE for ligand binding. 14
Normalization of GA levels means reducing GA and AGE that may cause the occurrence or progression of diabetes or complications. Evaluating the relationship between GA, AGE and esRAGE in treatment may be important. We reported that the GA levels would drop, albumin glycation sites would decrease and AGE-derived fluorescence within albumin would decrease as the glycaemic control condition ameliorates if a patient with an abnormally high blood glucose concentration is treated. 15 To clarify the effect of fatty liver, liver cirrhosis and dialysis for the glycation reaction, we studied the DM patients with fatty liver, liver cirrhosis and dialysis. In addition, we also measured serum pentosidine and esRAGE concentrations to estimate the GA contribution to the diabetic complications.
Material and method
Subjects and control plasma
Patient's background in a baseline.
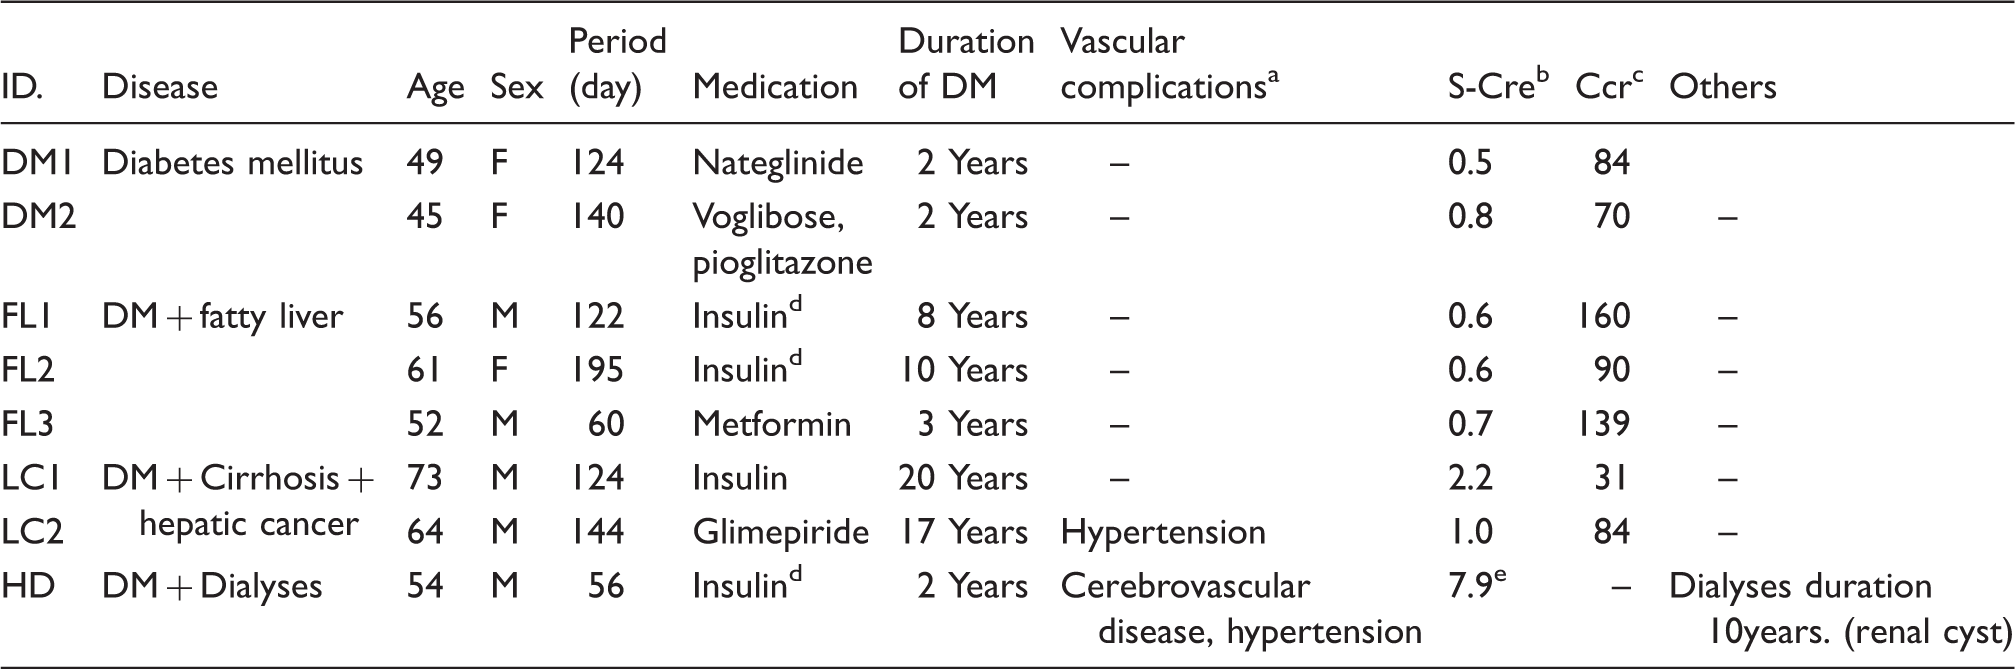
Vascular complications are including cardiovascular disease, cerebrovascular disease, and hypertension.
Serum creatinine.
Creatinine clearance.
Intensive insulin therapy.
Measured before the start of dialyses.
Measurement
In the hypoglycaemic treatment of these patients, a five-point blood collection was performed before treatment (point 1) and for nearly four months after the commencement of the treatment (135 ± 40 days: points 2–5: each points were set as appropriate interval to check if the HbA1c and GA reach stable). They underwent the measurement of HbA1c (HLC-723 G8, Tosoh Corporation, Tokyo, Japan), GA (Lucica GA-L, Asahi Kasei Pharma Tokyo, Japan),16,17 albumin AGE fluorescence, pentosidine (FUSHIMI Pharmaceutical Co., Ltd, Kagawa, Japan) and esRAGE (B-Bridge, Santa Clara, CA, USA). One patient was selected from each type of complication and underwent the evaluation of glycation sites within albumin before and after the treatment. The protocol of this study was approved by the Ethics Committee of Daisan Hospital, Jikei University School of Medicine, and informed written consent was obtained from all the patients.
Fluorometric determination of AGE
Albumin AGE fluorescence and glycation sites in albumin were measured using methods that have already been reported. 15 They are outlined as follows.
Albumin was separated from other proteins in an ion-exchange column (Shodex Asahipak ES-502N 20C, Showa Denko, Japan), and protein concentration was adjusted by dilution with 10 mmol/L phosphate buffer. Fluorometry was performed using an FP-777 spectrofluorometer (Japan Spectroscopic Co., Ltd, Japan) at room temperature. AGE-related fluorescence was measured using an excitation wavelength of 370 nm and scanning at emission wavelengths from 400 to 550 nm. 15
Detection of albumin glycation sites
The method for the detection of albumin glycation sites has been previously described in detail. 15 Before proteolysis, the samples were subjected to reduction and alkylation, and then endoproteinase Glu-C digestion was performed. Liquid chromatography/mass (LC/MS) analysis was performed using an Agilent 1100 HPLC system (Agilent Technologie) and QSTAR Pulsar-i mass spectrometer (Applied Biosystems). The glycation ratio of each peptide was calculated from the peak area on the LC/MS chromatogram. In this report, if the glycation site of lysine residue was identifiable, it was expressed as the sequence number (e.g. Lys525). Where a lysine residue was unidentifiable, its candidate was included in the list (e.g. Lys136/137).
Statistical analysis
Numerical values in this report are described in average ± SD. Stat Flex ver.6 was used as the statistical software, and the paired t-test was used to analyse the differences between the two groups.
Results
Changes of index of glycaemic control
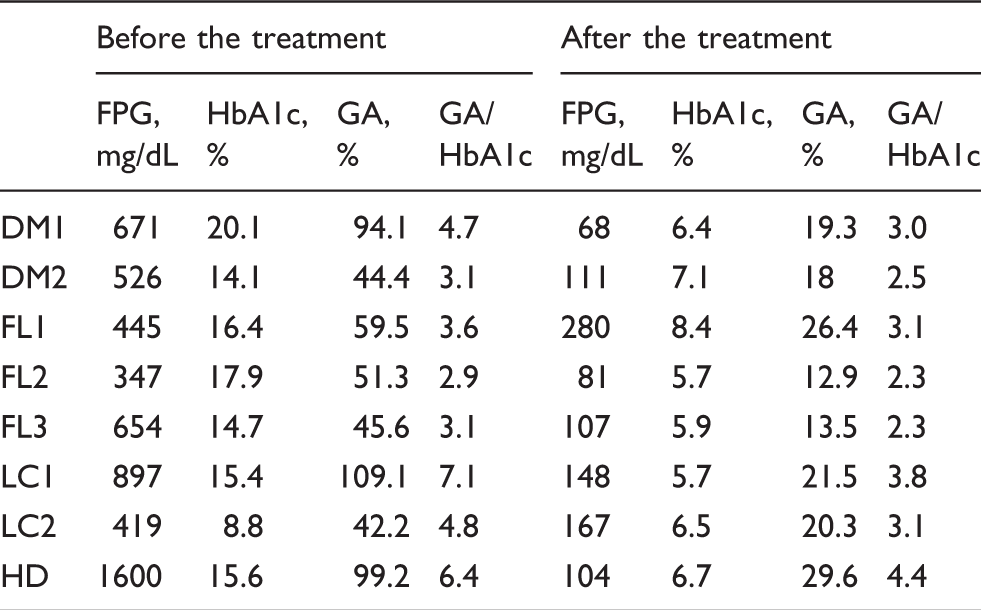
Blood glucose, GA, HbA1c and GA/HbA1c dropped after treatment. After treatment, the average GA/HbA1c ratio in diabetes and diabetes with fatty liver was 2.8 and 2.6, close to a normal ratio. However, the ratio in the diabetic patient with liver cirrhosis and the diabetic patient undergoing dialysis remained abnormally high, at 3.5 and 4.4. (Figure 1, Table 2).
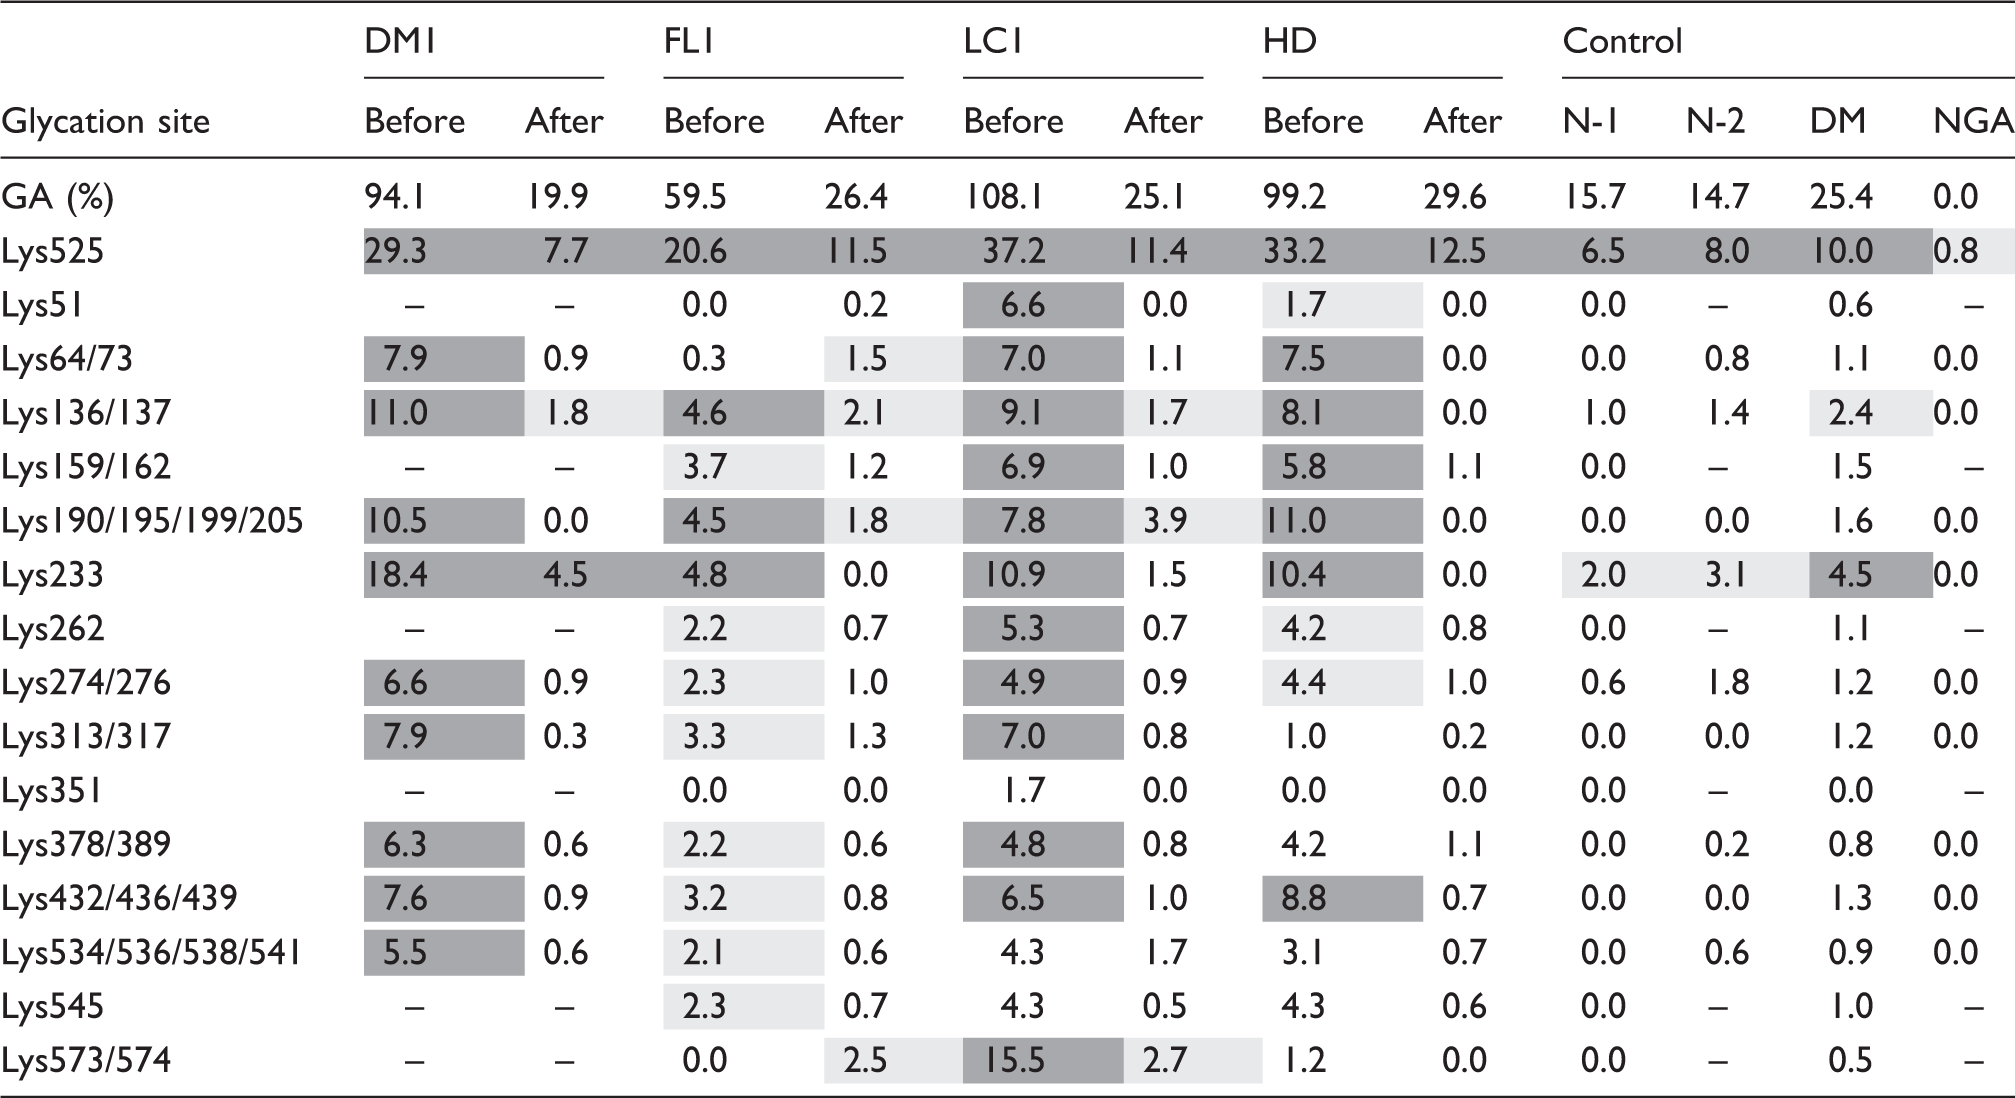
Changes in the index of glycaemic control after commencement of treatment. Change in a measurement index before and after the treatment. DM: diabetes mellitus; FL: fatty liver; LC: liver cirrhosis; HD: haemodialysis; FPG: fasting plasma glucose. Glycation ratio of each glycation sites of albumin. DM: diabetes mellitus; FL: fatty liver; LC: liver cirrhosis; HD: haemodialysis; N: non-diabetes mellitus; NGA: purified non-glycated albumin. Dark grey coloured cell: Glycation ratio is more than 5%, Grey coloured cell: Glycation ratio is 2–4%.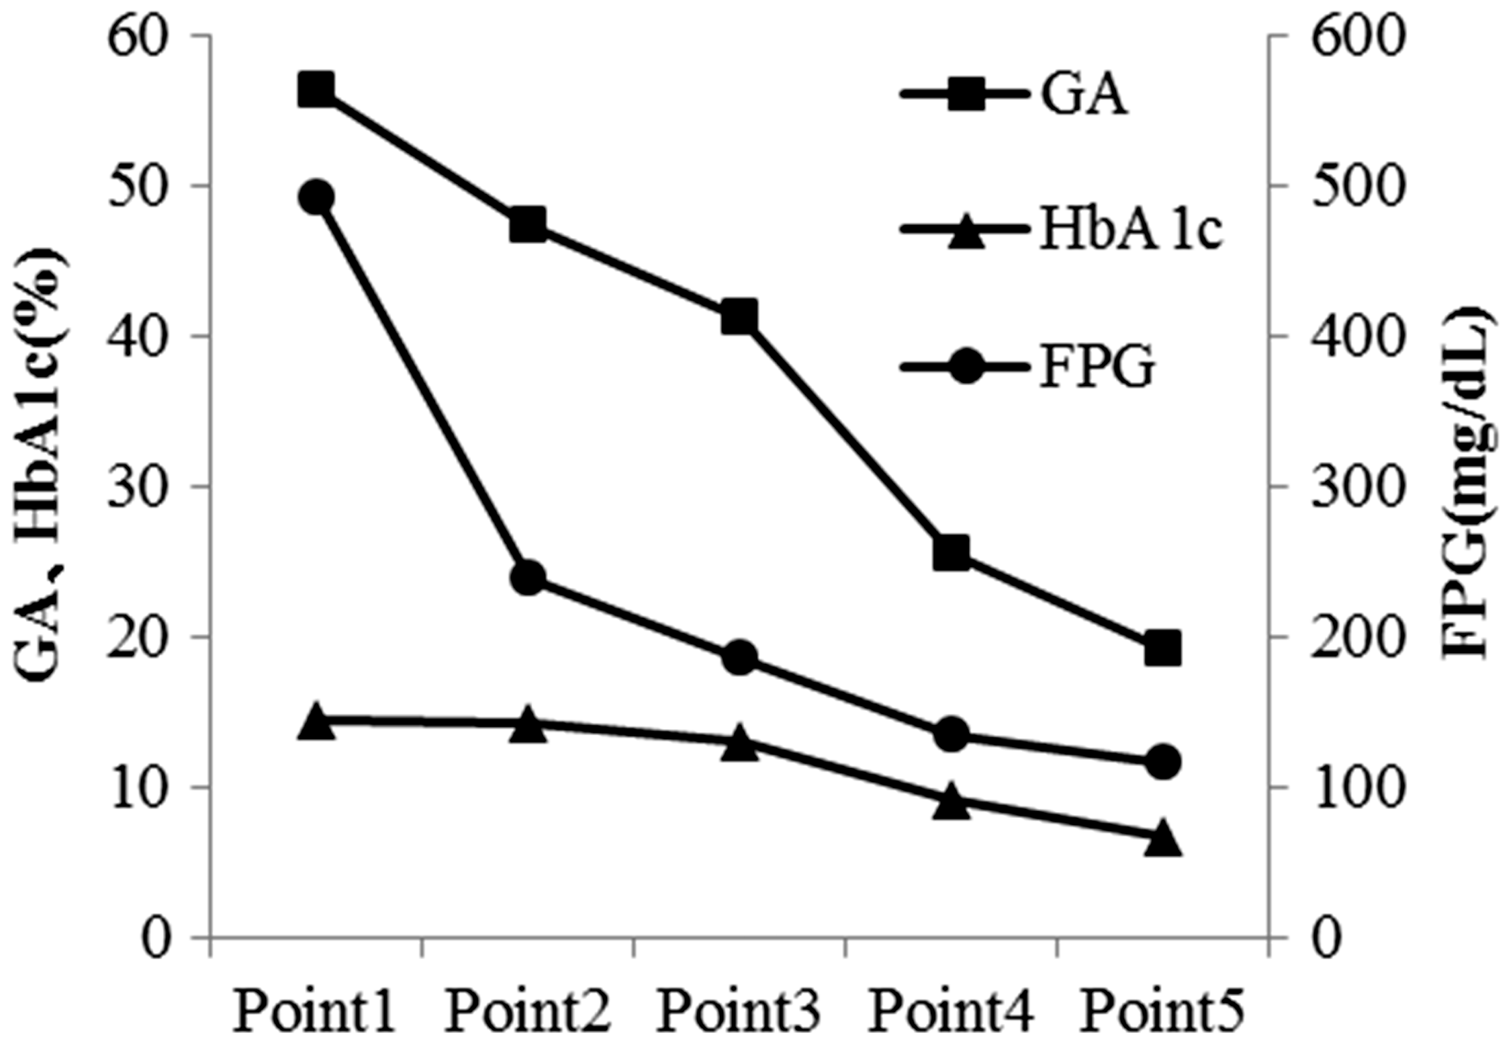
Evaluation of glycation sites within albumin
Each of the diabetic patients with and without fatty liver, liver cirrhosis and dialysis underwent an evaluation of the changes in the glycation sites before and after the treatment. As a control, serum samples from two healthy subjects and purified non-glycated albumin and a diabetic patient without complications were used.
Table 3 shows the glycation ratio of albumin glycation sites before and after the treatment. Lys525 (main glycation site in albumin), Lys64/73, Lys136/137, Lys159/162, Lys190/195/199/205, Lys233, Lys262, Lys274/276, Lys313/317, Lys378/389, Lys432/436/439, Lys534/536/538/541, Lys545 and Lys573/574 were confirmed in all patients before the treatment. After the treatment, glycation was observed on Lys525, Lys136/137, Lys190/195/199/203, Lys233 and Lys573/574.
Changes of AGE and esRAGE in diabetes treatment
The average values of AGE fluorescence intensity in albumin and pentosidine concentration before and after the diabetic treatment (except dialysis patient) were 87.8 ± 26.9 and 68.4 ± 17.4 (P < 0.01) and 0.1226 ± 0.092 and 0.0731 ± 0.0487 µg/mL (P < 0.01), and these values dropped significantly after treatment.
Figure 2(a) shows the changes in pentosidine after the commencement of the hypoglycaemic treatment in the patients. Except dialysis patient, pentosidine concentrations were decreased after the treatment. As shown in Figure 2(a), after the commencement of the treatment, pentosidine concentrations decreased but were still higher than the reference interval (0.0092–0.0431 μg/mL) in all patients. The pentosidine concentrations in diabetes patients with dialysis and liver cirrhosis were very high.
Changes in pentosidine and esRAGE concentration after the commencement of hypoglycaemic treatment. (a) pentosidine concentration (µg/mL, reference interval: 0.0092–0.0431 µg/mL), (b) esRAGE concentration (ng/mL, reference interval is 0.45 ng/mL or more).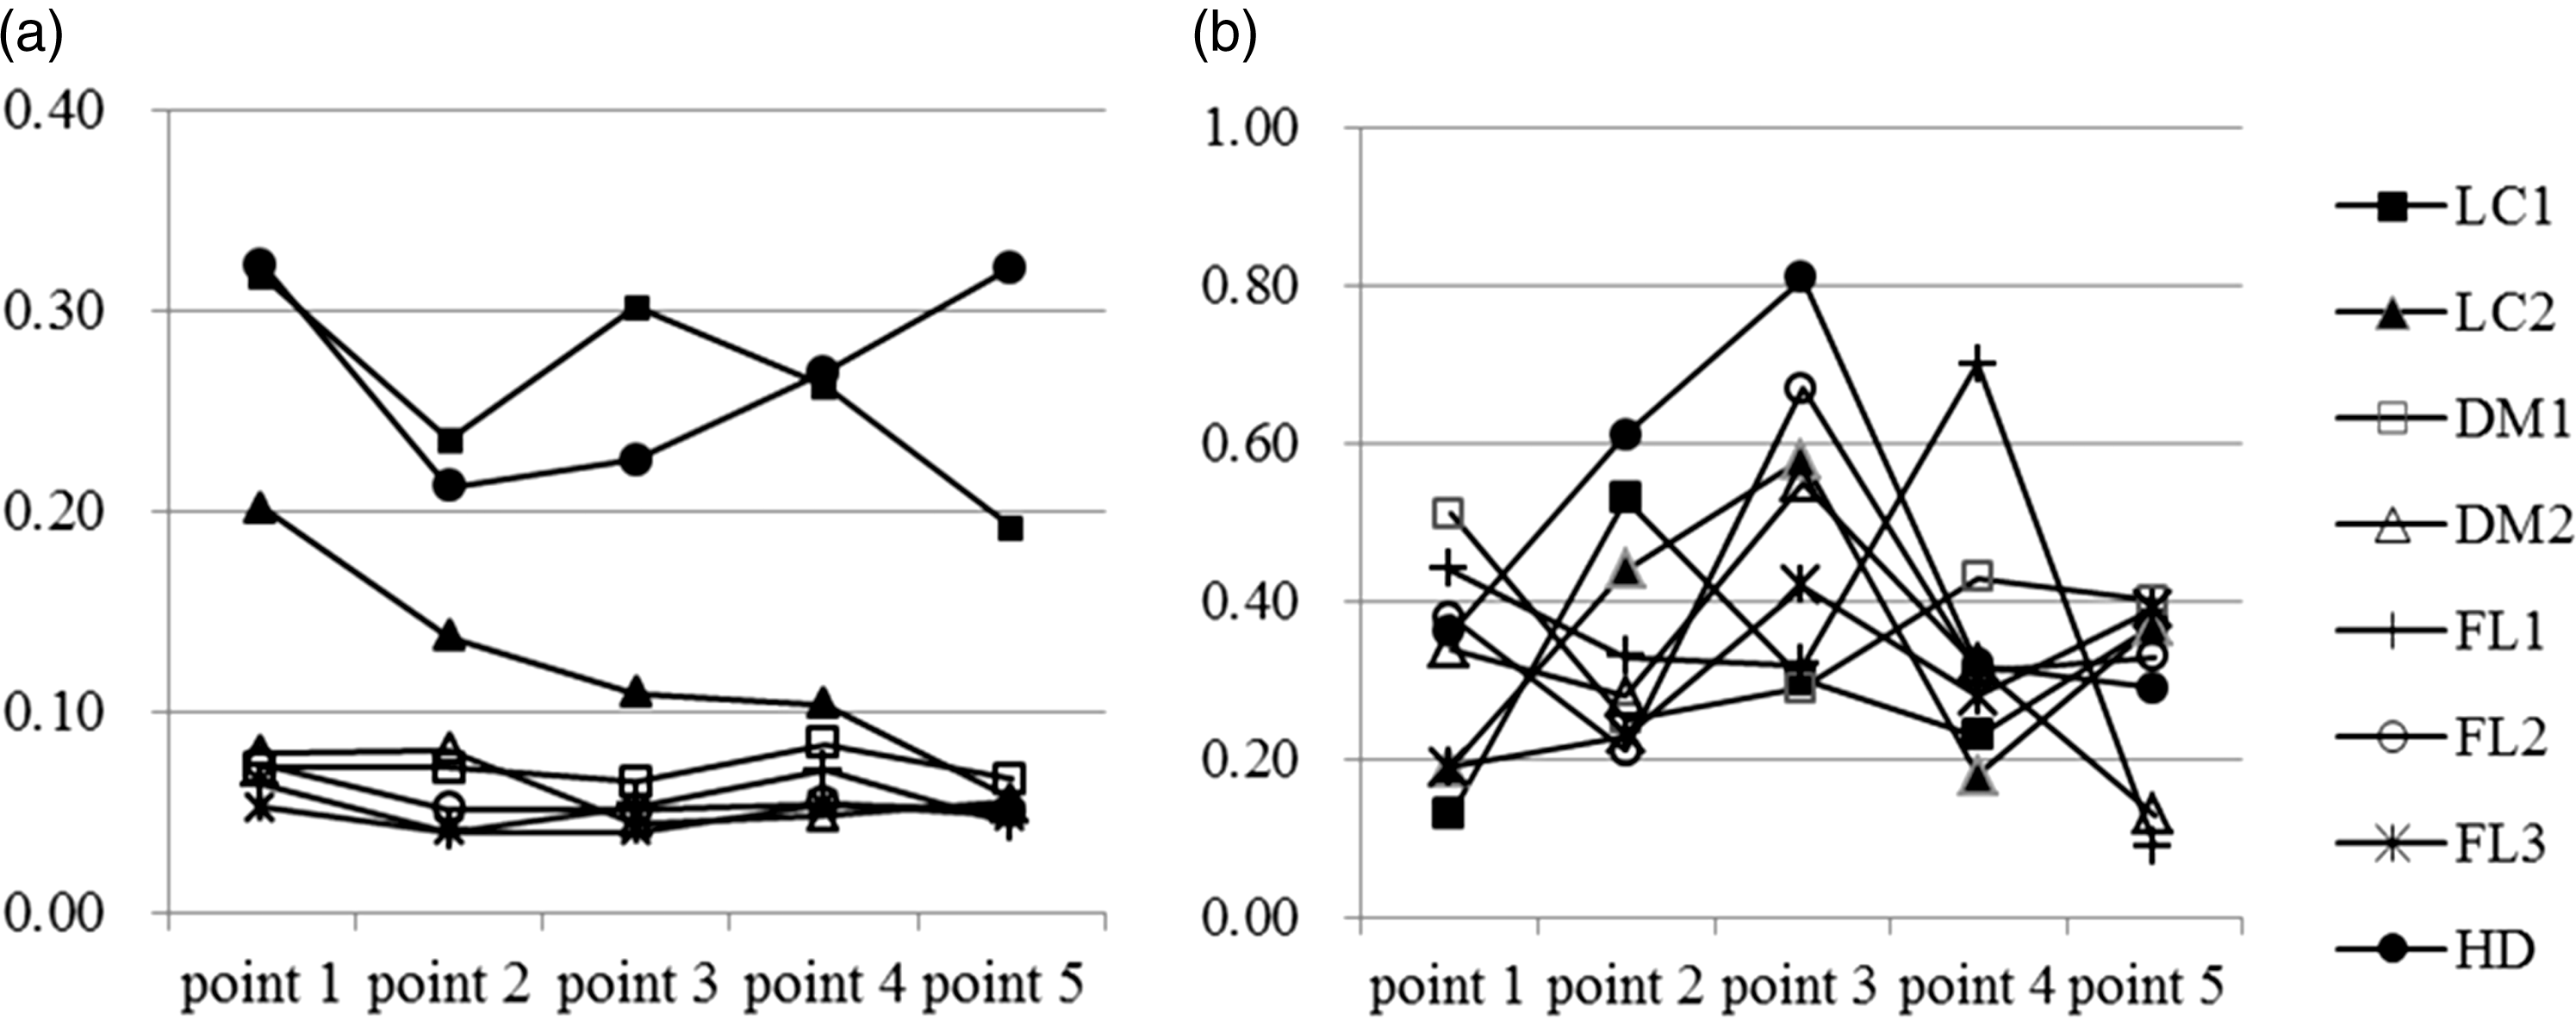
Figure 2(b) shows the changes in esRAGE after the commencement of the hypoglycaemic treatment. EsRAGE scarcely changed between before and after the treatment, at 0.31 ± 0.13 and 0.30 ± 0.12 ng/mL, respectively. Many of these cases represented lower values than the lower limit of the reference interval of 0.45 ng/mL.
Discussion
In this study, we analysed the relationship between diabetes treatment, and GA, AGE and esRAGE in patients with abnormally high GA levels, including with and without fatty liver, liver cirrhosis and dialysis. The following three results were obtained.
As the GA levels dropped, albumin glycation sites decreased. As the GA levels dropped, AGE fluorescence in albumin and pentosidine concentrations (except in dialysed patients) decreased. However, pentosidine concentrations were higher than the reference interval even after the treatment. The esRAGE concentrations before treatment did not differ from those after treatment. The esRAGE concentrations were lower than the reference interval.
Treatment and changes of blood glucose index
Both GA and HbA1c levels dropped as the glycaemic control normalized after the treatment. GA/HbA1c also dropped. However, it was higher in diabetic patients with liver cirrhosis and dialysis than in diabetic patients without complications and diabetic patients with fatty liver. Renal anaemia or the use of erythropoietin results in low HbA1c concentrations in diabetic patients with dialysis. 18 In the case of diabetic patients with liver cirrhosis, HbA1c concentrations would decline due to the facilitation of splenic function which decreases red cell survival and also GA levels would rise due to the prolonged albumin metabolism. 19 In other words, using GA for the glycaemic control may be desirable in dialysed patients. 18 In liver cirrhosis patients, attention needs to be paid to a tendency toward higher GA levels.
Albumin glycation sites
We reported that many sites of albumin in diabetic patients with high blood glucose and GA levels are glycated and that glycation sites decrease as the normalization of glycaemic control status. 15 Based on the present results, glycation was observed after treatment in domains IIB and IIIA in albumin, such as Lys525, Lys136/137, Lys190/195/199/205, Lys233 and Lys573/574.
These glycation sites were found almost similar in diabetic patients without complications, with fatty liver, with liver cirrhosis and with dialysis. When blood glucose and GA levels were high, glycation was observed in all regions including, in addition to the above, domain IA and domain IIIB such as Lys64/73, Lys159/162, Lys262, Lys274/276, Lys313/317, Lys378/389, Lys432/436/439, Lys534/536/538/541 and Lys545. The glycation sites are shown in Figure 3.
Steric structure and glycation sites of albumin (used the data of Protein Data Bank Japan, PDBj).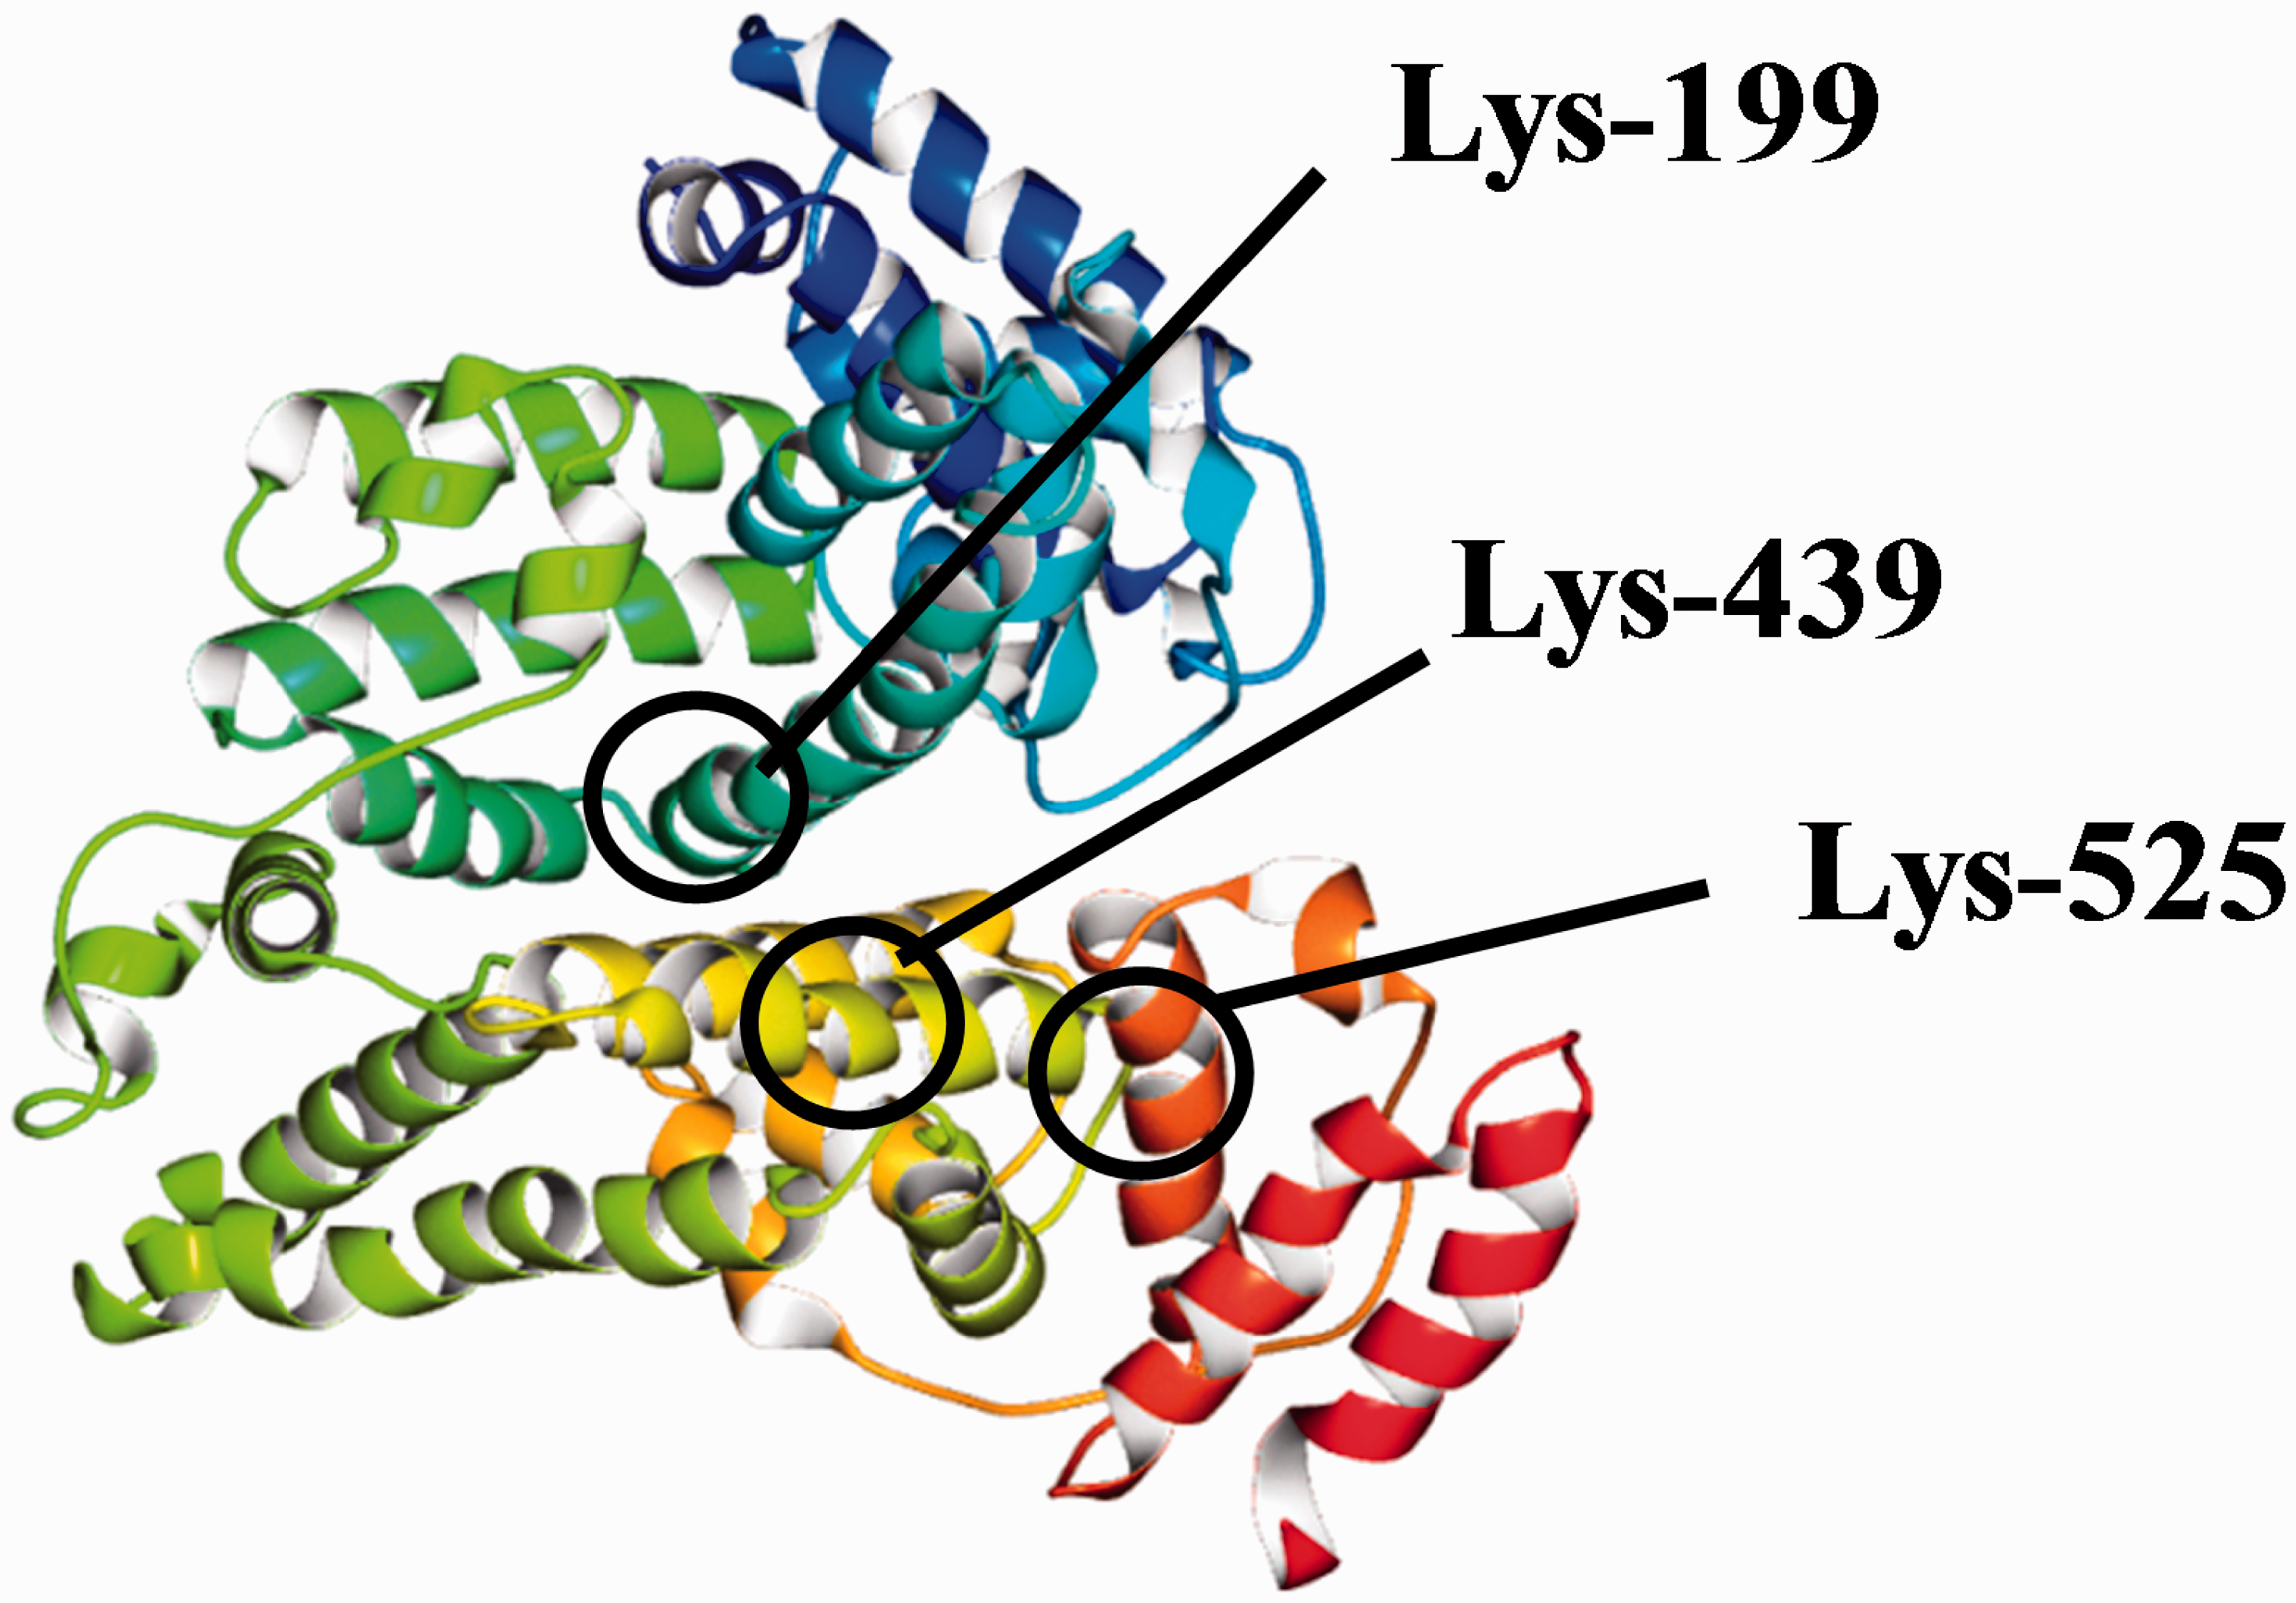
Based on Figure 3, in the case of the patients with good glycaemic control, glycation sites were found in domains IIB and IIIA of albumin, namely the cemter part of the albumin structure, and on the other hand, in the patients with poor glycaemic control, glycation sites expanded over the entire area around the albumin structure that includes domain IA and domain IIIB.
Garlick et al. 20 reported that the main glycation site of albumin is Lys525. Iberg and Flückiger 21 analysed the glycation sites of albumin in diabetic patients with poor glycaemic control and reported that the main glycation site of albumin is Lys525 and accounts for nearly 33% of all glycations, and that glycation sites in albumin include Lys525, Lys199, Lys281 and Lys439 as well as some candidates for glycation sites (Lys233, Lys317, Lys351, Lys12, and Lys534). Our results were similar with the results of a study by Iberg and Flückiger to a great extent, with the exception of Lys12 and Lys281.
Barnaby et al. 22 evaluated the glycation sites by artificially glycated albumin and reported that glycation would occur in Lys93, Lys199, Lys276, Lys281, Lys286, Lys414, Lys439, Lys525, N terminal, Arg98, Arg428, Arg197 and Arg521. Our measurement results and theirs agree with each other in Lys525, Lys199 and Lys439, which are considered to be the main glycation sites of albumin. On the other hand, the results do not agree in many other glycation sites. This may be because of the differences between an albumin analysis separated from hyperglycaemic patients and the stimulation of the reaction of albumin and glucose in artificial conditions. In addition, Barnaby et al. 22 state that 520-534, albumin, were glycosylated first, before the highest concentrations of modification were found in regions 196–209, 278–294 and 414–442 of HSA. They conclude: the glycation pattern of HSA was found to vary with different levels of total glycation and included modifications at the two major drug binding sites on this protein. 22 Compared with our results, the part ‘included modifications at the two major drug binding sites on this protein’ in the above quote may also be evidenced since all four sites were shown to have been glycated before the treatment.
AGE and esRAGE
In this study, AGE florescence and blood pentosidine (except dialysed patients) in albumin declined as blood glucose concentrations dropped in diabetes treatment. The blood pentosidine concentrations were very high in liver cirrhosis patients and dialysed patients before the treatment and did not change between before and after the treatment in dialysed patients. This fact suggests the possibility that oxidative stress23,24 is very strong in patients with liver cirrhosis and dialysis, which may promote a glycation reaction and AGE formation reaction. The metabolism of albumin is prolonged in patients with liver cirrhosis and, as a consequence, glucose and albumin come into contact with each other for a longer time, making it easier for AGE to form. 19 In patients with dialysis, carbonyl stress in long-term uraemic complications separately and strongly stimulates the AGE formulation reaction. 25 Hypoglycaemic treatment alone may not have been sufficient to decrease pentosidine. In addition, the present study showed that, even after the treatment, blood pentosidine concentrations were higher than the reference interval in all patients. This may be because AGE involves a greater delay in blood clearance than glycation albumin does and keeping GA levels normal may be important for reducing the risk of complications.
In the present study, the esRAGE concentrations scarcely changed between before and after the treatment and were lower than the reference interval. Since the pentosidine concentrations were higher than the reference interval in all patients, the esRAGE concentrations, acting as a decoy of AGE, were low. This fact also suggests the importance of keeping GA levels normal.
Considering these facts leads to the estimation that an elevation of the blood glucose concentration increases GA and glycation sites in albumin, changes albumin function, and then increases AGE and decreases esRAGE. In the present study, the GA levels dropped while pentosidine concentrations dropped but were above the reference interval, and the esRAGE concentrations scarcely changed and were lower than the reference interval. The values may improve in the order of GA, pentosidine and esRAGE. Using GA generated in an initial stage of glycation reaction to confirm the normalization of blood glucose in diabetic patients may lead to the prevention of the elevation of AGE and the decline of esRAGE concentrations and ultimately lead to a reduction of the risk for the microvascular complications and macrovascular complications.
Limitation
The small number of participants with different treatment methods and the short-term follow-up of three to four months that may not enough to observe change of the AGE and esRAGE would be limitation of this study. The measurement of glycation sites were not accurate quantitative analysis due to the lack of each standard glycated and non-glycated peptides. To get more firm evidence, we need large number and long-term follow-up study with quantitative measurement of glycation sites.
Conclusions
In diabetic patients with high blood glucose concentrations, the glycation reaction of albumin advanced, GA levels were high, and many lysines were glycated, irrespective of diabetic patients with fatty liver, liver cirrhosis and dialysis. In addition, AGE concentrations were high and esRAGE concentrations were low. Hypoglycaemic treatment reduced GA levels and glycation sites of albumin. AGE concentrations dropped but were above the reference interval, while esRAGE concentrations scarcely changed and remained low. These facts suggest that using glycated albumin, generated in the initial stage of glycation reaction, to control blood glucose concentrations may be useful to prevent the formation of AGE and inhibit the occurrence and progression of diabetes complications.
Footnotes
Acknowledgments
We would like to express our appreciation to Asahi Kasei Pharma for the detection of albumin glycation sites.
Declaration of conflicting interests
TK is an employee of Asahi Kasei Pharma Co., Ltd.
Funding
The author(s) received no financial support for the research, authorship, and/or publication of this article.
Ethical approval
The Ethics Committee of Daisan Hospital, Jikei University School of Medicine.
Guarantor
TK.
Contributorship
HM, AO designed the study, conducted the study, recruited study subjects and collected data. TK measured the glycation sites of albumin. HM and TK wrote the first version of manuscript. All authors reviewed the manuscript and contributed to the discussion.