
Abstract
Background
Reference change values provide objective tools to assess the significance of a change in two consecutive results of a biomarker from an individual. However, in practice, more results are usually available and using the reference change value concept on more than two results will increase the number of false positive results.
Methods
A computer simulation model was developed using Excel. Based on 10,000 simulated measurements among healthy individuals, a series of up to 20 results of a biomarker from each individual was generated using different values for the within-subject biological variation plus the analytical variation. Each new result in this series was compared to the initial result. These successive serial differences were computed to give limits for significant bidirectional changes with constant cumulated maximum probabilities of 95% (p < 0.05) and 99% (p < 0.01).
Results
From an individual factors used to multiply the first result were calculated to create limits for constant cumulated significant changes. The factors were shown to become a function of the number of results included and the total coefficient of variation.
Conclusions
The first result should be multiplied by the appropriate factors for increase and decrease to give the limits for a significant bidirectional change in several consecutive measurements.
Keywords
Introduction
A method to calculate the significance of change in serial results was introduced by Harris and Yasaka.
1
The basis for this method in monitoring serial results from an individual is that, for a change to be significant, the difference in two consecutive results must exceed the inherent variation, originally termed the critical difference but now more often the reference change value (RCV). However, before any RCV calculation, further major decisions have to be made. If the clinical decision-making is based on either a significant decrease or increase, then the RCV is unidirectional (one-tailed). A bidirectional change for the RCV calculation is used when both increases and decreases of results are being considered (two-tailed). In clinical practice, bidirectional change commonly needs to be considered. Then, the probability of detecting changes has to be decided, and thereby also how many false positive results should be accepted. Usually, 95% probability (p < 0.05) is regarded as significant and 99% probability (p < 0.01) as highly significant.
2
In consequence, generally 1.96 and 2.58 are the appropriate Z-scores to use for these RCV significance calculations. All laboratories know the random analytical variation (CVA) of each of their analyses from internal quality control activities. Data on the within-subject biological variation (CVI) are available for many quantities.
3
The total coefficient of variation (CVT,) can be calculated from estimates of CVA and CVI [
The aim of this study was to apply the simulation model to calculate limits for significant bidirectional changes in two or more serial results with constant cumulated probabilities of both 95% (p < 0.05) and 99% (p < 0.01). The calculations were based on both normal and ln-normal computer simulated data from ‘healthy individuals’.
Materials and methods
All data for the simulations were generated using Microsoft Excel version 2010.
The method has been described in detail in a previous publication associated with significant unidirectional changes in serial results. 9 Briefly, the method is described here with the modifications associated with significant bidirectional changes in serial results.
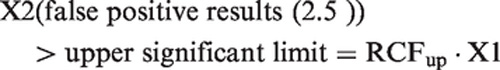
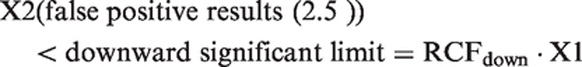
Reference change up factor (RCFup) is defined as a factor to multiply first results by when calculating the upper limit for a significant increment in concentration. When two consecutive results, X1 and X2, are considered an increase in concentration is significant if X2 > RCFup · X1. Similarly, reference change down factor (RCFdown) factor is defined as a factor to multiply first result by when calculating the downward limit for a significant decrement in concentration. A decrease in concentration is considered significant if X2 < RCFdown · X1. The RCFup and RCFdown factors were determined based on 10,000 simulated normally distributed results and 10,000 ln-normally distributed results. The RCF factors were calculated for different sets of results (consisting of 2, 3, 4, 5, 6, 7, 8, 9, 10, 15 and 20 serial results) and for different percentages of CVT (10.0, 20.0, 30.0 and 40.0%). When significant limits for bidirectional changes are calculated with a probability of 95% (p < 0.05), the total false positive rate is 5%. In bidirectional changes, both significant increases and decreases are considered, i.e. 2.5% false positive > upper significant limit plus 2.5% false positive < downward significant limit. The RCFup factor was then determined when 2.5% of the tested sets were recorded as having a significant increase at a bidirectional probability of 95%, i.e. when
Results
RCFup a factors for calculating the upper limits for a significant increase at constant cumulated bidirectional probabilities of 95 and 99% for both normal and ln-normal distributions.
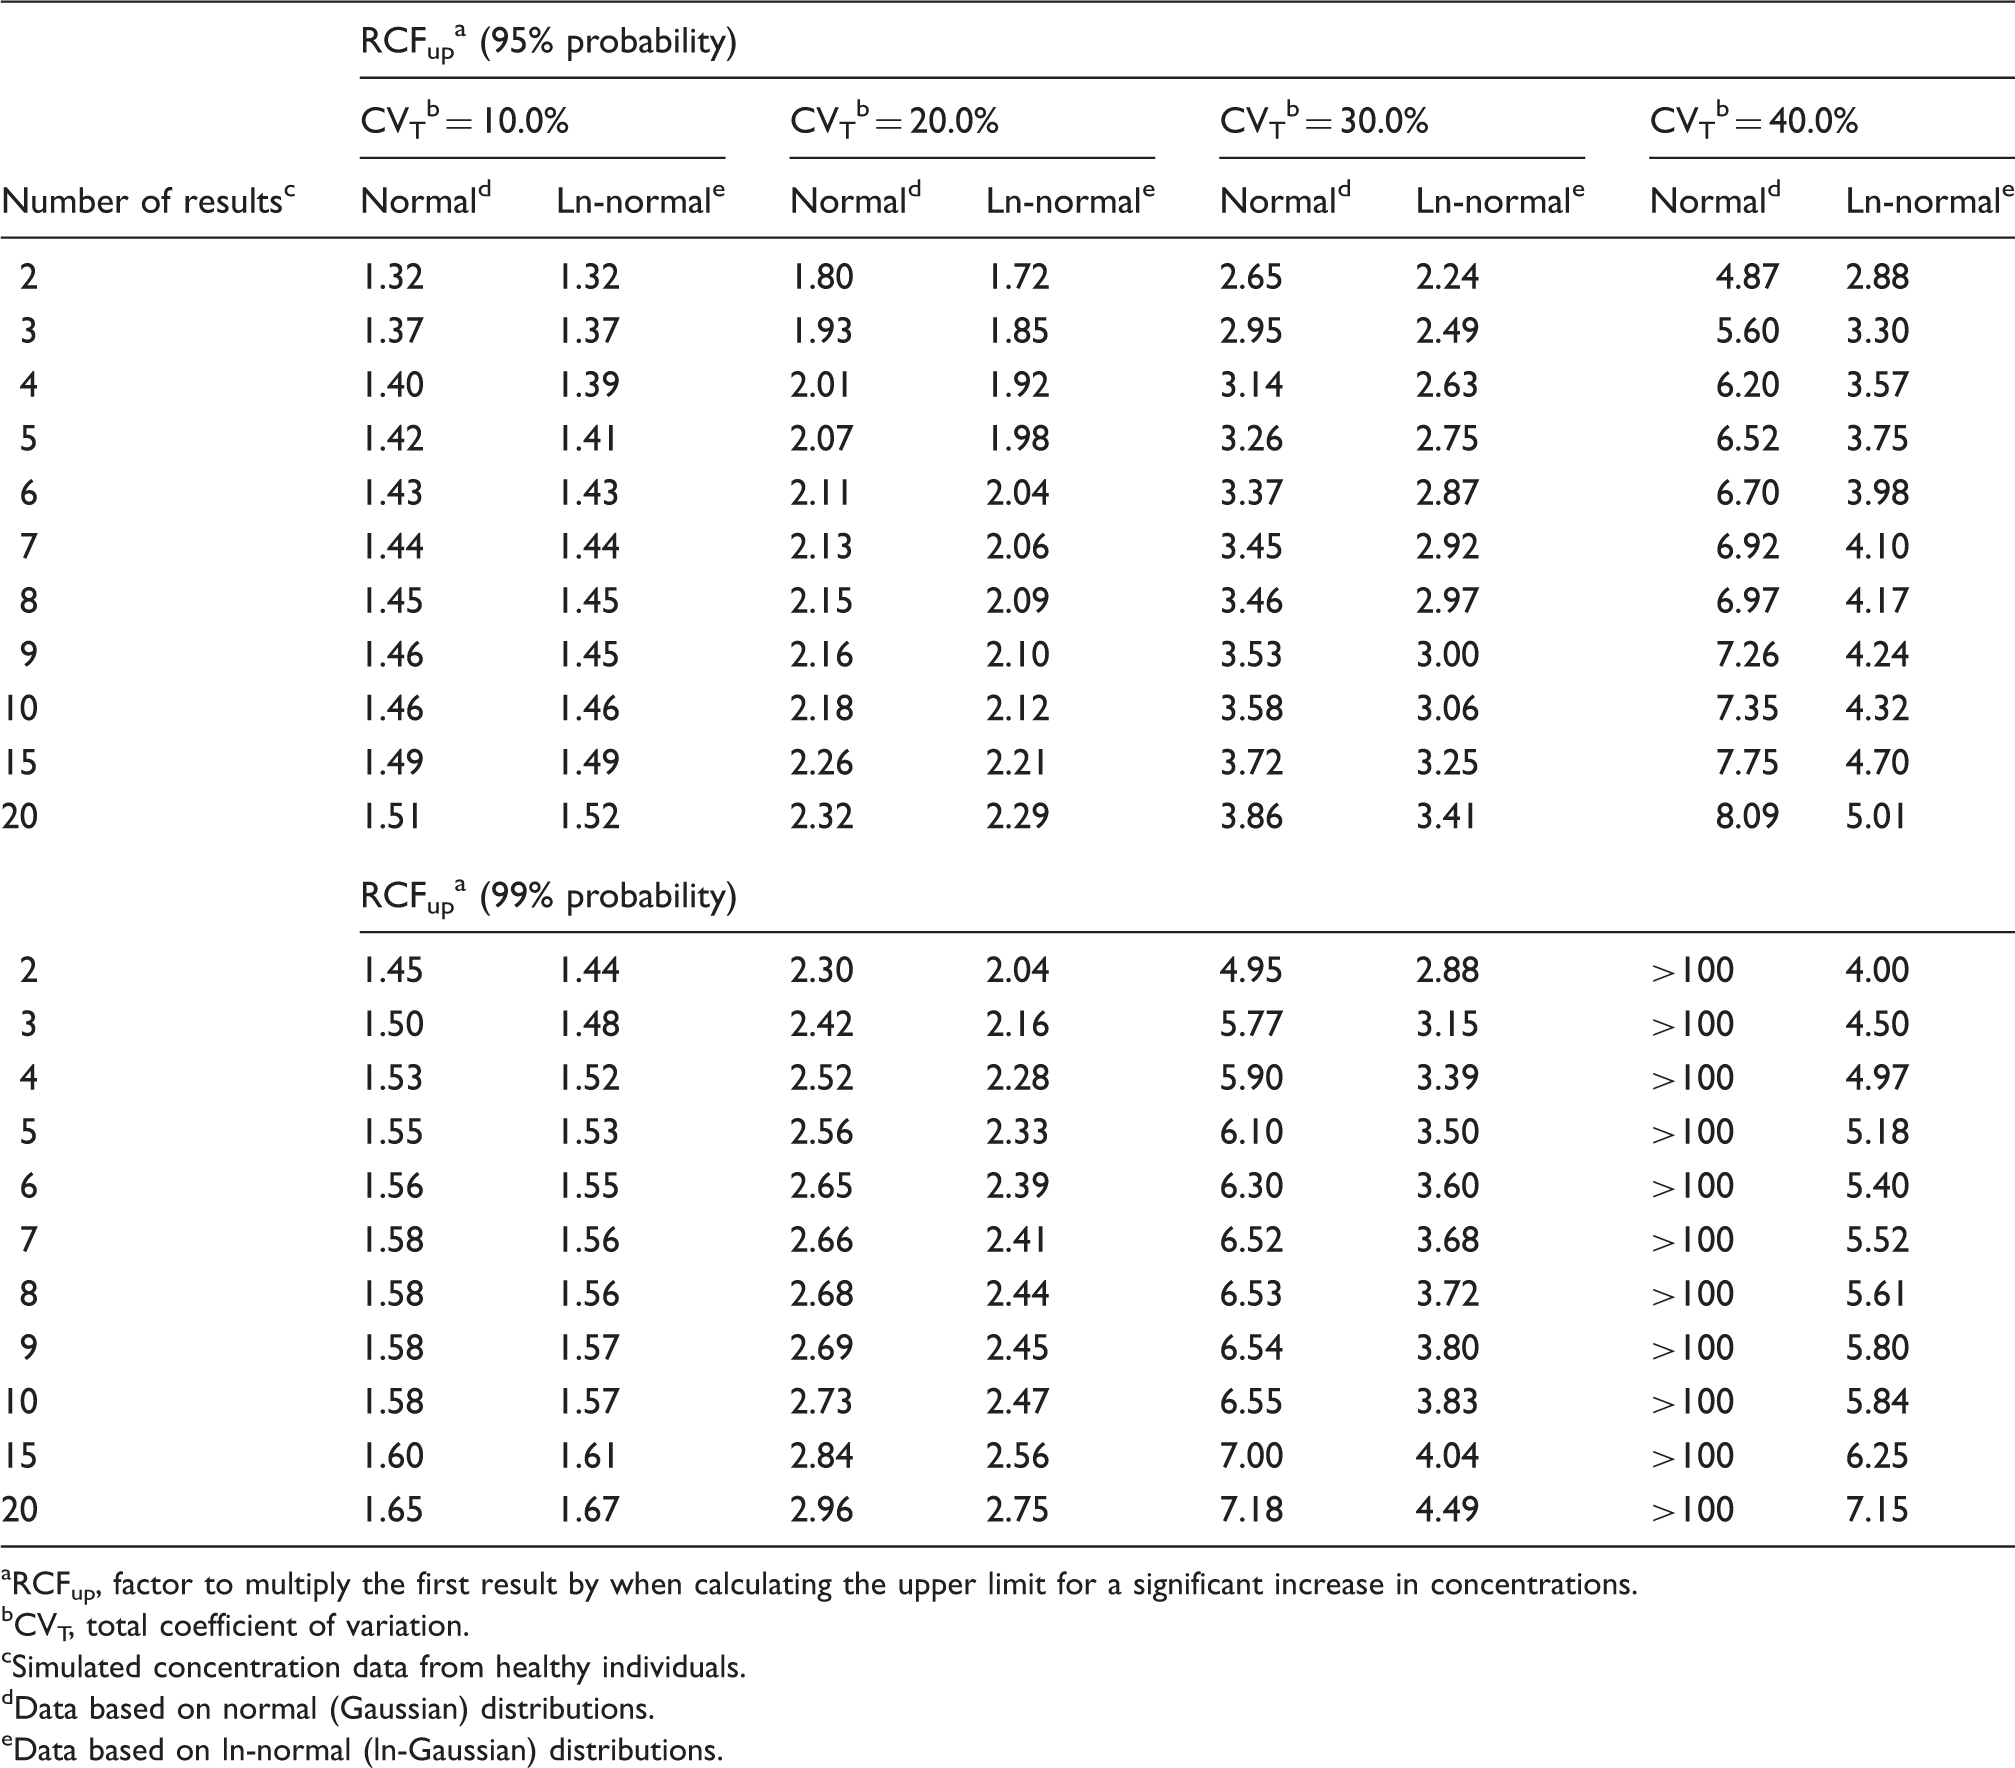
RCFup, factor to multiply the first result by when calculating the upper limit for a significant increase in concentrations.
CVT, total coefficient of variation.
Simulated concentration data from healthy individuals.
Data based on normal (Gaussian) distributions.
Data based on ln-normal (ln-Gaussian) distributions.
RCFdown a factors for calculating the downward limits for a significant decrement with constant cumulated bidirectional probabilities of 95 and 99% for both normal and ln-normal distributions.
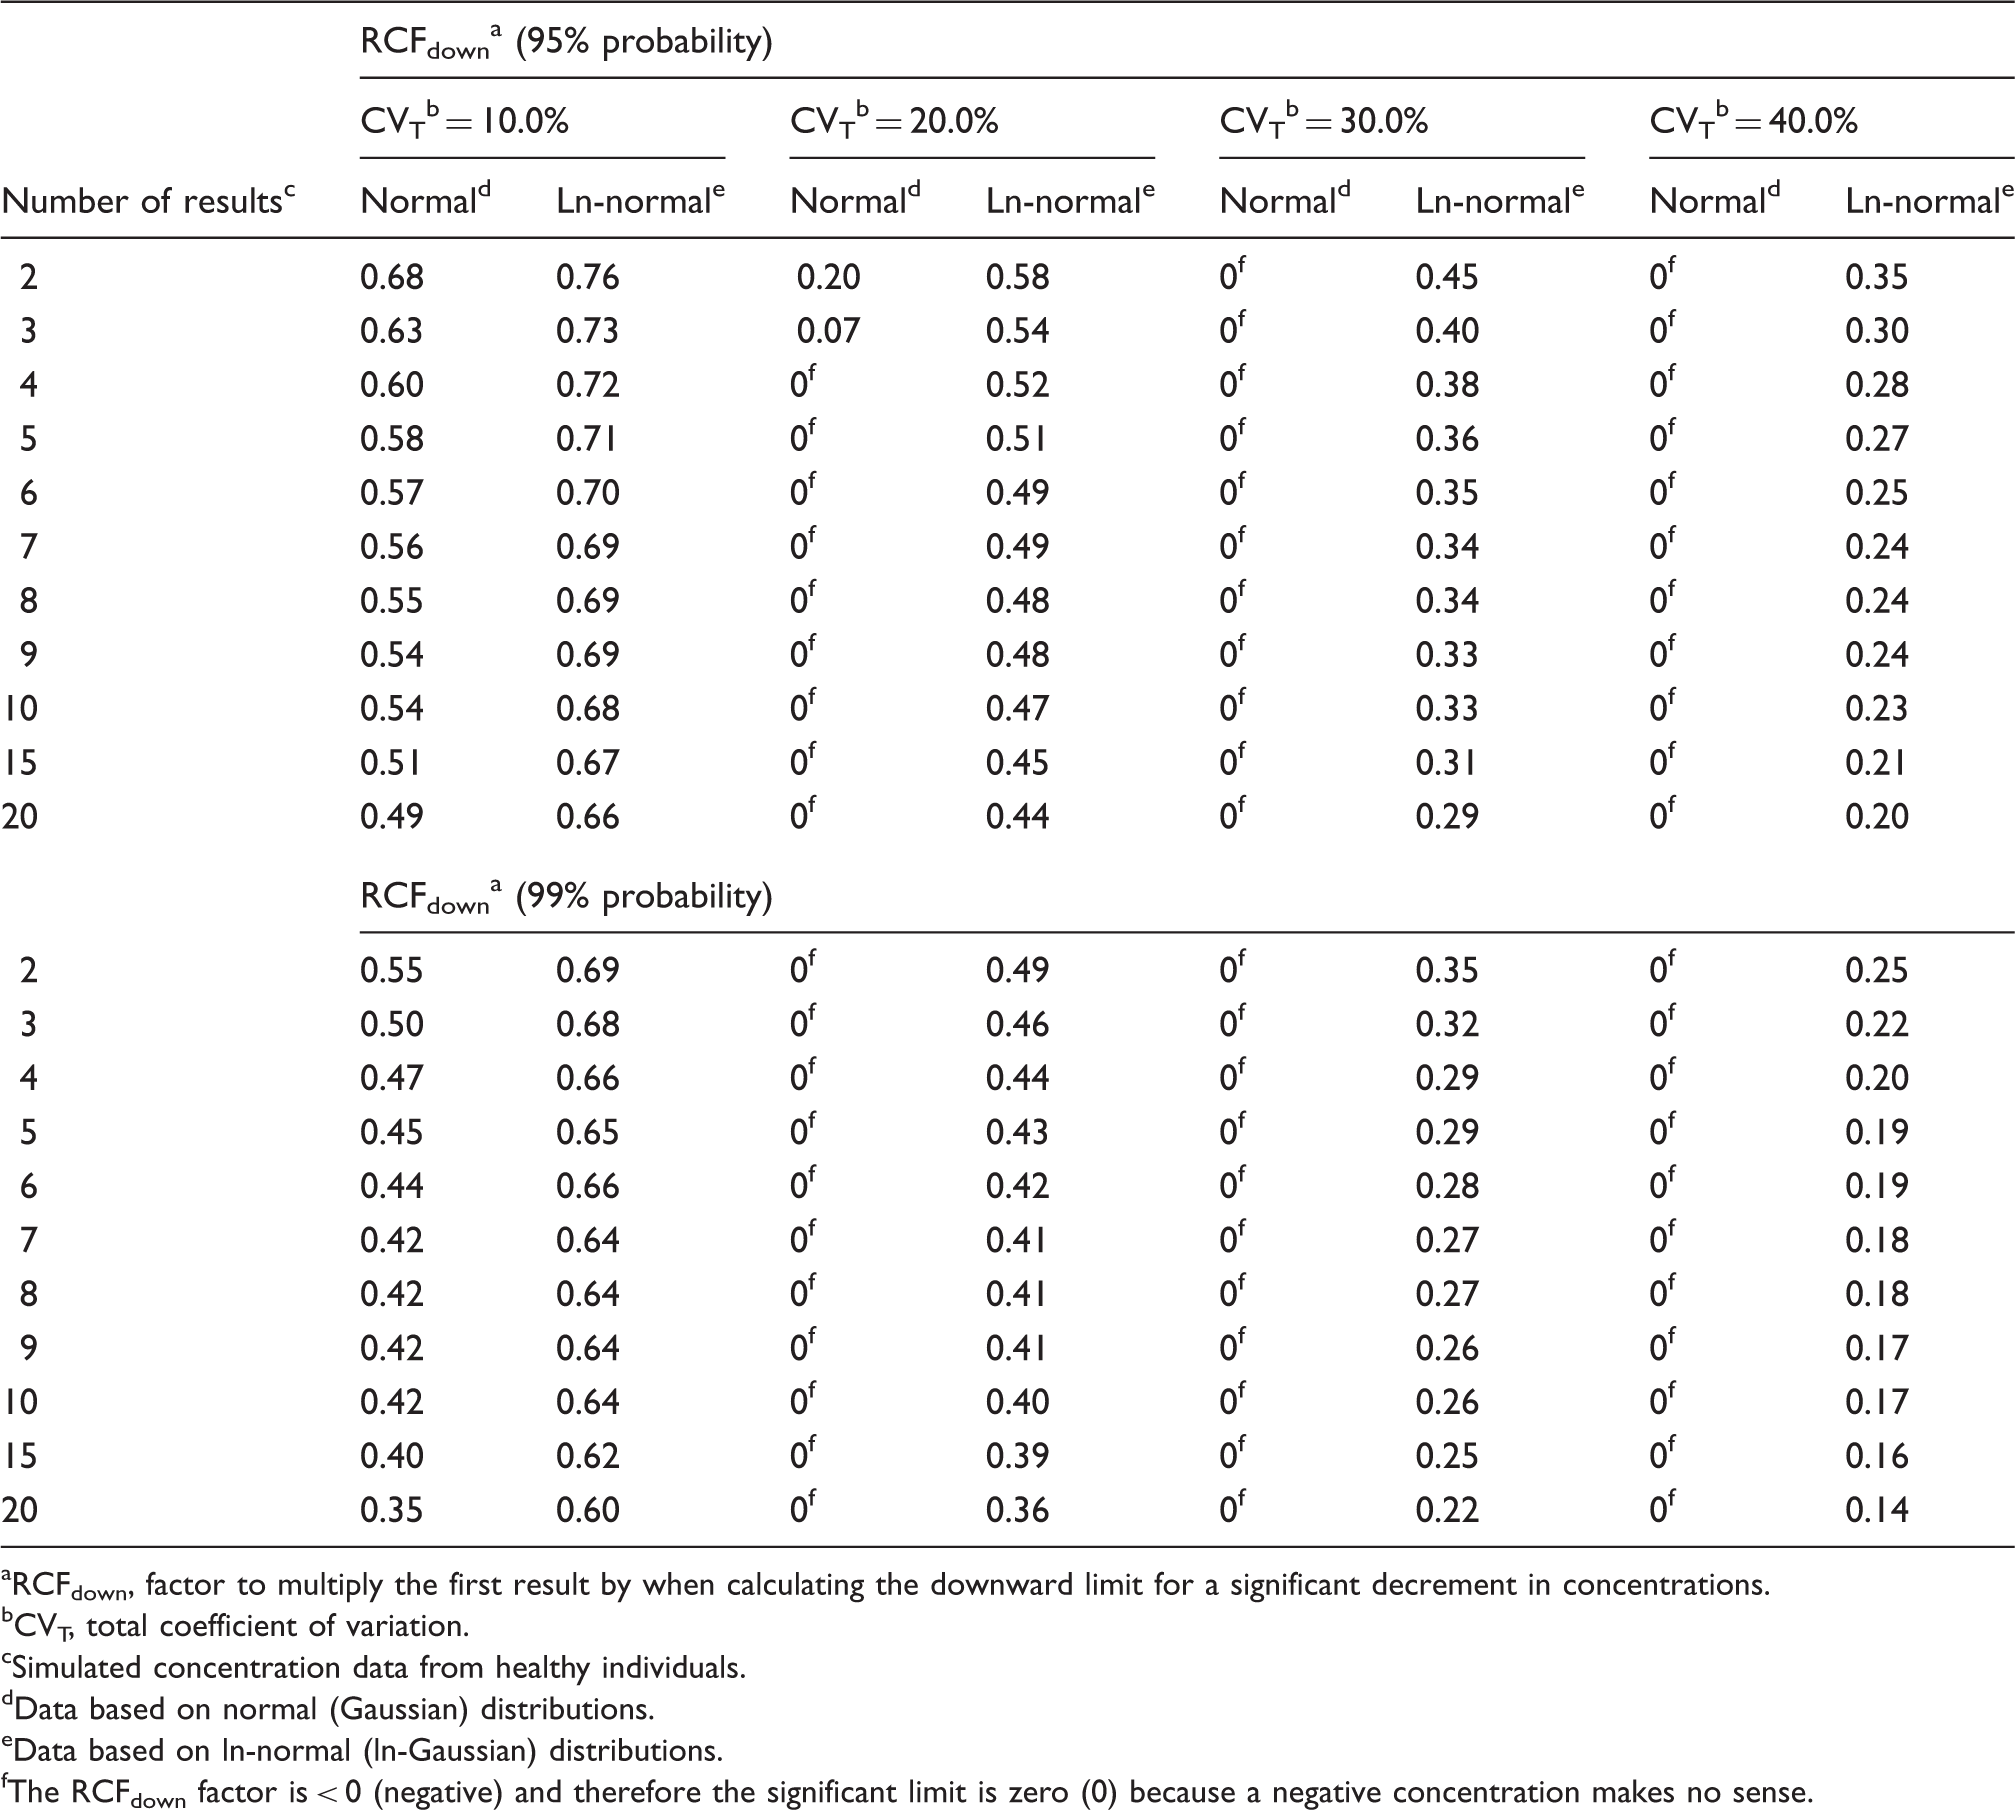
RCFdown, factor to multiply the first result by when calculating the downward limit for a significant decrement in concentrations.
CVT, total coefficient of variation.
Simulated concentration data from healthy individuals.
Data based on normal (Gaussian) distributions.
Data based on ln-normal (ln-Gaussian) distributions.
The RCFdown factor is < 0 (negative) and therefore the significant limit is zero (0) because a negative concentration makes no sense.
Zn-scores a appropriate for the number of serial results (n) at probabilities of 95 and 99% for ln-normal distributions.
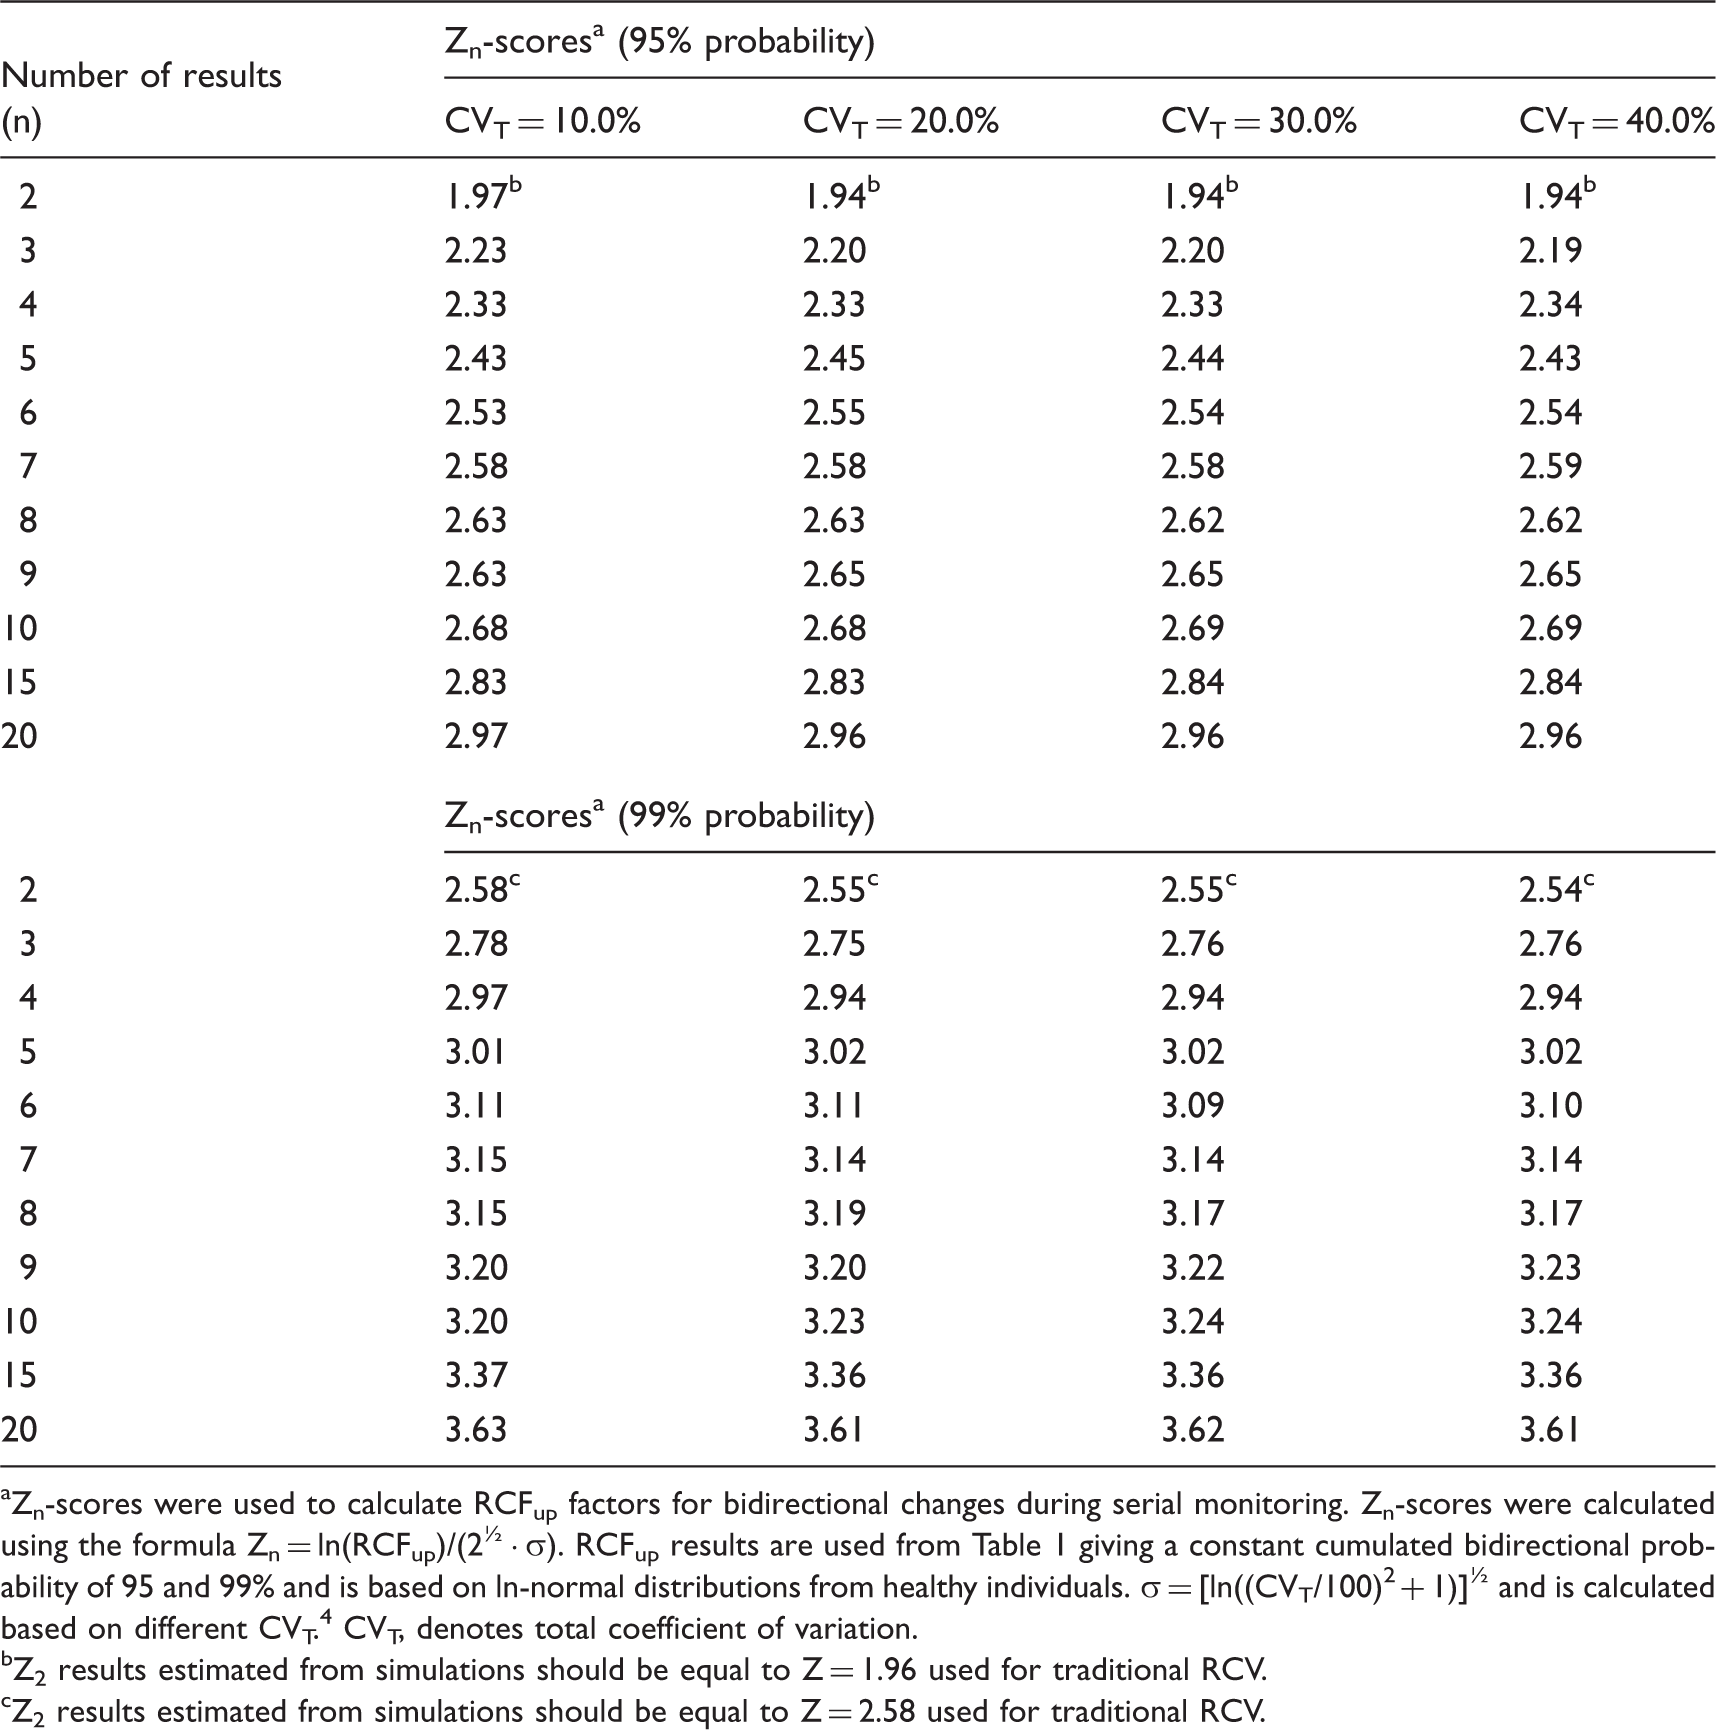
Zn-scores were used to calculate RCFup factors for bidirectional changes during serial monitoring. Zn-scores were calculated using the formula Zn = ln(RCFup)/(2½ · σ). RCFup results are used from Table 1 giving a constant cumulated bidirectional probability of 95 and 99% and is based on ln-normal distributions from healthy individuals. σ = [ln((CVT/100)2 + 1)]½ and is calculated based on different CVT. 4 CVT, denotes total coefficient of variation.
Z2 results estimated from simulations should be equal to Z = 1.96 used for traditional RCV.
Z2 results estimated from simulations should be equal to Z = 2.58 used for traditional RCV.
Discussion
As also previously found 9 we have shown that the practical use of traditional RCV calculations applied on normally distributed data will produce too many false positive results especially for high values of CVT, compared to theoretical RCV calculations. On the other hand, the calculated RCFup factors are comparable for both normal and ln-normal distributions up to CVT = 20.0% (Table 1), but not for RCFdown factors (Table 2). At higher CVT, the significant upper limit calculated using the RCFup factors for normal distributions will exceed those determined using the RCFup factors for ln-normal distributions. In the same way, RCFdown factors for normal distributions are always smaller than the corresponding RCFdown factors for ln-normal distributions. Accordingly, the ranges of limits for significant changes (up and down) are all wider for normal distributions as compared with ln-normal distributions (Tables 1 and 2). Table 2 shows that RCFdown values are negative (<0) for CVT = 20% and more than three results and up to CVT = 40.0% for normal distributions and, therefore, these decrease limits are zero because negative concentrations are impossible. Consequently, we propose that all calculations of limits for significant changes should be based on ln-normal distributions. Compared with traditional RCV calculation [RCV = (Z · 2½ · CVT)], the proposed significance calculations based on ln-normal distributions are not more complicated. The only difference of variables compared with traditional RCV calculations is the Zn-score obtained from Table 3 for more than two serial results.
In this study we have used the simulation model on bidirectional changes. Recently we have also examined the model on unidirectional differences. 9 In both of our studies, bidirectional and unidirectional, we have used probabilities of 95% (p < 0.05) and 99% (p < 0.01). Consequently, all the calculated ranges of limits for significant changes (up and down) are wider for bidirectional changes compared with unidirectional differences.
An example of calculation of limits for significant bidirectional changes for up to six ln-normally distributed serial results
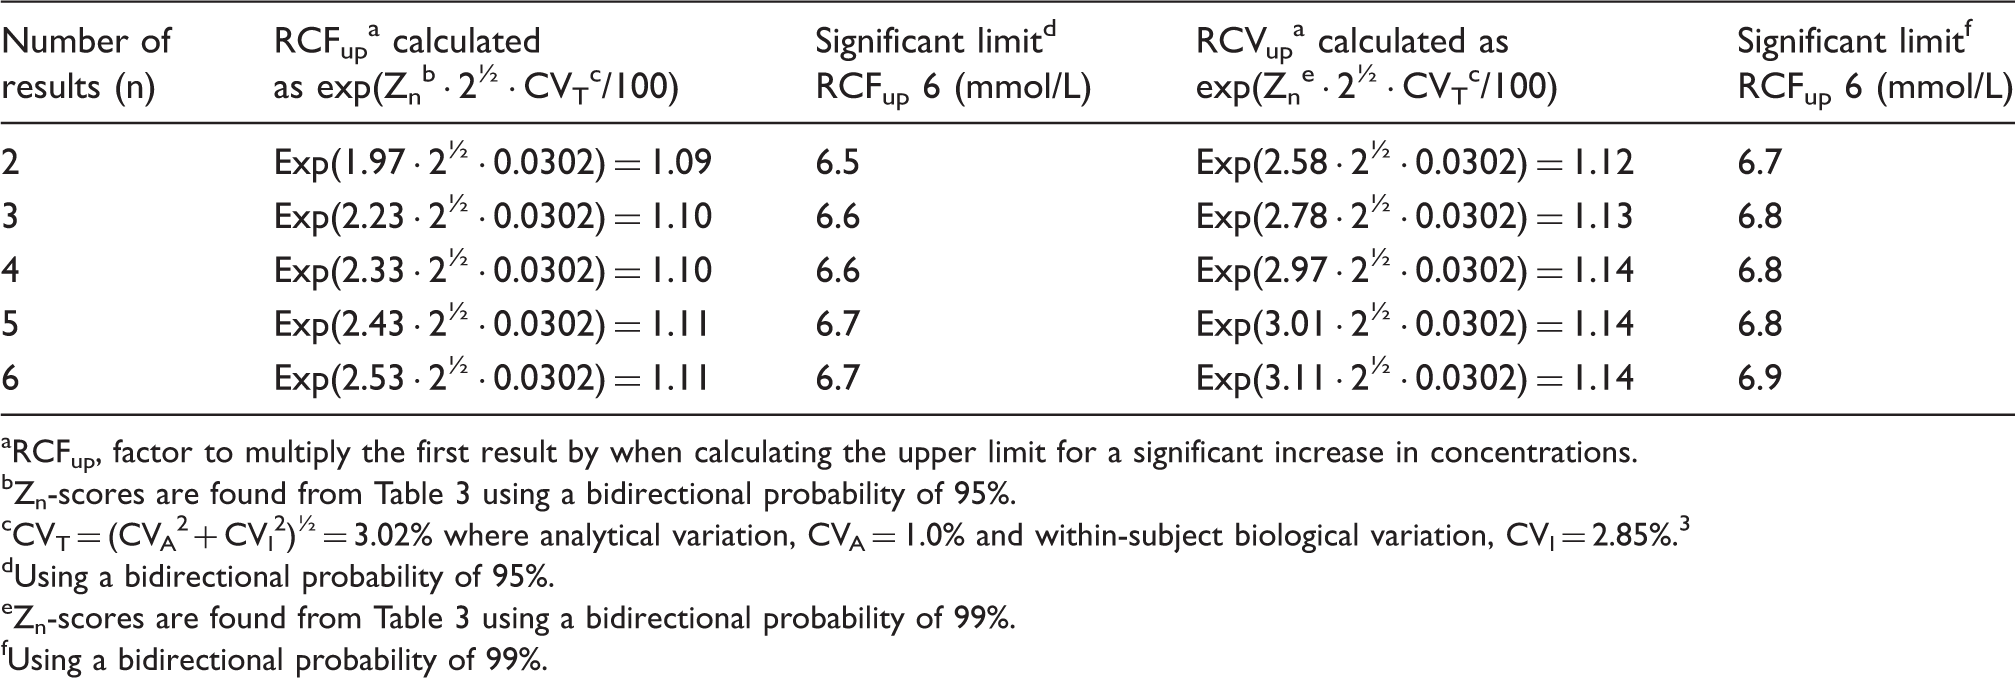
A typical anaemic female patient had a blood haemoglobin concentration (6.0 mmol/L) which is below the population-based reference interval (7.1–9.3 mmol/L). The clinical symptoms indicated iron-deficiency anaemia and oral iron therapy was initiated. Monitoring of blood haemoglobin concentrations was started and a bidirectional change for calculation of significant limits was used. A decrease in results indicates that the anaemia may be due to cause other than iron deficiency and an increase indicates that the treatment is effective. Calculation of upper limits for significant increments in blood haemoglobin concentration with a probability of both 95 and 99% compared with the initial concentration of 6.0 mmol/L is listed in Table 4, and the corresponding downward significant limits are listed in Table 5. These significant limits are also illustrated in Figure 1 as a function of sample number.
The significant limits for bidirectional changes for a patient with an initial blood haemoglobin concentration of 6.0 mmol/L and probabilities of both 95% (p < 0.05) and 99% (p < 0.01) illustrated as a function of sample number. Calculation of upper limits for significant increase in blood haemoglobin concentrations compared with an initial concentration of 6.0 mmol/L. The results are from a typical anaemic patient. RCFup, factor to multiply the first result by when calculating the upper limit for a significant increase in concentrations. Zn-scores are found from Table 3 using a bidirectional probability of 95%. CVT = (CVA2 + CVI2)½ = 3.02% where analytical variation, CVA = 1.0% and within-subject biological variation, CVI = 2.85%.
3
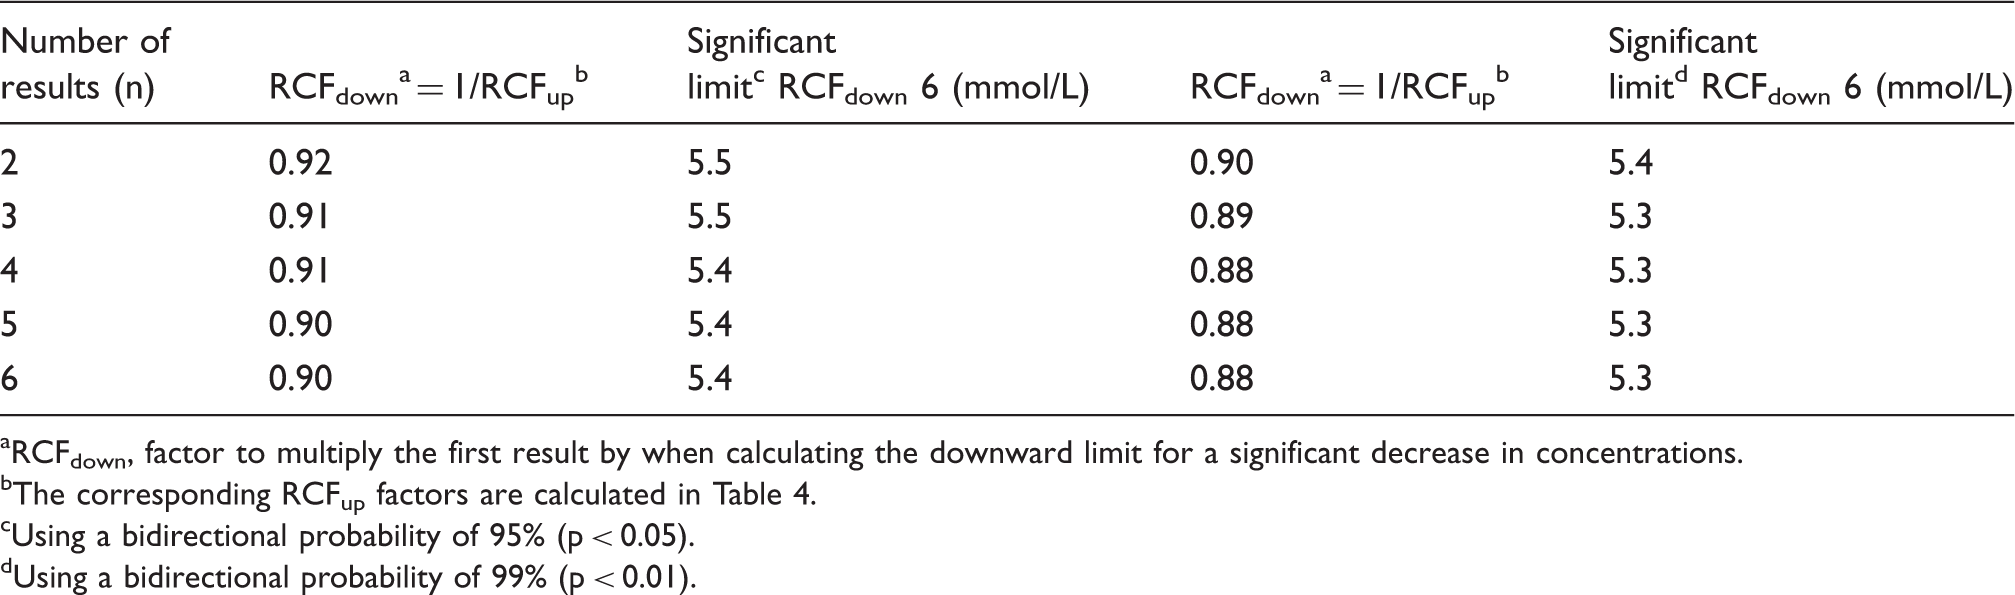
Using a bidirectional probability of 95%. Zn-scores are found from Table 3 using a bidirectional probability of 99%. Using a bidirectional probability of 99%. Calculation of downward limits for significant decrease in blood haemoglobin concentrations compared with an initial concentration of 6.0 mmol/L. The results are from a typical anaemic patient. RCFdown, factor to multiply the first result by when calculating the downward limit for a significant decrease in concentrations. The corresponding RCFup factors are calculated in Table 4. Using a bidirectional probability of 95% (p < 0.05). Using a bidirectional probability of 99% (p < 0.01).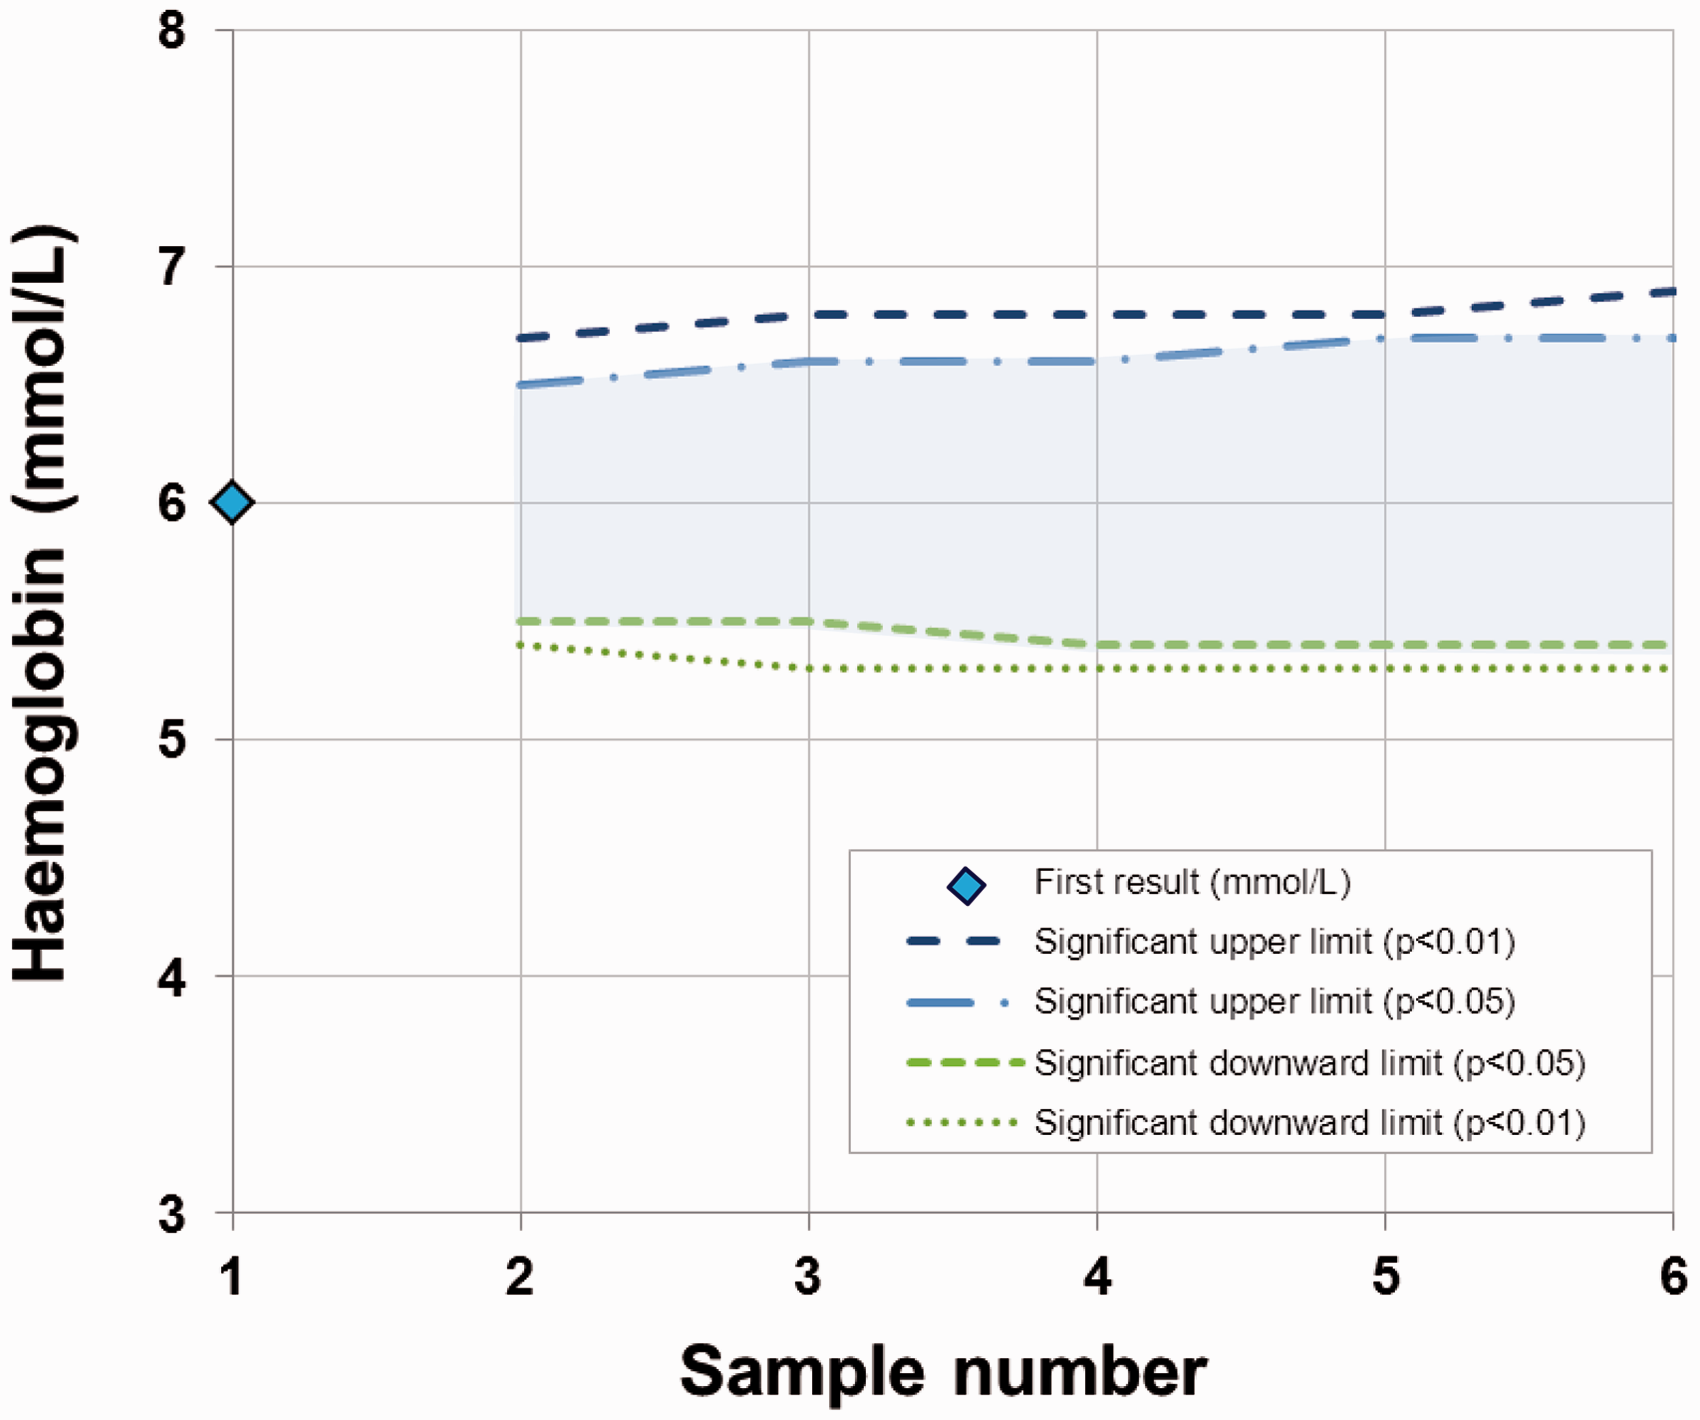
Conclusions
A simple calculation of limits for significant bidirectional changes in two or more serial results is presented here. The upper limit for significant increment of serial results (ln-normally distributed) is calculated by a factor RCFup. If X1 is the first result, then upper limit is found with X1 multiplied by RCFup

The RCFup factor is calculated from the equation

Footnotes
Acknowledgements
We would like to thank Merete Frejstrup Pedersen for her assistance in generating the figure.
Declaration of conflicting interests
None.
Funding
This research received no specific grant from any funding agency in the public, commercial, or not-for-profit sectors.
Ethical approval
Not required.
Guarantor
FL.
Contributorship
FL and PHP designed and generated the computer simulations. FL wrote the first draft of the manuscript. All authors contributed to the discussions, and reviewed and edited the manuscript.