
Abstract
Background and objectives
To carry out a cross-sectional survey of the medical literature on laboratory research papers published later than 2012 and available in the common search engines (PubMed, Google Scholar) on the quality of statistical reporting of method comparison studies using Bland–Altman (B-A) analysis.
Methods
Fifty clinical studies were identified which had undertaken method comparison of laboratory analytes using B-A. The reporting of B-A was evaluated using a predesigned checklist with following six items: (1) correct representation of x-axis on B-A plot, (2) representation and correct definition of limits of agreement (LOA), (3) reporting of confidence interval (CI) of LOA, (4) comparison of LOA with a priori defined clinical criteria, (5) evaluation of the pattern of the relationship between difference (y-axis) and average (x-axis) and (6) measures of repeatability.
Results and interpretation
The x-axis and LOA were presented correctly in 94%, comparison with a priori clinical criteria in 74%, CI reporting in 6%, evaluation of pattern in 28% and repeatability assessment in 38% of studies.
Conclusions
There is incomplete reporting of B-A in published clinical studies. Despite its simplicity, B-A appears not to be completely understood by researchers, reviewers and editors of journals. There appear to be differences in the reporting of B-A between laboratory medicine journals and other clinical journals. A uniform reporting of B-A method will enhance the generalizability of results.
Introduction
Comparison of different measurement techniques for the same analyte or quantitative clinical variable is commonly undertaken in laboratory and clinical medicine. Frequently, this arises from the need to compare a new measurement method with an older and more established method.
Pearson’s correlation coefficient is used as a surrogate measure for agreement; however, it primarily estimates a linear correlation rather than agreement. Two methods can show excellent correlation despite the presence of significant systematic bias. Correlation fails to provide information on the type of association between the data. Scatter plot of data from two method comparison studies, although different, may still have the same correlation coefficient. The correlation coefficient is sensitive to the range of values and cannot differentiate between systematic or random difference in two measurements. 1 Furthermore, if one method measures consistently lower than the other method for half of the subjects, but higher for the other subjects, the average discrepancy may be zero, despite the discrepancy for individual subjects being higher. 1 Assessment of agreement is therefore essential in the comparison of two methods.
Altman and Bland 2 in 1983 provided a novel statistical approach (Bland–Altman [B-A]) for quantitative method comparison of continuous variables. The authors stressed the requirement for quantification of bias and assessment of agreement in two respects, i.e. how well the methods agree on average and how well the measurements agree for individual readings. Agreement is not something which is merely present or absent, but something which must be quantified. 3 They proposed a simple and visually intuitive plot for method comparison. 3 The method of analysis has been extensively used in evaluating the agreement of laboratory analytes and physiological variables
Despite its simplicity and frequent use in clinical laboratory research, B-A is often not properly interpreted or reported in clinical literature. Previous surveys4–6 of clinical studies using B-A methodology observed that reporting was often not fully in accordance the techniques suggested by Bland and Altman. 7 We sought to ascertain whether any improvement in reporting of B-A had occurred. The aim of our study was to undertake a cross-sectional survey of the medical literature on the reporting of results of B-A analysis and to compare it with the reporting format suggested by Bland and Altman. 7
Material and methods
We conducted a Boolean literature search for studies on the agreement of laboratory analytes, in the medical search engines PubMed and Google Scholar. The search was conducted for articles published in the year 2012 and later, using the search terms: ‘Bland–Altman’ AND ‘Laboratory research’ OR ‘Method comparison’. During PubMed search, the additional filters used were medical field, human subjects and English language (to exclude studies in other languages and non-human studies). Only method comparison studies of laboratory analytes were included; review articles were excluded.
B-A analysis
In B-A analysis, a scatter plot is constructed in which the difference between the paired measurements is plotted on y-axis and average of the measures of two methods on x-axis. 7 The mean difference in values obtained with the two methods is called the bias and is represented by a central horizontal line on the plot. The standard deviation (SD) of differences between paired measurements is then used to construct horizontal lines above and below the central horizontal line to represent 95% limits of agreement (LOA) (mean bias ±1.96 SD) and is called upper and lower LOA. The plot enables the researcher to assess visually the bias, data scatter and the relationship between magnitude of difference and size of measurement. Often a heteroscedastic distribution (i.e. the magnitude of differences increases proportionally to the size of the measurement) can be observed. In the case of heteroscedastic distribution, logarithmic or percentage transformation of data may be required to construct a log difference or relative difference plot. 7
In contrast to statistical hypothesis testing, B-A analysis estimates bias and LOA. 7 The estimates have inherent risk of sampling error, and hence the precision calculation (confidence interval [CI]) of bias and LOA are required. Any conclusions on agreement and interchangeability of two methods are then made based upon the width of these LOA in comparison to a priori defined clinical criteria. Data collection in replicates is required under this approach. Replicates are defined as two or more measurements on the same individual by the same method, taken under identical conditions. Repeatability of measurements enables the comparison of the agreement between the two methods with the agreement each method has to itself.
A predesigned checklist was used for detailed evaluation of the publications identified in the literature search. The checklist included details of authors, analyte studied, sample size calculation and the following six items: (1) correct representation of x-axis on B-A plot; (2) representation and correct definition of LOA; (3) reporting of CI of LOA; (4) comparison of LOA with a priori defined clinical criteria; (5) evaluation of the pattern of relationship between difference (y-axis) and average (x-axis) and (6) measures of repeatability. For those studies on which a relationship pattern had been evaluated (item 5) and in which the data showed heteroscedastic scatter, we recorded whether appropriate data transformation (e.g. logarithmic, percentage scale) had been undertaken. Each item (1–6) on the checklist was rated as ‘Yes’ or ‘No’.
Each study was evaluated by two authors (VC, SKK) who had previous experience of publishing laboratory research with use of B-A analysis8,9 and a consensus answer recorded for each item.
Results
Quality of reporting of Bland–Altman analysis and comparison with previous studies.
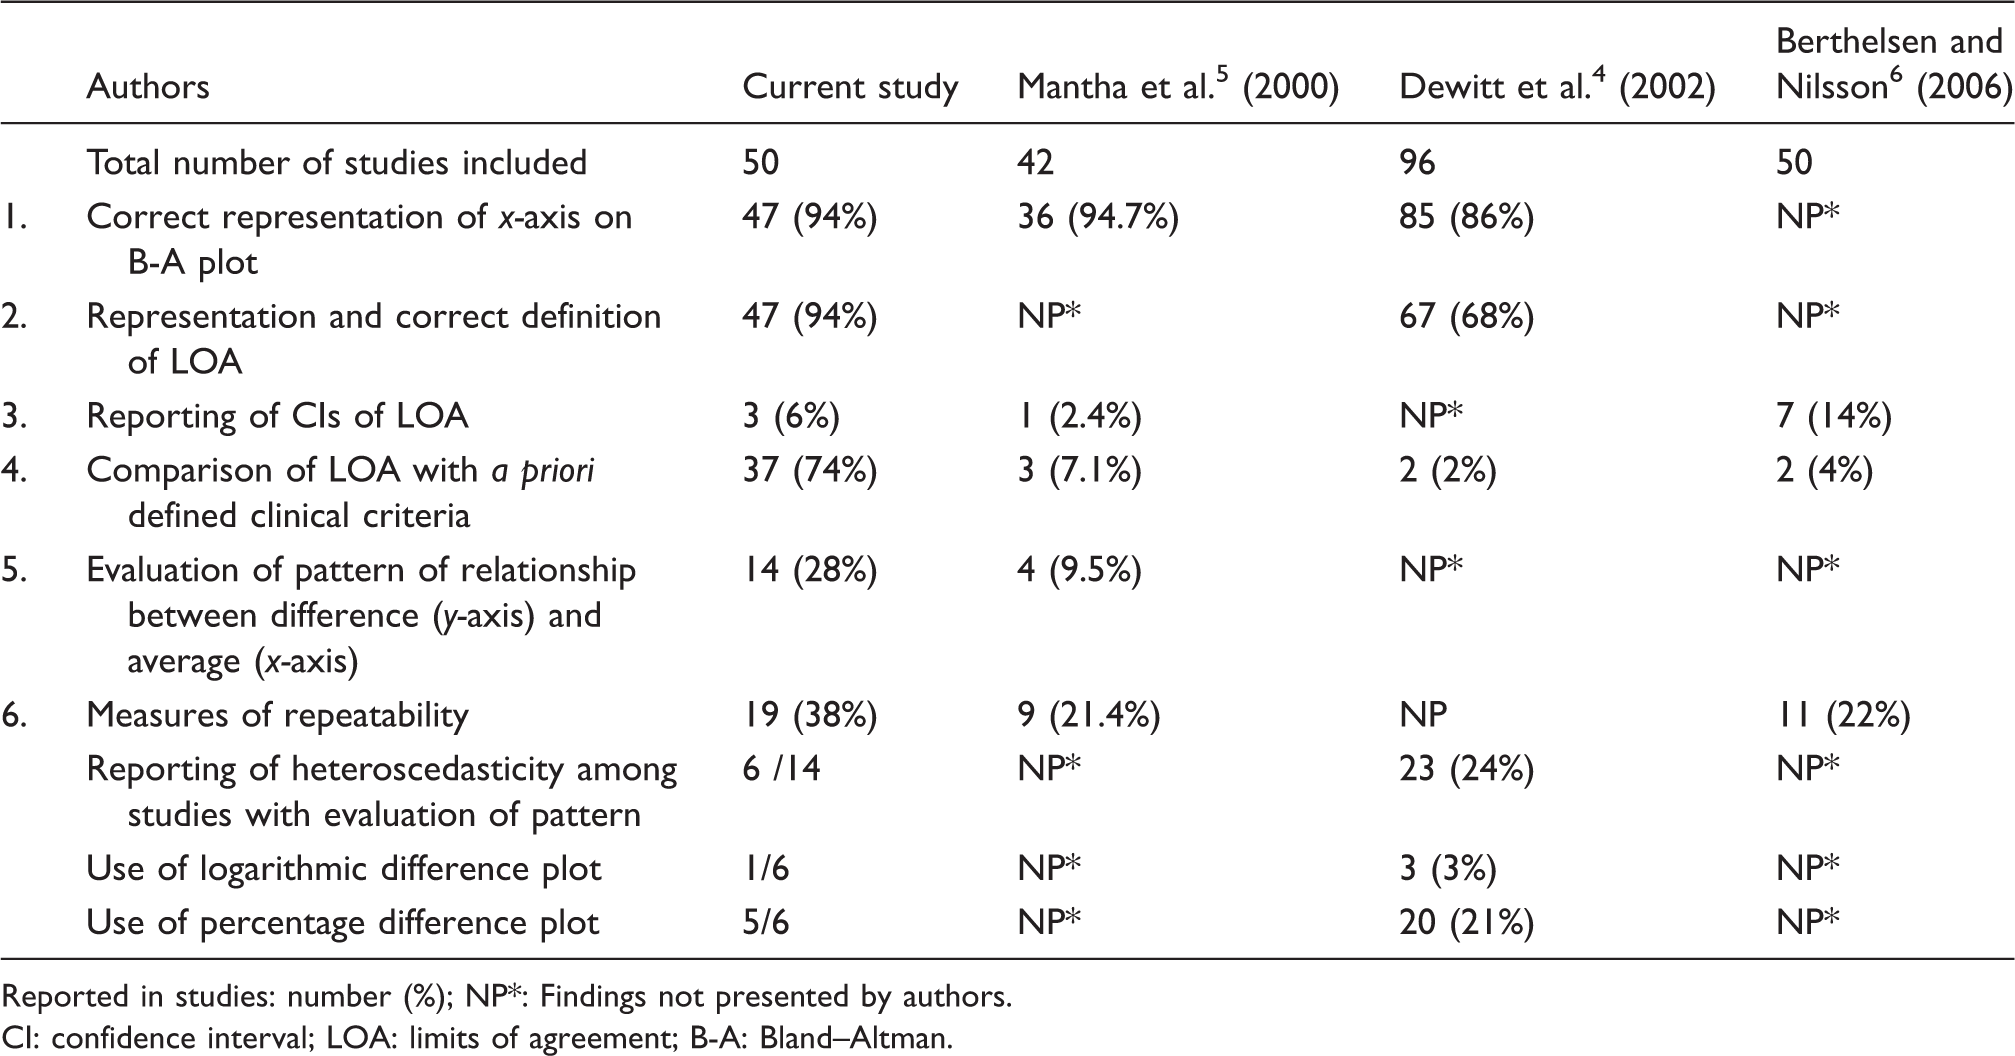
Reported in studies: number (%); NP*: Findings not presented by authors.
CI: confidence interval; LOA: limits of agreement; B-A: Bland–Altman.
Discussion
The original article by Altman and Bland 3 which proposed this method of agreement analysis has received more than 28,000 citations in the biomedical literature and has increased in usage in recent years. Previous investigations of the reporting of B-A have demonstrated deficiencies.4–6
Bland and Altman suggested the plotting of the average of two methods on x-axis and differences of measures on y-axis. Plotting of difference against any individual method may falsely show either significant positive or negative correlation between the two, even when there is no true relationship. The same is not the case when the average of two methods is plotted as x-axis. 10 In all of the publications evaluated here, the B-A plot was presented correctly which represents an improvement from a previous study which found that the plot was not provided in 22% of cases. 6 This improvement might reflect the wider availability of various computer software packages such Analyse-it, Graphpad Prism, EP-evaluator, which automatically select x-axis as average of two methods. Appropriate representation of x-axis was found in 94% of studies which is similar to that reported by Dewitte et al. (87%) 4 and Mantha et al. (94%). 5
LOA were correctly represented and defined in 94% of studies. The remainder had either wrongly drawn LOA or defined good agreement between methods only on the basis that 95% of differences were lying within upper and lower LOA, which is not appropriate. The CI limits of LOA were reported in only 6% of studies. The LOA are estimates, and reporting LOA without CI is equivalent to reporting a sample mean without its CI. The CI limits represent the range within which a single, new observation would lie if taken from the same population. 11 Although reporting of CI of LOA has been strongly recommended by Bland and Altman 7 and Hamilton and Stamey, 12 our findings that this is frequently not done confirm those of a previous study. 5
To assess agreement between two methods, instead of LOA per se, the width of LOA needs to be compared to a priori defined clinical limit criteria. These acceptable clinical limits of laboratory analytes have been provided by Ricos et al. 13 and Westgard QC. 14 Alternatively, if specifications are lacking, a Delphi survey (a multistage process of group facilitation designed to transform expert opinion into a group consensus) can be undertaken to determine acceptable limits. 15 Previous surveys have shown that comparison with predefined clinical criteria was missing in >90% of publications but was found in 74% of publications included in the present study which represents a major improvement.4,5
The B-A plot is also a graphical check on the LOA and pattern of scatter of the data. 16 Only 28% of studies evaluated the pattern of scatter of data. Drawing difference plots with parallel LOA in heteroscedastic scatter datasets may give LOA which are wider in the lower concentration range and narrower in the higher concentration range, thus affecting the validity of interpretation. Logarithmic transformation of heteroscedastic data was proposed by Bland and Altman. 7 For meaningful understanding of LOA, back-transformation (antilog) of the log transformed data was suggested. Alternatively, the ratios of two methods or percent difference between methods can be plotted against average of two methods for simpler interpretation. 7 Transformation of data usually renders the scatter of differences as homoscedastic. Twomey 17 recommended the drawing up of funnel-shaped or V-shaped LOA instead of classical parallel LOA in data sets with heteroscedastic scatter. Another option is breaking the data into smaller subsets and then analysing these subsets with absolute difference plot to make conclusions. 17
Repeatability of data in the form of paired measurement is an essential requirement in B-A analysis. If one or both methods have poor repeatability, the agreement between the two methods is bound to be poor also. Repeatability of data measurements was described in 38% of publications which does not represent a substantial improvement from previous studies (Table 1). The width of LOA varies with the precision of methods. LOA are wider when methods are imprecise and vice versa. So the conclusions drawn from studies without repeatability assessment are likely to be uncertain. 6
Sample size calculations were performed in only 15 of publications reviewed here. Bland and Altman 7 had proposed a formula (1.71 SD/√n) for calculation of standard error (SE) of the 95% LOA, where SD is the standard deviation of the differences between measurements by the two methods and n is the sample size. 7 If n increases, SE decreases and the CI of LOA are narrower; however, if the sample size is insufficient, then CI of LOA are wider. Sample size therefore affects the CI of LOA, and a small sample size makes comparison with a priori defined clinical limit criteria uncertain due to wider LOA. 18
In summary, we found that there is still incomplete reporting of B-A analysis in the biomedical literature. A weakness of our paper is that the search was limited to only two databases, and therefore it is possible that other relevant studies might have been missed. Despite its simplicity, B-A analysis still appears not to be completely understood by researchers, reviewers and editors of journals. It is of interest that there appear to be differences in the reporting of B-A analysis between laboratory medicine journals and other clinical journals. More uniform reporting of B-A method will enhance the generalizability and facilitate the inclusion of studies in systematic reviews.
Footnotes
Acknowledgements
None.
Declaration of conflicting interests
None declared.
Funding
This research received no specific grant from any funding agency in the public, commercial, or not-for-profit sectors.
Ethical approval
Not applicable. The study is a cross-sectional survey of medical literature and did not involve human or animal subjects; hence, ethical approval was not sought.
Guarantor
VC.
Contributorship
VC and SKK collected data and drafted the manuscript; RB critically reviewed the manuscript.
References
Supplementary Material
Please find the following supplemental material available below.
For Open Access articles published under a Creative Commons License, all supplemental material carries the same license as the article it is associated with.
For non-Open Access articles published, all supplemental material carries a non-exclusive license, and permission requests for re-use of supplemental material or any part of supplemental material shall be sent directly to the copyright owner as specified in the copyright notice associated with the article.