
Abstract
Objective
Determine the interchangeability of various methods utilized for counting colonies in clonogenic assays.
Methods
Clonogenic assays of 2 head and neck cancer cell lines were counted through 4 different counting modalities: Manual counting pen, via microscope, 1 publicly available automated algorithm, and a semiautomated algorithm presented by the authors. Each method counted individual wells (N = 24). Pen and microscopic counts were performed by 2 observers. Parameters included both low-growth (<150 colonies/well) and high-growth (>150 colonies/well) cell lines. Correlational and Bland–Altman analyses were performed using SPSS software.
Results
Interobserver manual pen count correlation R2 value in both growth conditions was 0.902; controlling for only low-growth conditions decreased R2 to 0.660. Correlation of microscopic versus pen counts R2 values for observers 1 and 2 were 0.955 and 0.775, respectively. Comparing techniques, Bland–Altman revealed potential bias with respect to the magnitude of measurement (P < .001) for both observers. Correlation of microscopic counts for both interobserver (R2 = 0.902) and intraobserver (R2 = 0.916) were analyzed. Bland–Altman revealed no bias (P = .489). Automated versus microscopic counts revealed no bias between methodologies (P = .787) and a lower correlation coefficient (R2 = 0.384). Semiautomated versus microscopic counts revealed no bias with respect to magnitude of measurement for either observer (P = .327, .229); Pearson correlation was 0.985 (R2 = 0.970) and 0.965 (R2 = 0.931) for observer 1 and 2. Semiautomated versus manual pen colony counts revealed a significant bias with respect to magnitude of measurement (P < .001).
Conclusion
Counting with a manual pen demonstrated significant bias when compared to microscopic and semiautomated colony counts; 2 methods were deemed to be interchangeable. Thus, training algorithms based on manual counts may introduce this bias as well. Algorithms trained to select colonies based on size (pixels2) and shape (circularity) should be prioritized. Solely relying on Bland–Altman or correlational analyses when determining method interchangeability should be avoided; they rather should be used in conjunction.
Introduction
Clonogenic assays are an in vitro laboratory technique used to determine clonogenic potential, or the capacity for individual cells to form colonies. 1 This is often utilized within the context of measuring cellular response to therapeutic agents such as radiation or other cytotoxic agents. A colony was defined as having greater than 50 cells. 2 With respect to techniques used for clonogenic assays, the paper by Franken et al 1 also recommended manually counting colonies with a counting pen. This method is often cumbersome and time consuming. To mitigate this issue, automated programs have been developed.3‐6 For the purposes of this project, the automated technique developed by Guzmán et al 7 was employed for comparison to our standard operating procedure developed in our program given its robust utilization, as well as, the open-access nature of both ImageJ and the plugin developed within this study. In this study, we used percent surface area and signal intensity as surrogate indicators to quantify colony formation in clonogenic assays and were able to successfully demonstrate the program's ability to accurately detect parameters such as IC50. 7
Automating cell counting also comes with advantages such as standardizing laboratory techniques and preventing potential human bias interference. This can be especially important when the data may guide clinical endpoints such as drug and dosage selection. Arbitrarily defining a colony as 50 cells is a way to standardize the manual counting procedure, ensuring each plate is being counted consistently. Technique adjustments, such as this, will ensure that manually counted results are more reproducible, especially between observers. However, one must consider whether the method of manual counting can fulfill the desired level of standardization originally intended with this technique. The developers of the clonogenic assay reported quantifying colony count and calculations based on the utilization of a manual counter pen. 1 Consequently, this has resulted in multiple automated colony counting systems that have been developed by training algorithms using manually counted datasets. Furthermore, correlational analyses have traditionally been relied upon as a metric assessing the validity of performance and interchangeability between these 2 different methodologies.3,8 However, relevant literature, as well as this article, demonstrate how technicians may be misguided in validating the interchangeability of 2 methods of measurement if relying solely upon statistical or correlational significance.9‐11
In this study, our group describes how relying upon correlational analyses may not consistently be a reliable indicator of accuracy with respect to manually counting cell colonies. Additionally, we explore how the measure of clonogenicity may differ from inherent artifacts in quantification assays based on percent area or signal intensity, as some measurements may be surrogate indicators of proliferation rather than clonogenicity. We also present our implementation of the semiautomated software algorithm developed by Guzmán et al This newer standardization technique may serve as a guide for future work. Ultimately, we found implementation of a semiautomated algorithm that selected colonies based on colony size (pixels2) as a parameter, demonstrated a strong correlation, with an absence of systemic biases, when compared to manual microscopic colony counts, determined through Bland–Altman analysis. In contrast, manual pen counter counts demonstrated significant bias when compared to manual microscopic colony counts as revealed by Bland–Altman analysis; a systemic bias that may not have been identified if correlational analysis was solely relied upon.
Methods
Cell Lines and Clonogenic Assays
MOP FA1 (FA1) and VU-1131-T2-8 (1131) head and neck squamous cell carcinoma cell lines were grown in MEM + 10% FBS (ThermoFisher) in 6-well tissue culture treated plates (Corning). In each plate, replicate wells were used as media-only control wells or treated with metformin (LKT Laboratories Inc., St. Paul). Colony formation was allowed to develop over 10 days. Media and treatments were replaced after 5 days for the 24 well plates to prevent excessive evaporation. At the assay conclusion, the plates were fixed and stained with Diff Quick 3 Step Stain (ThermoFisher), a modification of the Wright-Giemsa stain. Four replicate experiments were performed with the FA1 cell line and 2 with the 1131 cell line.
Colony Counting: Manually with and Without Microscope
Colonies were defined as a group of at least 50 cells 2. Colonies were counted at 40× magnification using an inverted light microscope (Nikon Eclipse TE200). The contents of the entire well were counted for low-growth (>150 colonies/well) FA1 plates while 2 quadrants per well were counted for high-growth (<150 colonies/well) 1131 plates. Colonies that grew together were counted separately based on the presence of visible demarcations where observers were able to see colonies had met. The same procedures were performed by 2 independent observers.
The 2 observers standardized their counting procedures by circling a colony of interest, both observing it under a microscope and determining if the colony was above or below the threshold of 50 cells. This was done for both FA1 and 1131 cell lines, to create agreement for the cutoff size for a counted colony between observers. This was required as FA1 and 1131 cells differ in size and intercellular junctions, and colonies of 50 cells of FA1 cells took up a larger area on the cell culture surface compared to 1131 cell line colonies. This self-assessment technique was repeated for each cell line until observers felt proficient in identifying colonies based on size by visual inspection, requiring approximately 5 to 10 practice trials per cell line. Clonogenic assays were then counted manually with a colony-counter pen (ThermoFisher). The second manual counting method, done by both observers, was to count colonies above the 50-cell threshold using a manual differential counter while visualizing each field under a microscope.
Semiautomated Algorithm
Clonogenic assays were scanned at a resolution of 1200 DPI, per Guzmán et al, 7 to optimize the performance of the image-based algorithm on an HP all-in-one printer (HP LaserJet Pro MFP M227) and Windows 10 Dell desktop computer. To eliminate nonuniform illumination across each well, which can lead the plugin to identify areas of background as cells, we cut discs from photo paper using the Cricut Maker® 3 (Cricut, Inc.). The discs were placed in each well before scanning and the plates scanned from the bottom, providing a consistently shaded, light color background. The algorithm by Guzmán et al was employed in ImageJ 12 (version 1.53 K) as a plugin where plates were scanned and analyzed, per their published method, to generate heat maps of all plates. The heat-map/threshold images were then utilized, instead of scanned images, given automated thresholding better guards against bias and allowed us to introduce another form of standardization for all images. This file was then manually thresholded using the following command order to include all colonies (Image Adjust > Threshold (include all colored areas) > Select “Dark Background” and “Don’t Reset Range” > Apply > Method: Default, Background: Dark, unselect all other options > OK). For high growth conditions with multiple colonies converging together, auto-segmentation was utilized (Process > Binary > Watershed > Process all Images? Select “Yes”). Colonies were then analyzed via pixel counting (Analyze > Analyze Particles > Specify size (pixel^2) and circularity. Pixel^2 is area in square pixels in ImageJ. Circularity is a parameter characterizing colony shape. Select “Display Results” and “Summarize” > OK > Process all images? Select “Yes”).
In order to train the algorithm, analyzed results were compared to corresponding values generated by counting with a microscope. This was performed by calibrating ImageJ software to only detect colony counts that corresponded with microscopic colony counts (>50 cells/colony). This was achieved by utilizing 2 control wells as a reference to then select colonies based on size (pixel^2). Of note, There were 46.69, or 2179.95 pixels/mm2. For example, a clonogenic well with a known microscopic colony count of 250 colonies was used as a reference for when determining what dimensions (pixel^2) produced ImageJ colony counts closest to 250 colonies. Once circularity and size (pixel^2) were optimized to match corresponding microscopic values, analysis with the newly defined parameters was employed against all clonogenic assays. Circularity selected was 0.34 to enhance signal-to-noise ratio by decreasing detection of pixelated artifacts. Colony size differed for the FA1 cell line (250 pixels2) versus the 1131 cell line (25 pixels2). Of note, this corresponded with the increased size and distribution of FA1 colonies compared to 1131 colonies observed under the microscope.
Statistical Analysis
SPSS statistics software version 28.0.1.1 was utilized for all statistical analyses presented in the paper including Pearson correlational coefficients, linear regression, and Bland–Altman plots. 13 Linear regression of Bland–Altman plots was performed as a method to detect biases with respect to the magnitude of measurement. 9 A detection of systemic biases between observers and/or methods of measurement was defined as a linear regression P-value ≤ .05 with respect to comparing magnitude of measurement (mean) versus difference. A nonsignificant result (P ≥ .05) was indicative of no systemic biases between groups or methods.
Results
Correlational Analysis of Interobserver Manual Colony Counts
Twenty-four wells were counted individually, via colony-counter pen, by 2 separate observers with special emphasis placed on selecting colonies suspected to be >50 cells in size after training (see methods). Correlational analysis of both high-growth (1131 cell line) and low-growth (FA1 cell line) clonogenic assays revealed a Pearson correlation coefficient of 0.950, R2 = 0.902, between observers (Figure 1A). However, the correlation coefficient decreased to 0.812, R2 = 0.660 when comparing interobserver counts of only low-growth FA1 clonogenic assays, demonstrating high correlation, but somewhat less robust than the 0.902 value observed with the 1131 cells (Figure 1B). As expected, the interobserver correlation is stronger with larger quantities of counted colonies. With any statistical analysis, the reliability of the sample means increases with sample size.

Interobserver variability of manual counting. Correlation between colony counts performed manually between 2 observers (N = 24). Pearson correlation 0.950 (P < .001) (R2 = 0.902, Figure 1A). Correlation between manual colony counts of FA1 (low-growth) conditions (N = 16). Pearson correlation 0.812 (P < .001) (R2 = 0.660 Figure 1B). Examples of high-growth (Figure 1C) and low-growth wells (Figure 1D) are shown as well.
Correlational Analysis Between Manual Colony-Counter pen and Microscopic Techniques
Next, colonies composed of >50 cells/colony were counted via microscope. While correlational values initially appeared strong for both observers 1 and 2 (Pearson correlation coefficient = 0.977, 0.775, respectively, Figure 2A, C), linear regression analysis of the Bland–Altman graph for each observer revealed significant differences between the 2 methodologies with respect to magnitude of measurement (P < .001, Figure 2B, D). We observe the manual count somewhat overestimates microscopic colony counts (here, the difference is defined as manual counts minus microscopic counts) at lower values while somewhat underestimating counts at higher values, revealing a bias that is biphasic across the distributed magnitude of measurement (Figure 2B, D).

Variability between counting colonies manually with colony-counter pen versus microscope. Comparing the number of colonies counted utilizing the 2 different manual counting modalities, colony-counter pen versus microscope. For observer 1, Pearson correlation = 0.977 (P < .001, Figure 2A). R2 = 0.955. For observer 2, Pearson correlation = 0.880 (P < .01, Figure 2C) (R2 = 0.775). Bland–Altman regression analysis for observers 1 and 2 revealed significant bias with respect to magnitude of measurement (P < .001, Figure 2B, D). The difference is defined as microscopic counts subtracted from manual counts, thus manual counts exhibit an overestimation at lower values and an underestimation at higher values with respect to microscopic colony counts.
Correlation of Interobserver and Intraobserver Colony Counts Utilizing the Microscopic Technique
As a way of testing the variability involved in both counting plates with a microscope, as well as, assessing the variability of clonogenic assays themselves, correlational analyses of microscopic colony counts between observers and between paired wells in clonogenic assays wereperformed. Results revealed a strong correlation with respect to both interobserver (Pearson correlation coefficient = 0.950 (P < .001), R2 = 0.902, Figure 3A), as well as intraobserver (Pearson correlation = 0.957 (P < .001), R2 = 0.916, Figure 3C) colony counts. There was no evidence of significant bias across all magnitudes of measurement (Bland–Altman P ≥ .05, Figure 3B, D). Thus, the combination of correlational and Bland–Altman analyses revealed the microscopic counting techniques could achieve the desired level of standardization (selecting only colonies >50 cells in size). Furthermore, this method was reproducible between observers and both low and high-growth conditions without any evidence of significant bias; an optimal outcome with respect to measurement techniques.

Interobserver and intraobserver variability of microscopic counting. Between observers 1 and 2, Pearson correlation of colonies counted under a microscope = 0.950 (P < .001, Figure 3A) (R2 = 0.902). Bland–Altman regression analysis revealed no bias with respect to magnitude of measurement (P = .125, Figure 3B). Each clonogenic assay had 2 control wells and 2 wells treated with metformin. Colony counts of both wells were compared based on counting performed using a microscope. Pearson correlation = 0.957 (P < .001, Figure 3C). R2 = 0.916. Bland–Altman revealed no biases with respect to magnitude of measurement (P = .489, Figure 3D).
Correlation of Microscopic Colony Counts Versus Signal Intensity and Percent Area
Guzmán et al 7 were able to demonstrate the signal intensity and percent area of clonogenic assays resulted in calculated IC50 values comparable to those generated by MTT analysis. Upon initial examination, signal intensity, and percent area strongly correlated with microscopic colony counts (Pearson correlation coefficients = 0.837 and 0.856, respectively, Figure 4A, B). Percent area and microscopic colony counts were compared by defining both as a percent of control, with the control value being the average value of the 2 control plates in each clonogenic assay measured. Pearson correlation was 0.620, R2 = 0.384 (Figure 4C), indicating only a modest correlation. Of note, given the small, unitless values generated by the algorithm, values were multiplied by constant of 10 for percent area and by 20 for signal intensity. It is important to note this was specifically for graphing purposes only as multiplying by a constant value had no effect on correlational analyses values (data not shown). For the purposes of constructing a Bland–Altman plot, values were normalized between microscopic counts and signal intensity/percent area by taking representing values as the % value with respect to the average of the 2 control wells (percent of control = (x)/((control 1 + 2)/2) *100). Considering how multiplying the percent area or signal intensity by a constant value would alter the differences between groups (y-axis), it was deemed more appropriate to match the units of measurement between groups (units = percent of control) given the algorithm gave a unitless value as opposed to a true colony count. This also normalized the range of both variables being compared, as opposed to analyses showing large differences between measurements due to different units with different ranges of values, thus affecting the dependent variable (y-axis). Comparing values represented as a % of control produced a Bland–Altman plot with no significant bias between methodologies (P = .787, Figure 4D). The lack of bias between percent area and microscopic counting shows these could be interchangeable methods for microscopic colony counting with respect to therapeutic response (percent of control). However, the relatively low R2 value indicates the lack of bias may not represent a true correlation.
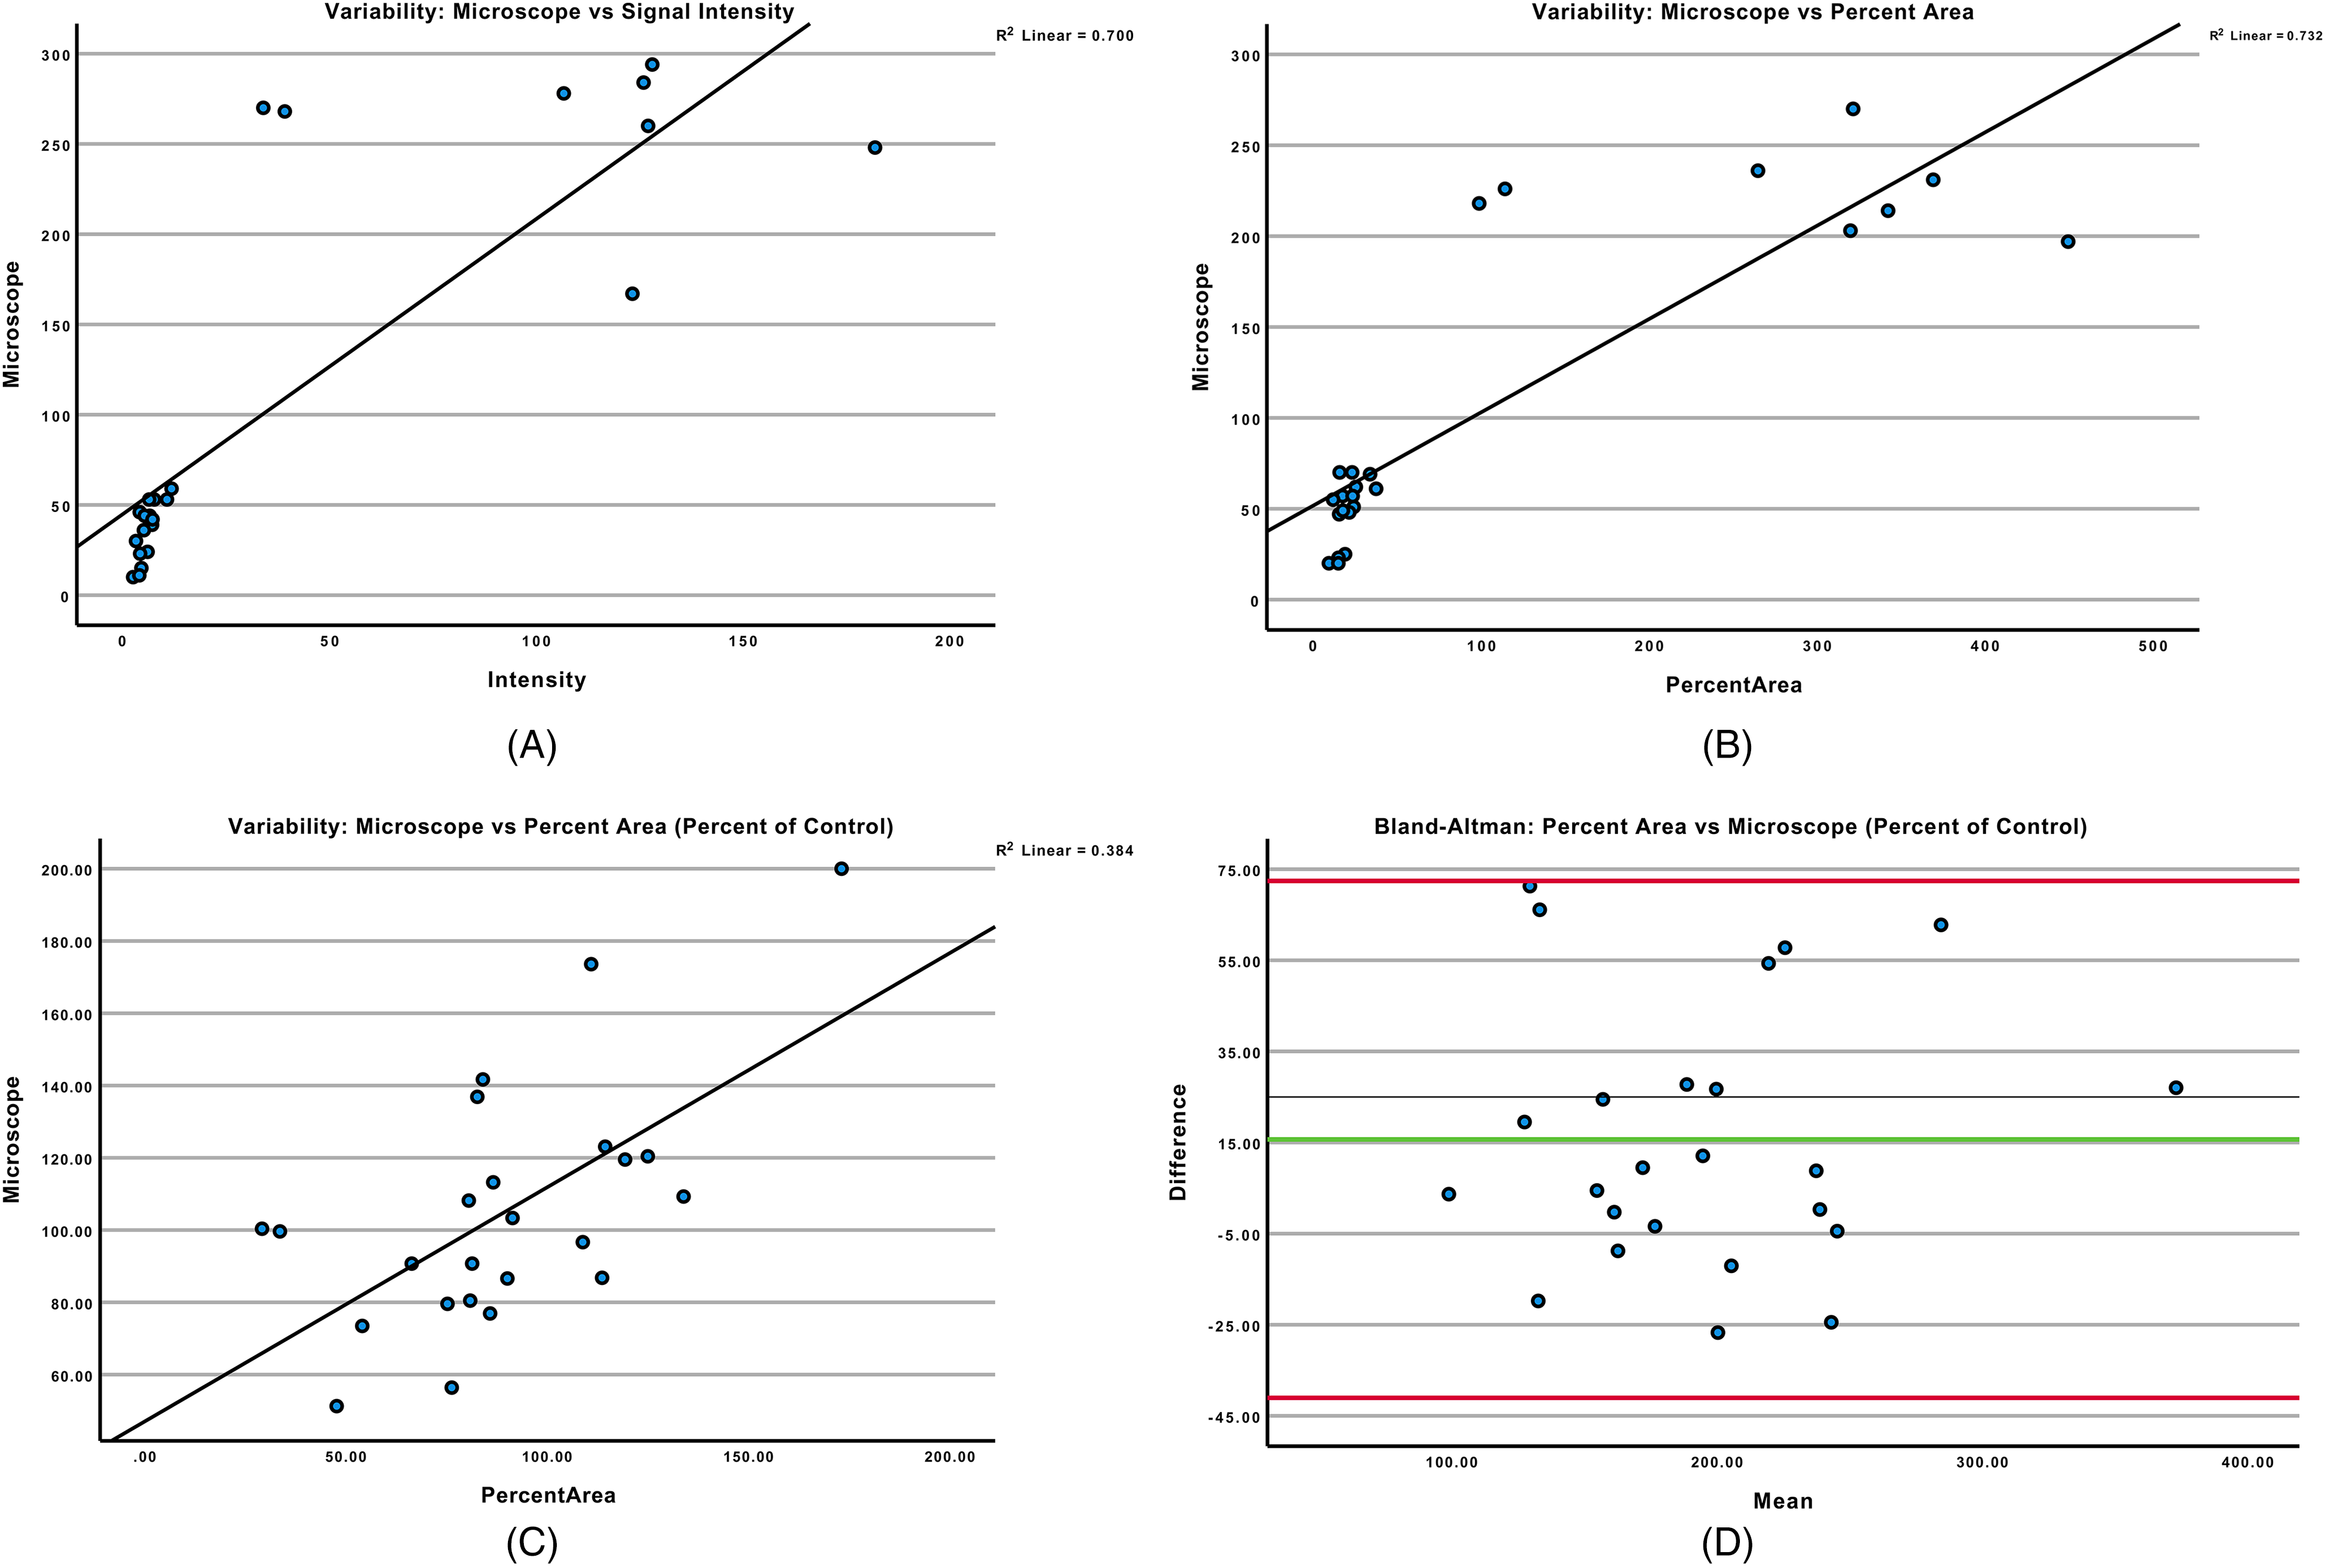
Variability comparing microscopic colony counts to signal intensity and percent area. Colonies were counted under a microscope and compared to signal intensity and percent area values generated by the publicly available algorithm. 7 Spearman correlation for signal intensity and percent area were equal to 0.837 and 0.856, respectively (P < .001, Figure 4A, B). For the purposes of constructing a Bland–Altman plot, values were normalized between microscopic counts and signal intensity/percent area by taking representing values as the % value with respect to the average of the 2 control wells (Percent of control = (x)/((control 1 + 2)/2) *100). This produced a Bland–Altman plot with no significant bias between methodologies (P = .787, Figure 4D) while Pearson correlation was 0.620 (P < .001, Figure 4C), R2 = 0.384.
Variability Comparing Microscopic Colony Counts to Semiautomated Algorithm
A semiautomated algorithm was developed by utilizing the threshold heat maps generated by the Guzmán et al 7 publicly available algorithm and then manually trained to identify colonies of a certain size (>50 cells/colony). This allowed for the appropriate parameters to be identified (250 pixels2 for FA1 cell lines, 25 pixels2 for 1131 cell lines, > 0.34 circularity for both). These parameters were then applied against all clonogenic assays for both observer 1 and 2. Of note, the difference in pixel size between FA1 and 1131 cell lines corresponded with colony size and distribution differences observed under the microscope. As a result, there was a strong correlation between algorithm and microscopic colony counts for both observer 1 and 2 (Pearson correlation coefficient = 0.985 and 0.965, respectively, Figure 5A, B). Furthermore, Bland–Altman plots revealed no biases with respect to the magnitude of measurement for observer 1 (p = .327) or observer 2 (p = .229, Figure 5C, D). The semiautomated algorithm was able to reliably determine colony counts across different treatment conditions, was reliable among different observers, and demonstrated no bias through the entire magnitude of measurement for both low and high-growth conditions. Selecting for colonies based on size most closely reflected microscopic colony counts which included only colonies of 50 cells or greater; a parameter originally set by the developers of the clonogenic assay to reflect its intended usage. 1

Variability comparing microscopic colony counts to semiautomated algorithm. Colonies counted with a microscope compared to colony counts generated by the semiautomated algorithm we developed. Pearson correlation was 0.985 (R2 = 0.970) and 0.965 (R2 = 0.931) for observers 1 and 2, respectively (P < .001, Figure 5A, B). Regression analysis of Bland–Altman plots revealed no biases with respect to magnitude of measurement for observer 1 (P = .327, Figure 5C) or observer 2 (P = .229, Figure 5D). A Bland–Altman plot was then constructed comparing the semiautomated algorithm to manual colony counts which resulted in a significant bias with respect to magnitude of measurement (P < .001, Figure 5E).
Semiautomated Algorithm Versus Manual Colony Counts
Upon further analysis, the algorithmic colony counts, developed to match microscopic colony counts, demonstrated a significant biphasic bias against manual counts (P < .001, Figure 5E).
Discussion
When developing more efficient methods to substitute for labor-intensive laboratory techniques, correlational analyses comparing the performance and similarity of the differing modalities have often been utilized to gauge whether 1 technique is a precise and accurate substitute for the other. In some ways, the Bland–Altman graph could be considered a gold-standard when comparing different methods of measurement.9,13,14 In support of this assertion, we demonstrate how exclusively relying upon a high correlational value to serve as a proxy for intermethodological analysis would have resulted in missing systemic differences between 2 modalities that were detected in the Bland–Altman analysis.
First, it's important to acknowledge the ways assays of this type may be prone to bias or other inherent factors that may affect data stringency. Traditional, manual data collection techniques, such as clonogenic assays, require standardization and consistent implementation. Our analysis highlights some of these areas. It can be difficult to delineate what does or does not constitute a colony upon gross examination with the naked eye. With each new cell line and treatment condition, this threshold may require recalibration. Objectively applying the then-established standard of counting colonies above 50 cells/colony across different treatment conditions proves complicated as well. Any lapse in standardization during data collection, results in the potential introduction of selection bias which can significantly affect results. For example, even with training, interobserver variability for manual colony counter-pen counting was high when controlling for growth conditions (Figure 1B). Attempting to manually pen count colonies introduced bias when compared to counting under a microscope due to the difficulty in standardization of the procedure (Figure 2B, D). With 2 observers counting the same plate, there was approximately 35% variability introduced and/or unaccounted for based on R2 analyses (Figure 1B). Furthermore, manual pen counts compared to microscopic counts of colonies revealed systemic bias between the 2 methodologies when attempting to adhere to the threshold of 50 cells/colony (Figure 2B, D). The fact colony sizes of similar cell counts can differ in size based on cell line morphology (ie, FA1 vs 1131 cell lines) and treatment conditions that introduce molecular changes such as apoptosis and pyknosis further complicate this process.
Additionally, manual counting exhibited a biphasic bias in relation to the magnitude of measurement (low vs high growth, Figure 2B, D). Essentially, observers tend to overestimate colony counts in low-growth conditions and underestimate counts in high-growth conditions.
Here, we also demonstrated how a strong Pearson correlation coefficient between observers (Figure 1A) or between methodologies (Figure 2A, C) does not necessarily correspond with an unbiased interchangeability of 2 different methods for measuring. The correlational analyses were susceptible to misidentifying biphasic bias relationships. The use of Bland–Altman analyses to examine potential biases in this technique (Figure 2B, D) allowed us to uncover areas where researchers can focus their efforts to standardize data collection and protect data stringency.
In juxtaposition to relying solely upon correlational analyses, comparing the automated algorithm 7 to microscopic colony counts revealed no systematic bias between measurements (Figure 4D). However, the relatively low R2 value indicates the lack of bias may not represent a true correlation (Figure 4C). This illustrated the utility in utilizing both Bland–Altman and correlational when analyzing the relationship between different measurement techniques. Furthermore, while percent area and signal intensity were comparable substitutes for MTT analyses when attempting to identify IC50 values, 7 they may not be the most optimal option for measuring clonogenicity. Thus, clonogenicity and proliferation may be considered independent variables during analysis when utilizing these methodologies.
Based on our findings regarding consistency in manual data collection, and our interest in a more efficient measurement technique, we combined the algorithm by Guzmán et al and software available in ImageJ to efficiently collect colony counts using our standardized threshold of 50 cells/colony. We selected the Guzmán et al method with the presumption that software that automatically thresholds the clonogenic assays would eliminate one potential source of bias in comparison to performing this step manually. From this point, the process utilizing ImageJ software demonstrated selecting colonies based on size (pixels2) and circularity performed at a level comparable to the microscopic counting technique across multiple observers and treatment conditions (Figure 5). In developing this technique, our reasoning behind training the program using microscopic colony counts as opposed to manual counter-pen counts was because the microscope method demonstrated higher interobserver and intraobserver reliability under a variety of experimental conditions (Figure 2). This semiautomated technique produced high correlation values across multiple observers (Figure 5A, B) with no evidence of significant bias between the semiautomated algorithm and microscopic techniques (Figure 5C, D).
We discovered multiple benefits to changing to a semiautomated technique. Foremost, potential bias was significantly reduced when comparing this new technique to microscopic counting (Figure 5C, D) via Bland–Altman analysis. This Bland–Altman analysis also served as evidence that selecting colonies based on the parameters of their size (pixels2) closely corresponded with microscopic colony counts. Setting parameters based on colony size (pixels2) resulted in overall better performance compared to manual counting with no evidence of bias when compared to colony counts using a microscope (Figure 5C, D). In contrast, the same level of performance was not observed when comparing microscopic counts to manual counts (Figure 2B, D). Additionally, the labor-intensive process of counting colonies under a microscope and then identifying the corresponding pixelated dimension values is not necessary with semiautomated image analysis techniques. Rather, this study serves as evidence where selecting colonies is based on size (pixels2) and circularity is best simulated microscopically by counting colonies that adhered to a standardized threshold (cells/colony). We conclude counting colonies within the parameters of pixel size and circularity is an interchangeable method to the labor-intensive, but accurate, microscopic technique (Figure 5C, D).
The constellation of these findings indicated how relying upon manual colony-pen counting may be suboptimal considering the bias of potentially over or underreporting data. Using the Bland–Altman plot in conjunction with correlational analyses was able to identify suitable, interchangeable measurement techniques that were free of bias with respect to magnitude of measurement. Our study also demonstrated how solely relying upon a strong correlational analysis may result in the misidentification of biases between different measurement techniques, thus illustrating the need for a Bland–Altman analysis to guard against this (Figure 2B, D). Indeed, others have also found the use of correlation between methods can be misleading and should not be relied upon for assessing method comparability. 14
Limitations of the study include nonuniform light distribution when scanning the clonogenic assays, resulting in decreased signal-to-noise ratio from shadow artifact. Colony growth is also a confounding variable to be considered; images scanned earlier in the clonogenic process may differ in counts from those scanned at further development of colony growth based on threshold detection and segmentation of overlapping colony growth. Finally, the semiautomated process described in this manuscript may result in interobserver variability and human error.
When considering these findings, training algorithms based on manual pen-counted data may not be optimal. An algorithm that reflects manual pen-counted data may result in systematic differences when compared to the semiautomated algorithm presented here which most closely reflects true colony counts (Figure 5E). In response to this, the authors encourage the development of algorithms with parameters set to select colonies based on the size as this most closely reflects microscopic colony counts and demonstrated no significant bias between techniques (Figure 5C, D). It is also more in line with the original intent of the clonogenic assay and colony counting; identifying colonies based on a standardized threshold of >50 cells/colony.1,2 This technique may allow for a more efficient, yet accurate and reliable, process of quantifying a cell line's clonogenic potential and response to therapeutic treatments.
Conclusion
Counting cell colonies is a rapidly growing field of research that has implications in a multitude of disciplines like estimating the colony forming unit (CFU) potential in various microbiological environments like agriculture and food safety,15,16 evaluating the cytotoxicity of different treatment agents, 17 stem cell and gene-therapy research,18,19 and development of different antibacterial therapies. 20 Our findings are relevant to these various fields. We demonstrated an outline for processing images and selecting parameters to generate a colony counting technique which, most notably, is interchangeable without systemic bias in comparison to counting colonies of a predetermined size under a microscope. Stringent verification of the interchangeability of a new measurement technique in comparison to the accepted gold-standard is of the upmost importance when considering the implications for the accuracy of measurements in the aforementioned research disciplines.
Lastly, an area for future improvement and implementation of this computer-assisted approach into the clinical setting may be through the utilization of self-organized systems. Service continuity can be enhanced by designing self-organized systems, with a nonfixed structure, able to change their structure and organization as well as adaptively react to internal and external environment changes. 21 Service-oriented networks, nodes which communicate through stimulation or suppression chains, are particularly useful in clinical operational scenarios where continuity of a service, such as the one proposed in this work, is optimal. Clinical effectiveness of this approach is demonstrated in the work by Conti et al 21 evaluating magnetic resonance angiography. The enhanced processing execution and speed-up factor may provide a more viable integration of automated clonogenic assay counting into the clinical setting. For example, providing accurate quantitative feedback on bacterial or carcinogenic colony response to therapeutics in a manner that is timely would be beneficial in guiding real-time clinical decision making.
Footnotes
Acknowledgements
The authors would like to thank Laurie Kay Stromberg for the use of her Cricut® Maker 3.
Ethical Statement
This study, involving human cell lines, was deemed to be IRB exempt per University of Minnesota IRB guidelines (seen in HRP-312 worksheet) stating “information, which may include information about biospecimens, is recorded by the investigator in such a manner that the identity of the human subjects cannot readily be ascertained directly or through identifiers linked to the subjects.”
Declaration of Conflicting Interests
The author(s) declared no potential conflicts of interest with respect to the research, authorship, and/or publication of this article.
Funding
The author(s) disclosed receipt of the following financial support for the research, authorship, and/or publication of this article: This work was supported by the NCI/NIH, American Cancer Society Institutional Research Grant, Lion's 5M Hearing Center Grant (grant number P30 CA77598-07, IRG-58-001-40IRG44).