
Abstract
Background
A ‘one stop shop’ model for multifactorial risk factor management in a culturally sensitive environment may improve cardiovascular disease and diabetes prevention. A full biochemical profile for cardiovascular disease risk assessment includes a lipid profile, glucose, glycated haemoglobin and urine albumin creatinine ratio measurements. This may require the use of more than one point of care testing instrument.
Methods
Individuals who attended a community cardiovascular disease risk screening or an audit programme of the diabetic care pathway in the community were sampled. Bland–Altman and Deming regression plots were used to assess agreement between methods for total cholesterol, high-density lipoprotein cholesterol, triglycerides, glycated haemoglobin and urine albumin creatinine ratio.
Results
There was good agreement between the Afinion AS100 analyser, Cholestech LDX and the laboratory methods for total cholesterol, high-density lipoprotein cholesterol and triglycerides (n = 232). The Afinion AS100 agreed well with the laboratory method for glycated haemoglobin (n = 255) and urine albumin creatinine ratio (n = 176). There was statistically significant bias (p = 0.03 to <0.0001) for several measurements. However, these were judged not to be clinically relevant. Specifically for the total cholesterol and high-density lipoprotein cholesterol values, we obtained good agreement (weighted kappa: 0.91 and 0.94 for the Afinion AS100 vs. Cholestech LDX and Afinion AS100 vs. laboratory method, respectively) for cardiovascular disease risk calculation using QRISK2.
Conclusions
Point of care testing can support a ‘one stop shop’ approach by providing rapid, reliable results. The Afinion AS100 analyser provides a multi-analyte platform and compares well with laboratory-based methods and another well-established point of care testing analyser.
Keywords
Introduction
Cardiovascular disease (CVD) and diabetes mellitus (DM) are major public health problems worldwide. 1 Globally, CVD remains the leading cause of morbidly and premature mortality. 1 In the UK, CVD accounts for approximately 32% of the deaths annually. 2 Furthermore, patients with DM have a five-fold increased risk of developing CVD compared with those without DM. 3 Early diagnosis of DM and intervention are essential to reduce the risk of microvascular and macrovascular complications and their progression. 4 The National Health Service (NHS) Vascular Risk Assessment and Management programme was launched in 2009 offering opportunistic screening for individuals aged between 40 and 75 years to identify individuals at high risk of developing CVD and hitherto undiagnosed DM. 5 Each NHS health check combines several measurements which include body mass index (BMI), family history of CVD, smoking status, blood pressure (BP) and a blood test for lipids and glucose. These variables are entered in an algorithm to calculate 10-year CVD risk. It is difficult to measure these variables (especially glucose levels) under fasting conditions in opportunistic screening. Therefore, the NHS health check included the use of glycated haemoglobin (HbA1c ≥ 48 mmol/mol) for the diagnosis of DM. 6
Point of care testing (POCT) has an advantage over routine laboratory-based testing as it provides rapid results. This allows ‘on the spot’ discussion with the patient and early intervention as part of opportunistic screening in a community setting. Measurement of lipids, glucose and HbA1c is required for these programmes. In the past, these measurements required at least two separate POCT analysers. For example, a Cholestech LDX (Alere San Diego Inc., San Diego, CA, USA) for lipids and an Afinion AS100 (Alere Technologies AS, Oslo, Norway) for measuring HbA1c, increasing the complexity of screening programmes. The Cholestech LDX 7 can only measure the lipid profile and glucose thus limiting its use for screening and monitoring for DM. In contrast, the Afinion AS100 is now a multi-analyte platform capable of measuring the lipid profile, HbA1c and urine albumin creatinine ratio (UACR).
We carried out an evaluation of the Afinion AS100 analyser in a screening programme in a community setting. The use of the Cholestech LDX to measure lipids and glucose has been previously validated.7–9 The purpose of the present study is to evaluate the Afinion AS100 analyser. Therefore, the lipid measurements using the Afinion AS100 analyser vs. Cholestech LDX and the laboratory method are compared. We also assessed and compared UACR and HbA1c (not available on the Cholestech LDX) measured by the Afinion AS100 with the hospital laboratory methods.
Material and methods
Participants
This study included individuals attending a CVD risk screening programme or an audit of the diabetic care pathway in the community. Both programmes were held at a Hindu Temple in North London. Details of this CVD risk programme have been described.7,10
For the diabetic care pathway group, we assessed compliance with the National Institute for Health and Care Excellence care processes pathway. 11 Consent was obtained from each individual for participation in this programme. All individuals underwent the following measurements: anthropometry, BP, lipid profile, HbA1c, creatinine and UACR.
Sample collection
Participants had both a finger prick capillary blood sample for POCT and a venous blood sample (serum gel and fluoride oxalate) taken. They also provided a spot urine sample. None of the participants had fasted overnight.
Venepuncture was performed with the subject in the sitting position. Blood was drawn directly into dedicated evacuated tubes (BD Diagnostics-Preanalytical Systems, Oxford OX4 3LY, UK, serum gel tube for lipids; sodium fluoride tube for HbA1c) using aseptic precautions. Blood samples for lipid analysis were centrifuged and separated in the community setting before sending to the hospital laboratory The samples were kept in an insulated container and were transported by medical courier (within 4–6 h after phlebotomy) to the hospital laboratory for analysis. The spot urine samples were collected in 20 mL universal containers (Thermo Fisher Scientific, Hemel Hempstead, Hertfordshire, UK). Urine samples were sent at the same time as the blood samples. All samples were analysed on the next day.
Measurement of lipid profile, HbA1c and UACR
Measurement by POCT
A finger prick (capillary blood) sample was analysed on Cholestech LDX and Afinion AS100 analysers to obtain a full lipid profile (total cholesterol [TC], triglycerides [TG] and high-density lipoprotein cholesterol [HDL-C]) and HbA1c (Afinion AS100 only) according to the manufacturers’ instructions. The low-density lipoprotein cholesterol (LDL-C) concentration is calculated by the Cholestech LDX and Afinion AS100 using the Friedewald equation (LDL-C = TC − HDL-C − TG/2.19) in mmol/L. The Friedewald equation is only valid in the fasting state, and therefore, LDL-C values are not shown because the majority of the samples were collected in the non-fasting state. LDL-C is not incorporated in the risk calculation engine used.
Urine albumin, creatinine were measured using spot urine samples, and the UACR was calculated by the Afinion AS100 analyser.
The measuring ranges for lipids (Afinion AS100) are TC = 2.59–12.95, HDL-C = 0.39–2.59 and TG = 0.51–7.34 mmol/L. The corresponding values for the Cholestech LDX are TC = 2.59–12.9 mmol/L, HDL-C = 0.39–2.59 and TG = 0.51–7.34 mmol/L. The measuring range for HbA1c is 20–140 mmol/mol. The measuring ranges for urinary albumin and creatinine are 5–200 mg/L and 1.5–30.0 mmol/L, respectively. The manufacturer suggests diluting (1:4) the samples using 0.9% saline if the albumin or creatinine measurements are out of range.
The Cholestech LDX measures HDL-C using dextran sulphate-Mg2+ precipitating reagent. 12 The Afinion AS100 and the laboratory-based methods use anti-human apolipoprotein B (apoB) antibody which binds to apoB. Both analysers measure TC using the cholesterol oxidase-peroxidase method. TG (both POCT analysers) is measured by an enzymatic colorimetric method.
HbA1c assay is based on boronate affinity which involves the formation of complex between blue boronic acid conjugates and the cis-diols of the precipitated HbA1c. It is not affected by several Hb variants (www.alere.co.uk/www.ngsp.org). We confirmed these findings for HbS, HbE, HbC and HbD (analysing 1 to 8 samples for each of these Hb variants) using the Afinion AS100. Urine albumin and creatinine measurements are based on an immunometric membrane flow through assay and an enzymatic colorimetric procedure to measure albumin and creatinine, respectively.
Quality control for POCT
An appropriate quality control (QC) programme (internal and external) was set up to include local laboratory involvement and the hospital POCT committee. Training of the individuals involved in testing, as well as an internal QC, was put in place according to standard operating procedures. The lipid internal QC materials for the Cholestech LDX (Cholestech LDX Multi-Analyte control, Alere, Stockport, Cheshire, UK) and the Afinion AS100 analyser (Afinion lipid panel control, Alere, Stockport, Cheshire, UK) were run at every screening session. These QC materials available for the Afinion AS100 were as level 1 (low: TC = 3.76–5.64; HDL-C = 0.77–1.23; TG = 1.29–2.21 mmol/L) and level 2 (high: TC = 5.02–7.54; HDL-C = 1.15–1.83; TG = 2.27–3.89 mmol/L). The corresponding values for the Cholestech LDX were as level 1 (low: TC = 3.36–4.99; HDL-C = 0.57–1.18; TG = 1.08–1.60 mmol/L) and level 2 (high: TC = 5.20–7.93; HDL-C = 1.27–2.02; TG = 2.19–3.47 mmol/L). These values vary slightly with the lot number. All QC values were within the acceptable limits designated by the manufacturer. In addition, an internal HbA1c QC provided by the manufacturer (Afinion HbA1c control, Alere, Stockport, Cheshire, UK) at level 1 (36–51 mmol/L depending on lot) and level 2 (57–77 mmol/mol depending on lot). A UACR (Afinion ACR control) QC was also run for the Afinion AS100 analyser. Level 1 (low: albumin = 8.9–16.5 mg/L; creatinine = 6.3–9.6 mmol/L) and level 2 (high: albumin = 60.3–112.1 mg/L; creatinine = 17.1–23.1 mmol/L).
The three Cholestech LDX analysers used were registered with the Welsh External Quality Assurance Scheme. Performance characteristics of the Cholestech LDX and Afinion AS100 analysers such as analytical limits, imprecision and interference factors are outlined in the manufacturers’ Procedure Manuals.
Measurements by laboratory method (reference method)
The venous serum gel samples were analysed for lipids, sodium fluoride whole blood was analysed for HbA1c and urine was analysed for UACR at the Clinical Biochemistry Laboratory, Royal Free NHS Foundation Trust. (TC, TG and HDL-C) and UACR were analysed in this laboratory using a Roche Modular P® analyser and Roche® reagents (Roche Diagnostics, GmbH, D-68298 Mannheim, Germany).
The measuring range for HbA1c is 20–151 mmol/mol. The measuring ranges for urine albumin and creatinine are 3–400 mg/L and 0.36–57.5 mmol/L, respectively. For the calculated UACR, the reference range is <2. 5 mg/mmol for males and <3.5 mg/mmol for females.
The HDL-C plus third-generation assay is based on direct determination of HDL-C in human serum and plasma using polyethylene glycol-modified enzymes and dextran-sulphate. TC measurement was based on cholesterol oxidase-peroxidase method. TG measurement was based on the principle of rapid and complete hydrolysis of TG (using lipoprotein lipase) to glycerol followed by oxidation.
HbA1c was measured using ADAMS™ A1C HA-8180 V analyser (A. Menarini Diagnostics, Italy) by high-performance liquid chromatography. There were no Hb variants detected that could interfere with this method (as checked by the ADAMS™ A1C HA-8180 V analyser using the variant mode of this equipment, http://www.arkray.co.jp/english/products/daibetes.html). Urine albumin measurement was based on an immunoturbidimetric method (Cobas®, Roche Diagnostics, GmbH, D-68298 Mannheim, Germany), and creatinine was measured by the Jaffe method (Cobas®, Roche Diagnostics, GmbH, D-68298 Mannheim, Germany).
QC for laboratory method
The internal Biorad QC Roche material was run daily for the Roche Modular P® analyser for lipids and UACR. The Glyco Hb Control was used for the ADAMS™ A1C HA-8180 V for HbA1c. All QC values were within the acceptable limits designated by the manufacturer. The laboratory is registered with the UK National External Quality Assurance Scheme and Randox International Quality Assessment Scheme.
Imprecision
For the Afinion AS100, within day imprecision was determined by 10 replicate analyses of each of the two levels of QC material.
CVD risk calculation
CVD risk was calculated in the primary prevention cohort using the QRISK2 risk engine (www.qrisk.org). The batch calculator for QRISK2 was used to derive the CVD risk in individuals in the age range of 25–84 years using following parameters: age, gender, ethnicity, postcode (when available), smoking status, family history (<60 years in first degree relative), systolic BP, BMI and TC/HDL-C ratio.
Statistical analysis
Data were analysed using Analyse-It (Analyse-It Software Ltd, Leeds, UK). Bland–Altman plots and Deming regression plots were used to assess agreement between methods for TC, HDL-C, TG, HbA1c, urine albumin, urine creatinine and UACR.13,14 The p values are shown within the text and/or tables. Weighted Kappa statistics were used to calculate agreement between risk categorization based on POCT and the hospital laboratory values. Kappa is an index which compares the agreement against that which might be expected by chance. Weighted kappa takes into account the extent to which the observations disagree. Its relevance is judged by using asymptotic standard error to construct a ‘t’ statistic to test whether the measure differs from 0. A kappa coefficient >0.75 was considered to represent excellent agreement, values from 0.4 to 0.75 indicate fair to good, and values <0.4 indicate poor agreement. 15
The Shapiro Wilk test for normality in addition to visual checks were performed using Analyse-It software. Results are expressed as mean ± SD or median and range, as appropriate.
Results
Comparison of POCT vs. laboratory values
Lipids
We had data from the Afinion AS100 analyser, Cholestech LDX and laboratory values for 232 participants who attended the community CVD Screen (n = 83) and Diabetic Care clinic (n = 149); 58.6% were males. The mean age of the participants was 56.1 ± 12.0 years.
Mean concentration of lipids using Cholestech LDX, Afinion AS100 and laboratory method.
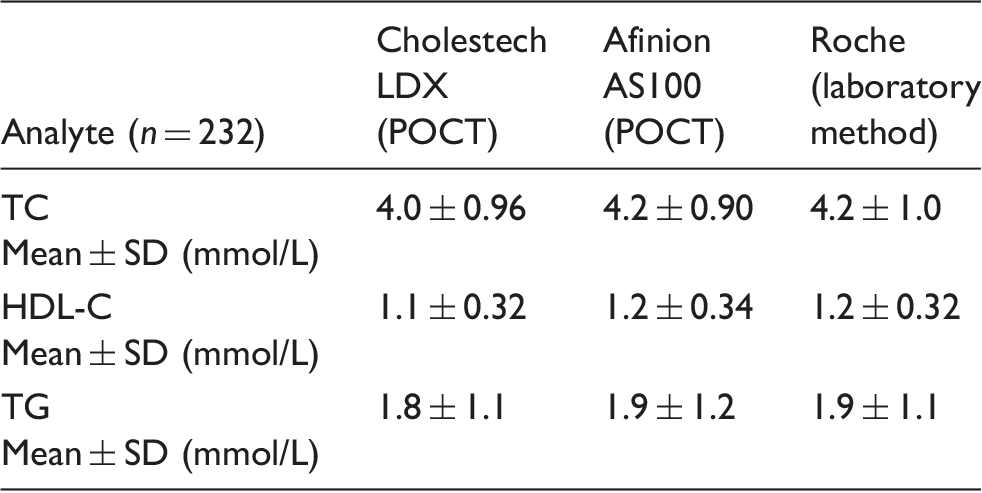
TC: total cholesterol; HDL-C: high-density lipoprotein cholesterol; TG: triglycerides; POCT: point of care testing.
The results were divided into tertiles for each biochemical parameter (TC, HDL and TG), and Bland–Altman Plots were used to assess the agreement and bias between methods (POCT Afinion AS100 vs. laboratory and POCT Afinion AS100 vs. POCT Cholestech LDX). The overall Deming regression of the analytes measured by the Afinion AS100, laboratory and Cholestech LDX are shown in Figure 1(a) to (c).
(a) Deming regression for TC, (b) Deming regression for HDL-C and (c) Deming regression for TG.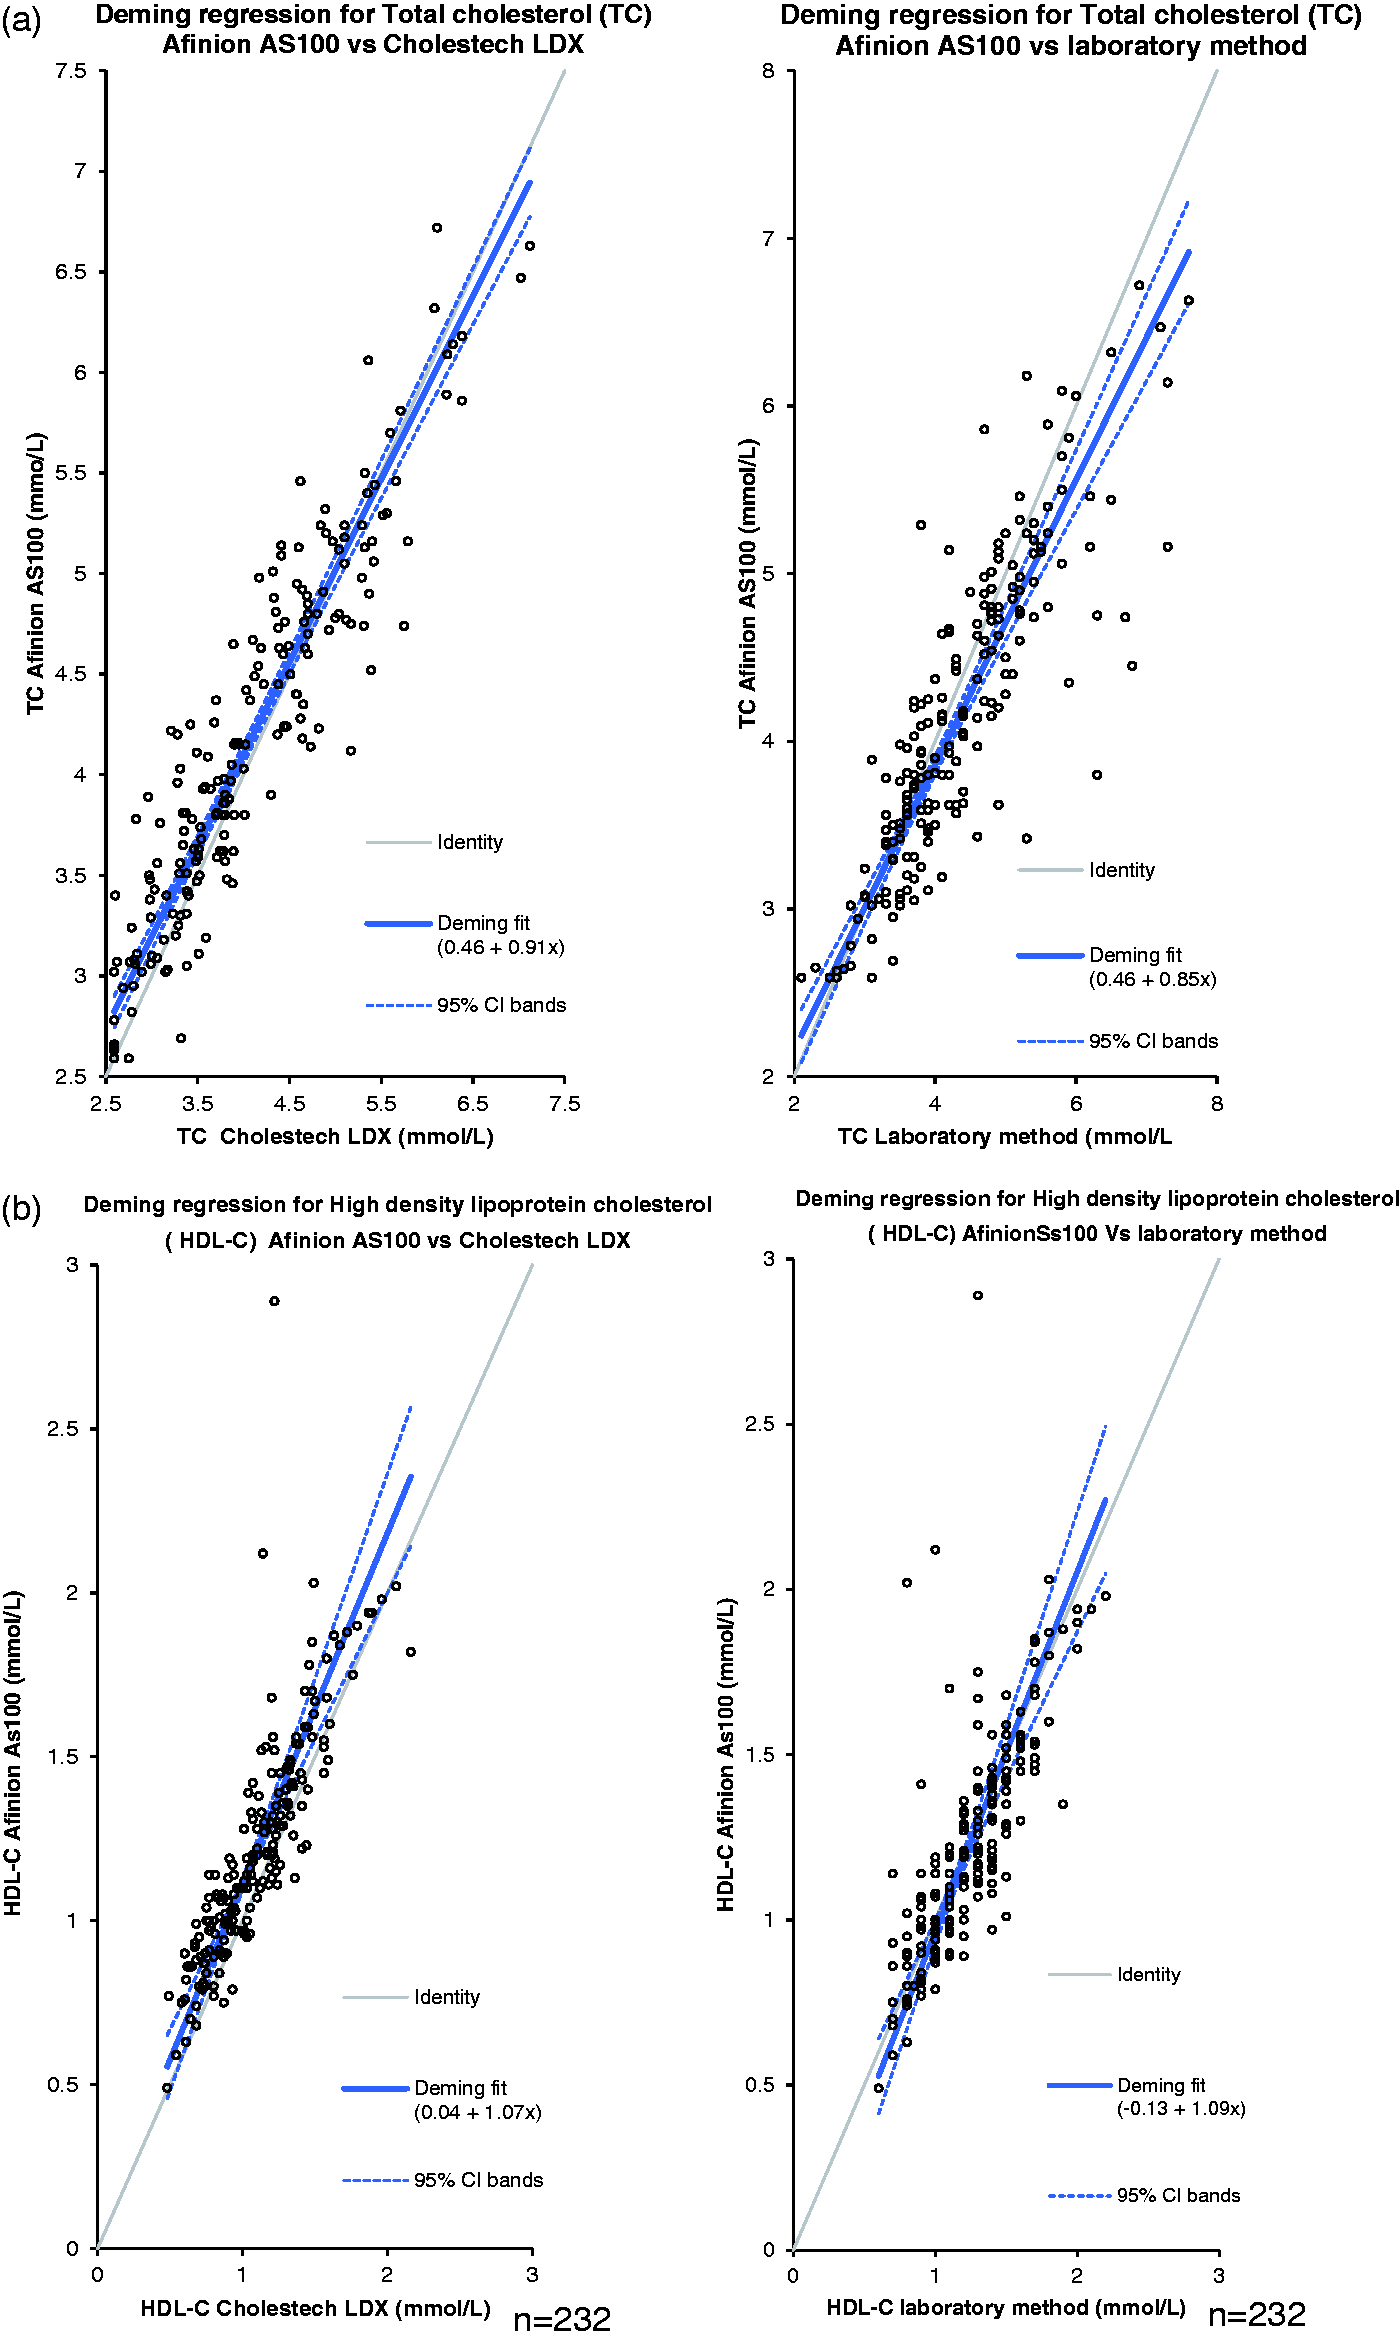
The use of the Cholestech LDX to measure lipids and glucose has been previously validated. 7 Therefore, in the present study, we only present the lipid measurements using the Afinion AS100 analyser vs. Cholestech LDX and the Afinion AS100 vs. the laboratory method.
Afinion AS100 vs. Cholestech LDX (Table 2(a))
Differences between Afinion AS100 and Cholestech LDX and Afinion AS100 and laboratory method measurements (using Bland–Altman plots).
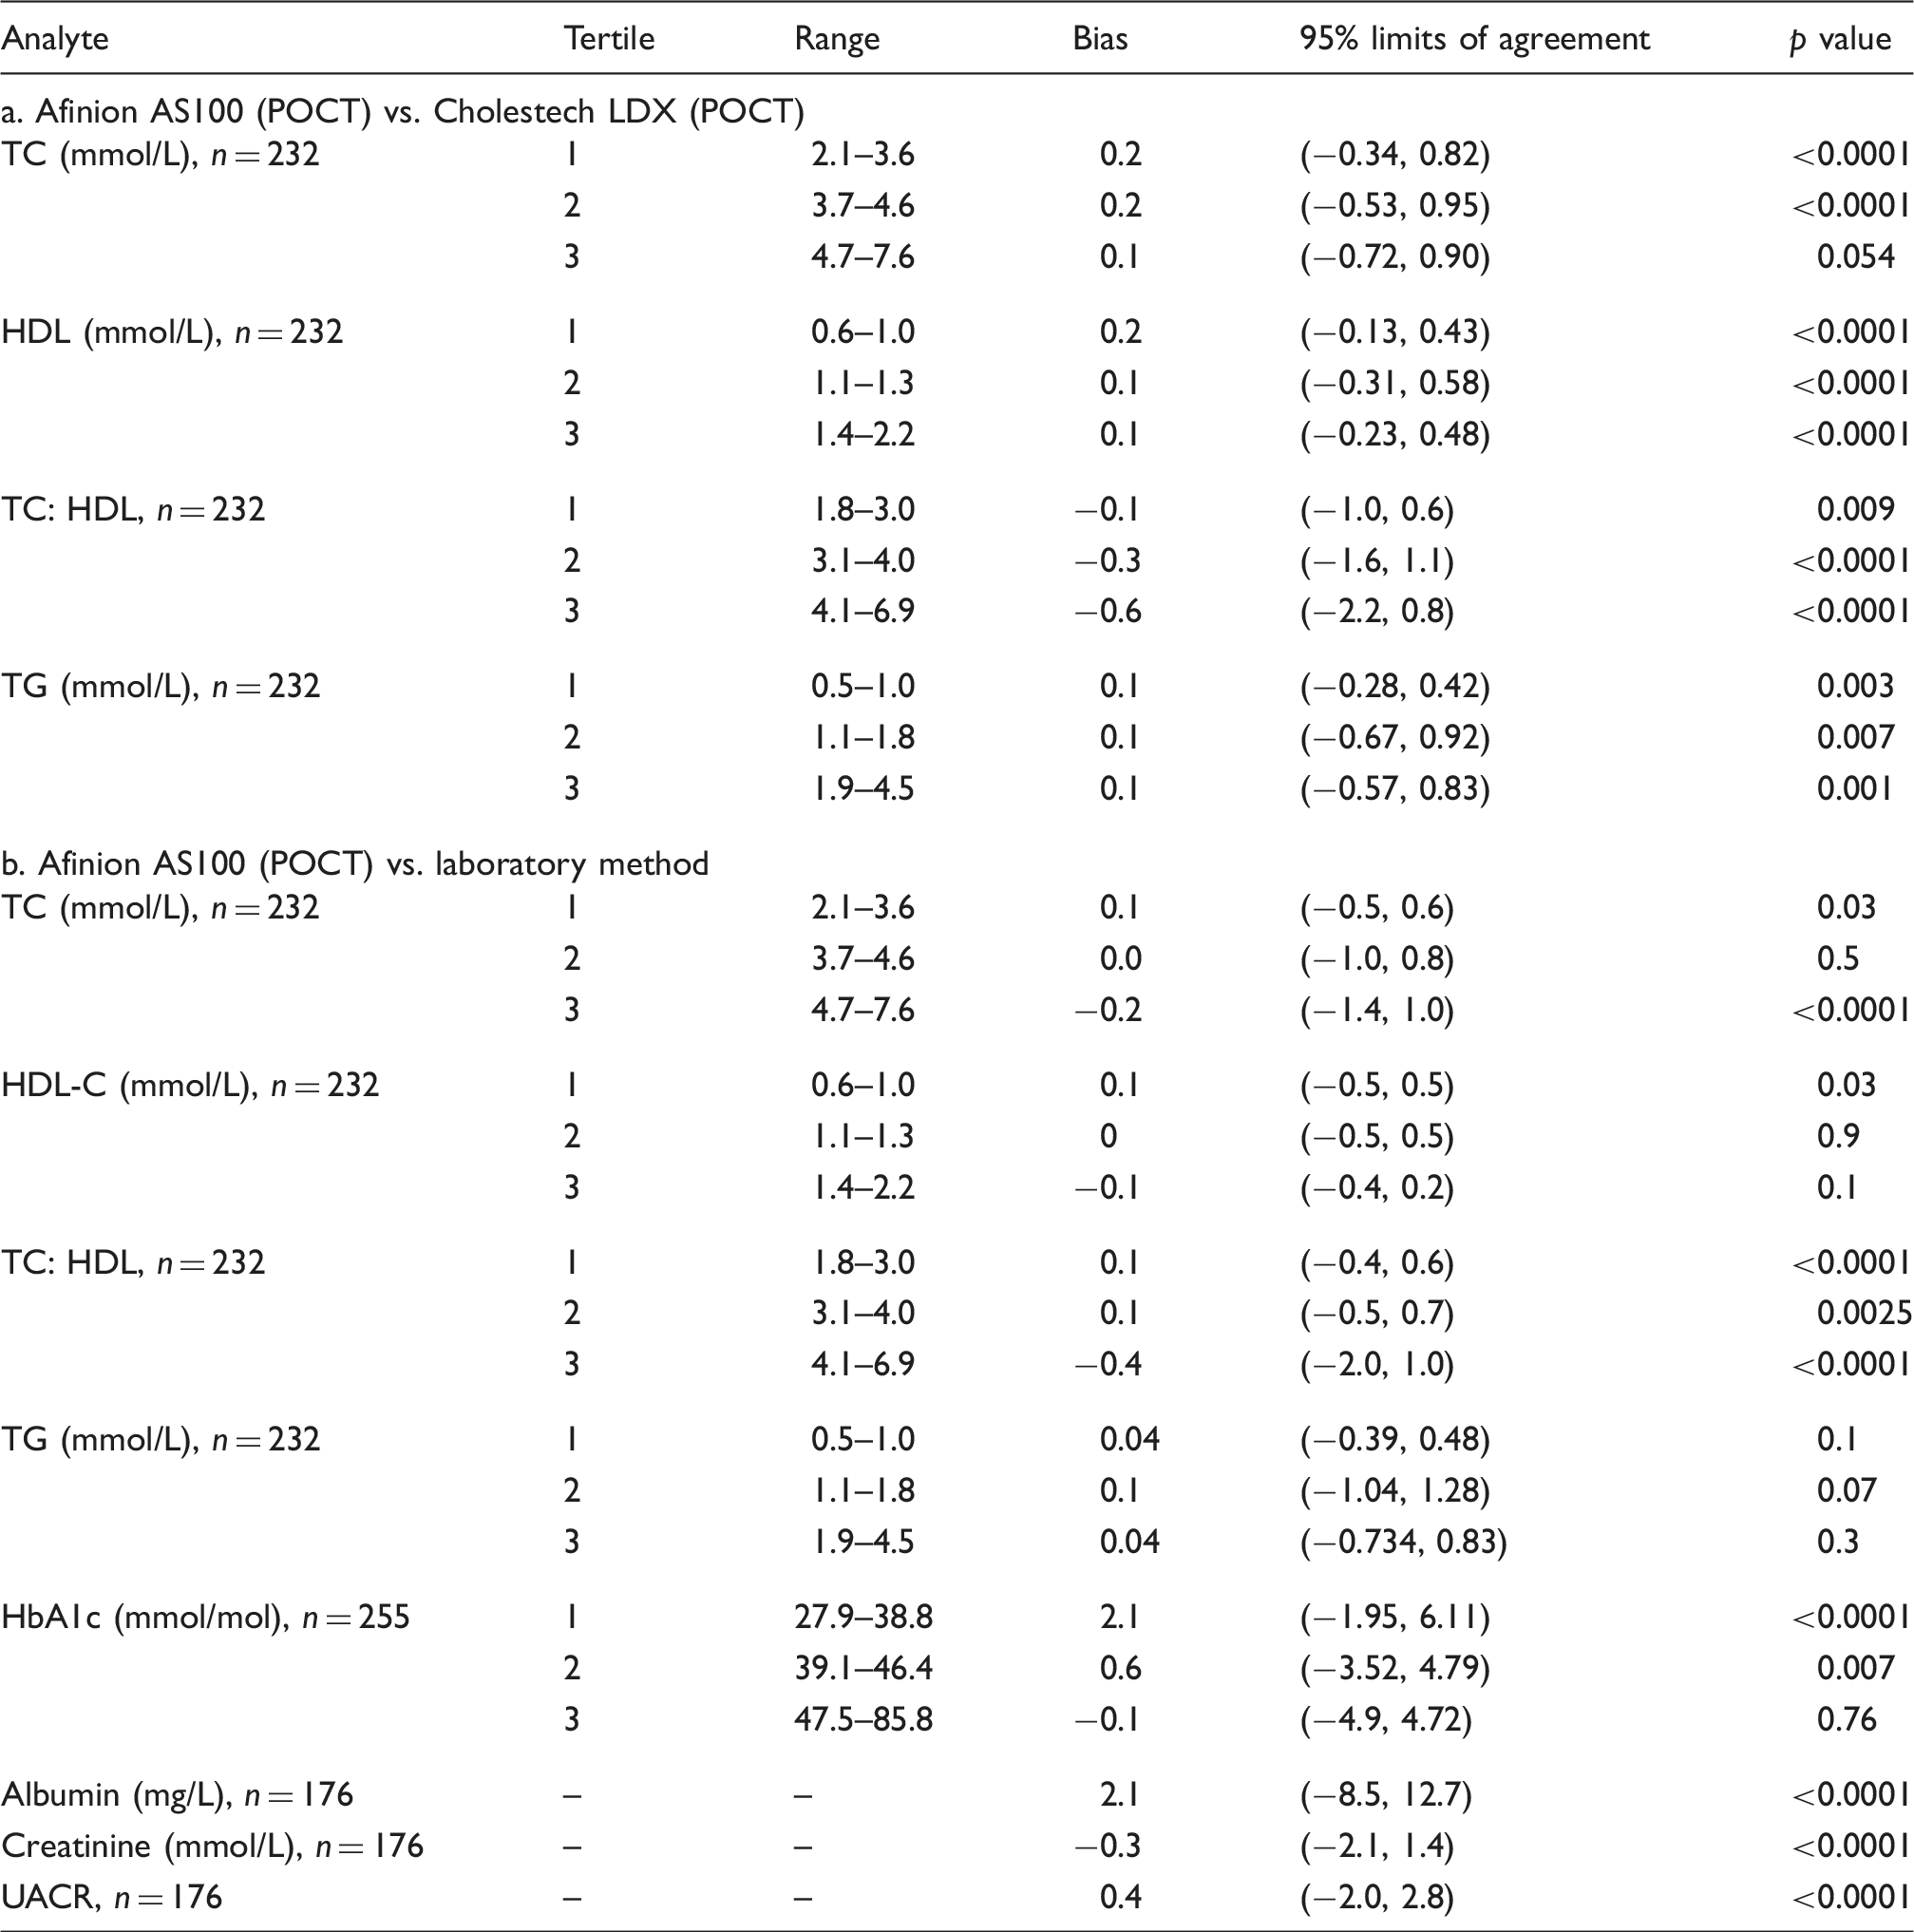
TC: total cholesterol; HDL-C: high-density lipoprotein cholesterol; TG: triglycerides; POCT: point of care testing; HbA1c: glycated haemoglobin; UACR: urine albumin creatinine ratio.
Assessment of between day and within batch imprecision for Afinion AS100 analyser.
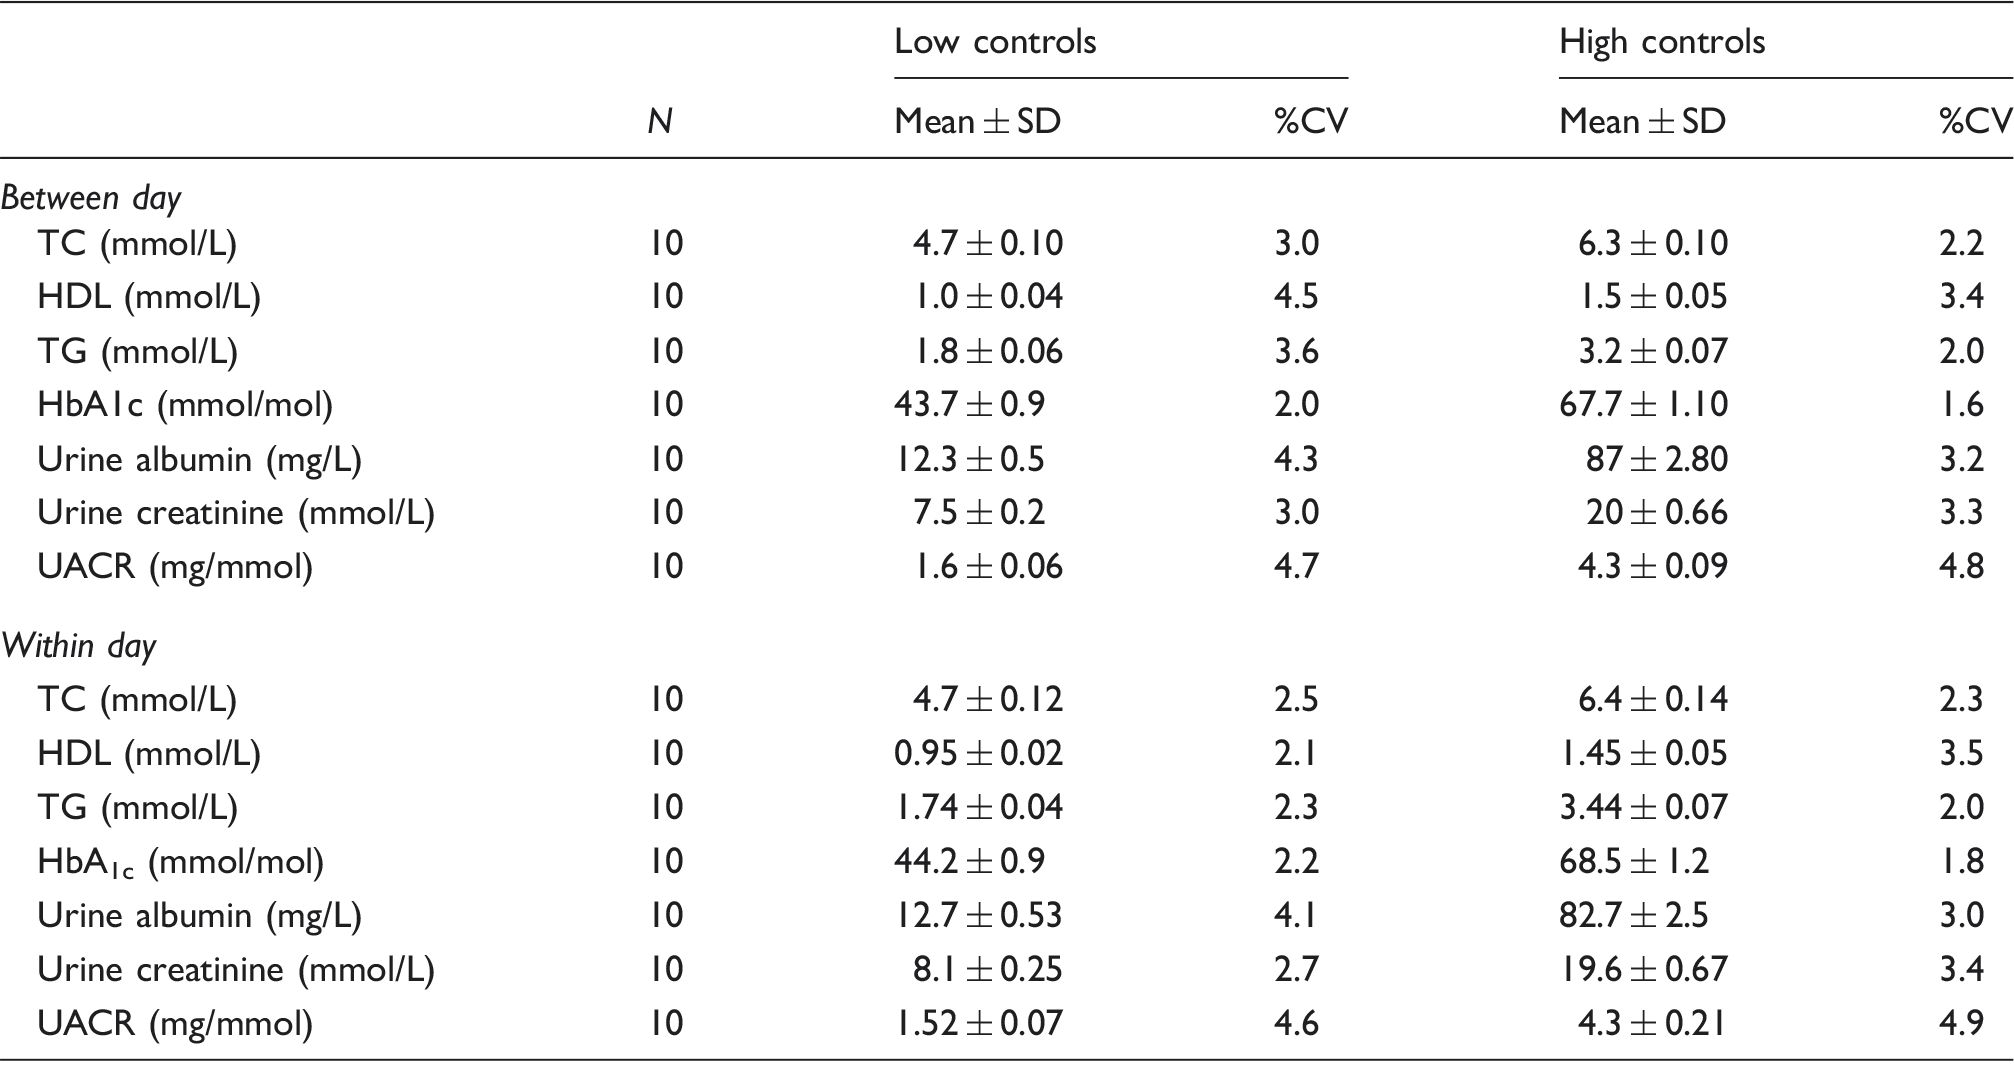
TC: total cholesterol; HDL: high-density lipoprotein; TG: triglycerides; UACR: urine albumin creatinine ratio; %CV: % coefficient of variation; SD: standard deviation; HbA1c: glycated haemoglobin.
The concentration-dependent bias was more evident for HDL-C at concentrations 0.6–1.0 mmol/L (i.e. the lowest tertile) (Table 2(a)). At these HDL-C concentrations, the Afinion AS100 overestimated by 0.2 mmol/L (p < 0.0001). The concentration-dependent bias decreased at higher tertiles but retained significance.
The concentration-dependent bias for TG was negligible (0.1, 0.1 and 0.1 mmol/L) in tertiles 1, 2 and 3, respectively, with no significance (Table 2(a)).
Afinion AS100 vs. laboratory method (Table 2(b))
Using Bland–Altman plots, the concentration-dependent bias for TC was a 0.2-mmol/L (p < 0.0001) underestimation at the third tertile (4.7–7.6 mmol/L) (Table 2(b)).
The concentration-dependent bias for HDL-C was negligible (0.1, 0 and −0.1 mmol/L) in tertiles 1, 2 and 3, respectively, with significance only in tertile 1 (Table 2(b)). The concentration-dependent bias for TG was negligible (0.0, 0.1 and 0.0) in tertiles 1, 2 and 3, respectively, with no significance (Table 2(b)).
HbA1c
We had paired data (Afinion AS100 analyser and laboratory values) for 255 participants who attended the community CVD Screen (n = 113) and Diabetic Care clinic (n = 142); 57.2% were males and the mean age of the participants that had their HbA1c measured was 54.3 ± 13 years.
Afinion AS100 vs. laboratory method
The median HbA1c for all the study participants was 44 (39, 51) and 42 (38, 51) mmol/mol for the Afinion AS100 analyser (POCT) and laboratory method, respectively. Using Bland–Altman plots, the concentration-dependent bias was greatest at the lowest HbA1c tertile (27.9–38.8 mmol/mol). The Afinion AS100 overestimated the HbA1c by 2.1 mmol/mol (p < 0.0001) at this tertile. The concentration bias decreased at other tertiles with no significance at the highest tertile (Table 2(b)). Deming regression plots are shown in Figure 2.
Deming regression for HbA1c.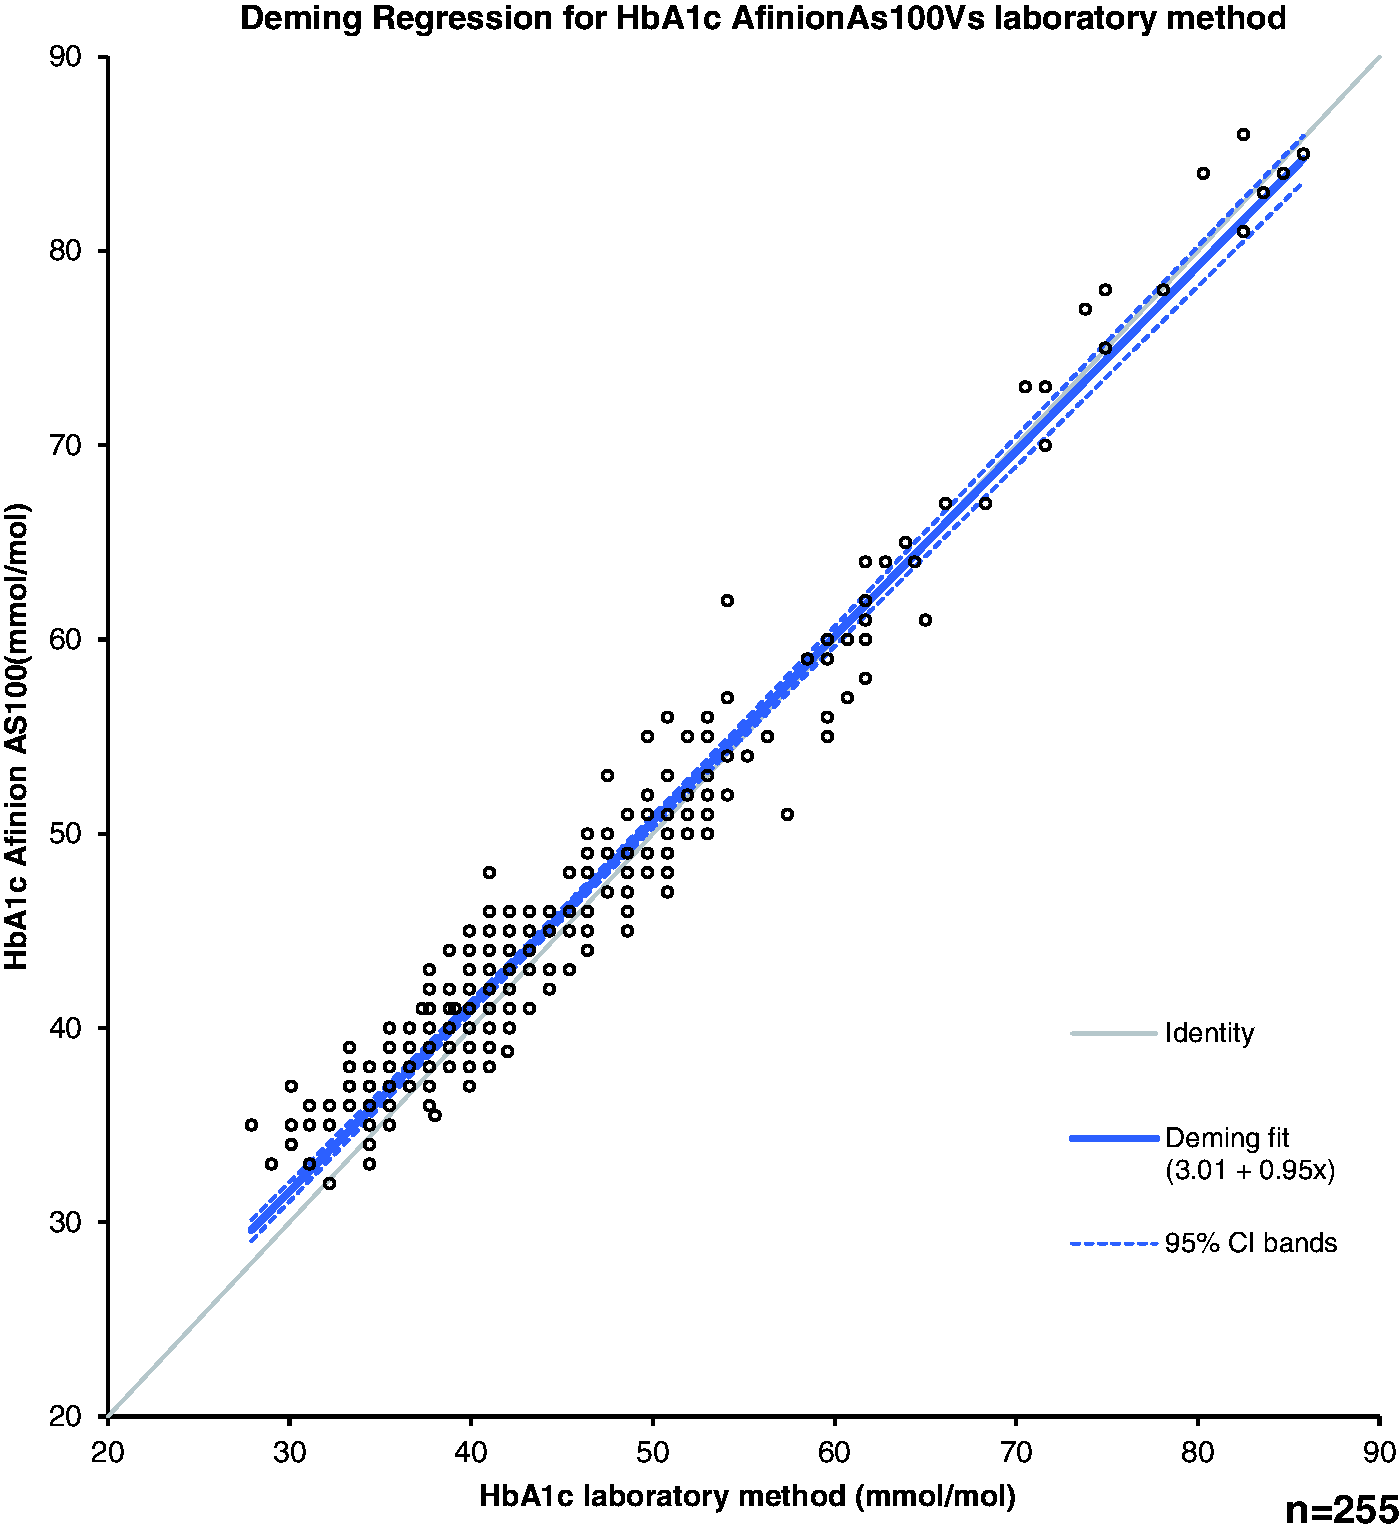
The Afinion AS100 and laboratory methods picked up similar numbers of new patients with suspected DM (6 and 5, respectively) from the CVD screening group. In the Afinion AS100 group, five patients were the same as the five identified by the laboratory method; one additional patient had an HbA1c of 49 mmol/mol using the Afinion AS100 method. Therefore, approximately 5% of the CVD screening group had HbA1c values ≥48 mmol/mol.
UACR
We had paired data (Afinion AS100 analyser and laboratory values) for 176 participants (after excluding 12 participants because their values were above the POCT measuring range), mean age 56.1 ± 12 years who attended the community CVD Screen (n = 40) and Diabetic Care clinic (n = 136); 57.2% were males. The mean age of the participants that had their UACR measured was. We did not carry out dilutions for the Afinion AS100 UACR values above the POCT measuring range.
Afinion AS100 vs. laboratory method
The median albumin, creatinine and UACR for all the study participants was 8.5 (5.0, 19.5), 6.5 (3.8, 11.1) and 1.8 (1.0, 3.2), respectively, for Afinion AS100. The corresponding values for the laboratory method are 7.5 (3.5, 17.9) for albumin, 6.8 (3.9, 11.5) for creatinine and 1.3 (0.7, 2.7) for UACR. The bias for albumin, creatinine and UACR for the Afinion AS100 compared with the laboratory method was 2.0 mg/L, − 0.1 mmol/L and 0.4 mg/mol, respectively. All the measurements were statistically significant when compared with the laboratory method (p < 0.0001) (Table 2(b)). Using cut-offs for male (>2.5 mg/mmol) and female (>3.5 mg/mmol), we identified four participants in the community CVD screen with increased UACR by the laboratory method and five participants using the Afinion AS100 method. All four participants identified by the laboratory method were also picked up by the Afinion AS100 method. Among those participants identified by both methods, two were hypertensive and one had an HbA1c of 49 mmol/mol. The additional patient identified by Afinion AS100 method was normotensive and had an HbA1c within the reference range.
In the diabetes group, 20 male (23%) had an ACR above the reference range by the laboratory method compared with 24 male (27%) by the Afinion AS100 method. For female, the corresponding values were 13 (27%) and 15 (31%).
Imprecision for POCT measurements (Table 3)
Lipids
The performance criteria recommended by the National Education Cholesterol Program, 16 for TC (≤3%) and HDL-C (≤6%) method imprecision were met by the Afinion AS100 at the two QC concentrations tested (see Material and Methods section). The between day imprecision of the AS100 using low controls were 3.0, 4.5 and 3.6%, respectively, for TC, HDL and TG. For the high controls, the corresponding values were 2.2, 3.4 and 2.0%.
HbA1c
For the low control, the coefficient of variation was 2.2 and 2.0% for within and between day runs, respectively. The corresponding values for the high control were, 1.8 and 1.6% for within and between day runs, respectively.
UACR
Urinary albumin: For the low control, the CV was 4.1 and 4.3% for within and between day runs, respectively. The corresponding values for the high control were, 3.0 and 3.2% for within and between day runs, respectively.
Urinary creatinine: For the low control, the CV was 2.7 and 3.0% for within and between day runs, respectively. The corresponding values for the high control were, 3.4 and 3.3% for within and between day runs, respectively.
UACR: For the low control, the CV was 4.6 and 4.7% for within and between day runs, respectively. The corresponding values for the high control were, 4.9 and 4.8% for within and between day runs, respectively.
CVD risk calculation (Table 4)
Cardiovascular risk was calculated (QRISK2) (www.qrisk.org) using the POCT and laboratory values. We categorized a 10-year risk of ≤10% as low risk, 11–19% as intermediate and ≥20% as high risk.
Classification differences in cardiovascular (CVD) risk using the QRISK2 engine based on Afinion AS100, Cholestech LDX and laboratory (Roche) values.
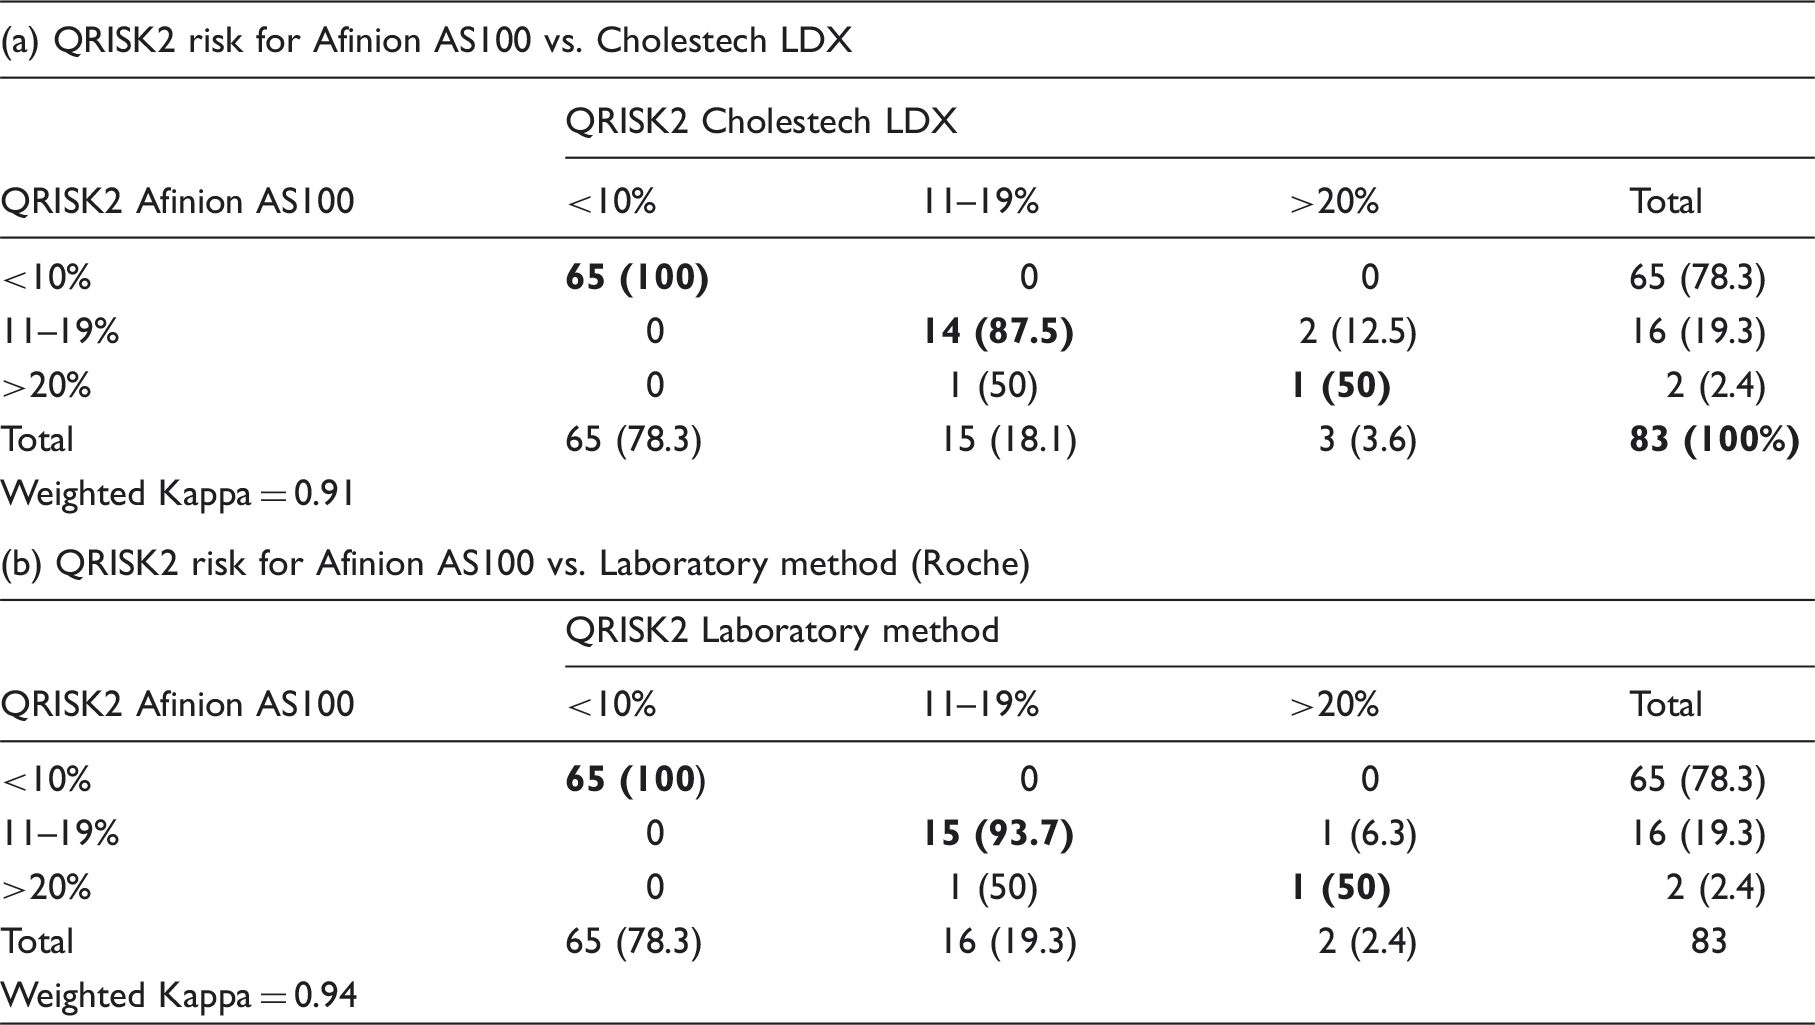
Table shows the number (%) of subjects in each risk category. Bold numbers represent the number participants who truly matched by both methods.
Discussion
To our knowledge, this is the first comprehensive evaluation of all the currently available analytes (lipid panel, HbA1c and UACR) measured by the Afinion AS100 analyser. By having the POCT measurements performed in community screening clinics, we evaluated ‘real world’ instrument performance.
The performance of the Afinion AS100 POCT analysers was compared with established laboratory methods (lipid panel, HbA1c and UACR) and the Cholestech LDX (lipid panel only). The Cholestech LDX has been previously evaluated compared with laboratory methods.7,17–20
Lipids
This study confirms that POCT using the Afinion AS100 analyser in a community setting yields results that agree well with those of established laboratory methods and the Cholestech LDX (a validated POCT analyser).7,17–20
HbA1c
The American Diabetes Association (ADA) guidelines (2015) 21 state that HbA1c POCT measurements should not be used for the diagnosis of DM. However, they state that POCT HbA1c is useful to adjust treatment as the results will be available in real time. In terms of diagnosis, the HbA1c method should ideally have a within laboratory CV < 2% and a between laboratory CV < 3%. 22 Our calculated CVs in the clinically relevant range for the Afinion AS100 HbA1c method were 1.8 and 1.6% for within and between batch measurements, respectively. The corresponding values for the laboratory method were 0.9 and 1.0%, respectively. Our Afinion AS100 HbA1c method CVs were slightly smaller than those reported by others.23,24
The Afinion AS100 and laboratory methods picked up similar numbers of new cases of DM (6 and 5, respectively) using HbA1c. We suggest that the Afinion HbA1c method is useful for screening for DM in the community but the diagnosis should be confirmed using a National Glycohemoglobin Standardization Program certified method in a laboratory that participates in a QC scheme and is certified by the local accrediting service.
Regarding bias, the Afinion AS100 HbA1c method was 0.1 mmol/mol lower than the laboratory method in the third tertile (47.5–85.8 mmol/mol) of the overall study population. This tertile represents the HbA1c values that would be diagnostic of DM or the range used for assessing glycaemic control of patients with DM. This represents a variation of approximately 0.2% of the median value in that tertile.
UACR
Microalbuminuria (MAU) was defined in this study as a UACR > 2.5 mg/mmol for males and >3.5 mg/mmol for females (see Material and Methods section). MAU is closely related to some CVD risk factors including age, smoking, hypertension, diabetes, dyslipidaemia and lack of physical activity.25,26 MAU is associated with impaired arterial and venous endothelium-dependent vasodilation in patients with Type 2 DM.27–29
In our study, in the non-diabetic population, the number of participants identified with an above reference range UACR was similar for the Afinion AS100 and laboratory methods. The percentage of raised UACR (about 10%) identified in this population may reflect a higher prevalence of MAU in non-diabetic South Asians than in Europeans. 30 This finding underlines the importance of screening for MAU in this population. For the diabetic population, the agreement between the Afinion AS100 and laboratory UACR methods was also good.
CVD risk calculation
Comparison of CVD risk (QRISK2) calculation (www.qrisk.org) was carried out using weighted kappa. A Kappa of 0.94 suggested a very good agreement between the Afinion AS100 and the laboratory method. Similarly, the kappa coefficient for the Afinion AS100 and the Cholestech LDX was 0.91. Based on our results, 19.3% of the participants are at a 10-year risk ≥11%. These participants may require intervention. Therefore, our screening programme detected a high yield of at risk South Asians. This is in agreement with the observation that South Asians are a high-risk population.7,31
Advantages and limitations
Both the POCT analysers are compact, portable and require little user maintenance but with narrower analytical ranges compared with laboratory methods. For both analysers, the reagent cassettes and QC material need to be refrigerated for long-term storage. However, they are stable for one month at room temperature. Results can be expressed as mmol/L or mg/dL. It is important to note that operators can accidentally alter the units.
Both experienced laboratory personnel and the other operators found the Afinion AS100 and the Cholestech LDX easy to use. The quality of the sample is an important factor which can influence POCT test results. The collection devices are supplied with both POCT instruments. The Afinion AS100 analyser has an inbuilt capillary system which forms a part of the cassette. The Cholestech LDX samples need to be delivered to the cassettes using a capillary and plunger. Thus, there are more user dependent steps for the Cholestech LDX compared with the Afinion AS100. Sample collection can be highly user dependant: an adequate amount of free flowing blood must be carefully obtained without excessively ‘milking’ the finger which can cause haemolysis and/or haemodilution or haemoconcentration of the sample. The operator must also avoid introducing air bubbles into the collection device so that the correct sample volume is analysed. Training and competency assessment are essential to ensure that users are capable of consistently obtaining appropriate samples.
Cost-effectiveness needs to be assessed by comparing POCT vs. hospital laboratory methods. This was beyond the scope of the present study.
Conclusions
We conclude that the Afinion AS100 provides valid prompt results allowing immediate feedback. This can enhance positive interaction between health-care provider and patient. The Afinion AS100 can be used for initial screening of risk factors in a CVD risk programme, in addition to monitoring (including DM) patients with the advantage of additional analytes (i.e. HbA1c and UACR).
Footnotes
Acknowledgements
We thank the staff of B.A.P.S. Healthcare, Swaminarayan Mandir, Neasden, London, for their support. Part of this work was partially presented at a HEART UK meeting in 2014 held in Warwick, UK.
Declaration of conflicting interests
DRN has received grants from Pfizer (Pfizer Foundation award 2008), Solvay, Merck Sharp & Dohme and Astra Zeneca for this service. DRN has advisory board membership for Merck Sharp & Dohme, Sanofi and Amgen. DRN is a speaker for Merck Sharp & Dohme, Sanofi and Amgen. AJ, JWP, NR, MS, NB, DN and PP have no competing interests to disclose.
Funding
The study was financially supported by the Pfizer Foundation award 2008, Pfizer, UK. We also received unrestricted educational grants from MSD, Solvay and AstraZeneca. The design and conduct of the service and the analysis, interpretation and presentation of the data were solely the responsibility of the authors.
Ethical approval
Not applicable.
Guarantor
DRN.
Contributorship
DRN developed the proposal for the outreach clinic and is the lead for the project. AJ and JWP planned the analysis, drafted and edited the paper. JWP, NR, PP, NB DN and MS were responsible for the implementation of the study and acquisition of data. All the authors gave their intellectual input towards the preparation of manuscript and approved the final version.