
Abstract
Background
The accurate determination of low density lipoprotein cholesterol (LDL-c) is pertinent in clinical practice. Most laboratories employ the Friedewald formula, for convenient estimation of LDL-c, despite its shortfalls. Different formulae have been proposed for use, for more accurate but convenient estimation of LDL-c. Here, we compare a new formula recently proposed by de Cordova et al., with that of Friedewald and LDL-c determined by a homogeneous assay. We also assess its performance at very low TG levels against the modified Friedewald formula recommended by Ahmadi et al.
Methods
A database of 587 adults from the ‘Establishing Reference Intervals for Selected Analytes in South Africa’ study was utilized. Fasting samples were assayed for lipids. LDL-c was determined by the Daiichi method. Performance of the Friedewald and the de Cordova formulae was compared. This was exclusively repeated at very low TG levels (<1.13 mmol/L), this time, including the Ahmadi formula.
Results
The Friedewald formula and the de Cordova formula both had high correlations with the direct LDL-c (r = 0.98 and r = 0.97, respectively), although the latter showed an inconsistent bias at different LDL-c levels. The two formulae had a higher correlation (r = 0.98) than the Ahmadi formula (r = 0.92) at very low TG levels.
Conclusions
The Friedewald formula showed better agreement with the direct LDL-c than the de Cordova formula, at various LDL-c levels, in our population. It also performed better than the Ahmadi formula at very low TG levels. We therefore advise that it remains the formula of choice for LDL-c estimation in South Africa.
Introduction
Low density lipoprotein cholesterol (LDL-c) is a lipoprotein historically classified based on its hydrated density as determined by ultracentrifugation. Its association with an increased risk for cardiovascular disease has been confirmed by epidemiologic studies, clinical trials, genome wide association studies and meta-analyses in humans.1–3
LDL-c-lowering therapy has also been shown to reduce the risk for coronary artery disease.4–6 Due to these reasons, the expert panel for the detection, assessment and management of elevated blood cholesterol in adults – the National Cholesterol Education Program (NCEP) Adult Treatment Panel (ATP) III continues to focus on LDL cholesterol as the primary target in the diagnosis of dyslipidaemias and in therapy with lipid-lowering agents. 7 NCEP guidelines also require that clinical laboratories estimate LDL-c using methodologies with a total analytical error of <12% and an imprecision of <4%. 8
Traditionally, the reference method for the determination of LDL-c is by beta-quantitation following ultra-centrifugation. This method is, however, time-consuming, labour-intensive, expensive, requires highly skilled technicians and different types of equipment which make reproducibility of the procedure difficult. Hence, its application is limited to specialized lipid laboratories.
9
In 1972, William Friedewald developed a new method for the estimation of LDL-c, which eliminates the need for ultracentrifugation and is therefore cost-effective and convenient. This method was developed using a sample size of 448 individuals made up of patients with either type II or type IV familial hyperlipoproteinaemia, and their normal relatives. The range of LDL-c in the study was from 0.72 mmol/L to 21.72 mmol/L. The Friedewald formula estimates LDL-c from total cholesterol (TC), high density lipoprotein cholesterol (HDL-c) and triglycerides (TG), thus

Due to the three parameters involved in the estimation of the Friedewald formula, it is difficult to meet the NCEP criteria for total error and imprecision using this method, as it will involve the imprecision due to the individual parameters. In addition to this shortfall, the Friedewald formula estimates LDL-c inaccurately in non-fasting samples, at TG levels greater than 4.5 mmol/L10 and also at very low TG levels (<1.13 mmol/L), 11 in certain disease conditions such as diabetes mellitus, hepatopathies and nephropathies.12,13
In the past two decades, direct methods for measurement of LDL-c have been developed.14–17 These methods are expensive for most clinical laboratories. Hence, despite its numerous shortfalls, the Friedewald formula remains widely applied by routine laboratories worldwide. More recently, several authors have derived various formulae in specific populations to circumvent the drawbacks of the Friedewald formula.11,18–21 These authors have recommended the verification of their formulae in populations different from those of their study. De Cordova et al. very recently published a new and simple formula from a large Brazilian database of 10,664 individuals; with LDL-c values ranging from 0.62 to 10.94 mmol/L. This new formula performed better than the Friedewald formula and other previously published formulae in their study population. The formula estimates LDL-c thus: LDL-c = 0.75 (TC – HDL-c). It also does not require a fasting specimen as it is independent of TG. 22
Here, we compare the recently published de Cordova formula, the Friedewald formula and a directly measured LDL-c in a healthy South African population. We also verify its performance at very low TG levels (<1.13 mmol/L), against the modified Friedewald formula proposed by Ahmadi et al.,
11
which estimates LDL-c viz

Materials and methods
Study population
Our study utilised the database of the ‘Establishing Adult Reference Intervals for Selected Analytes in South Africa’, a study which was approved by the Health Research Ethics Committee of Stellenbosch University, Cape Town, South Africa. Healthy individuals, were recruited from students, laboratory and hospital staff and the general public. The study criteria included males and females of South African origin, aged 18–65, who were feeling subjectively well, who were not taking any medications except the contraceptive-pill or estrogens or thyroxin if the subject was on a maintenance dose. We excluded individuals who were not born in South Africa, obese individuals (body mass index≥30 kg/m2), heavy alcohol consumers (ethanol ≥ 70 g/day), heavy smokers (tobacco > 20 cigarettes/day), individuals taking regular medication for a chronic disease or recently (≤14 days) recovered from acute illness, injury, or surgery requiring hospitalization. Individuals with known carrier states of Hepatitis B Virus, Hepatitis C Virus or Human Immunodeficiency Virus, those pregnant or within one year after childbirth and those with incomplete questionnaires or unsigned consent forms were also excluded from the study.
Blood samples were collected after a 12–14 h fast into serum separator tubes for determination of lipids TC, HDL-c, LDL-c and TG. Blood was collected after subjects were seated for 20–30 min. These samples were centrifuged within 4 h of collection and serum frozen at −80℃ until analysis. Specimen analysis was carried out within six months of collection, at a single laboratory facility accredited by the South African National Accreditation System (SANAS).
All assays were performed on the Beckman DXC automated analyser using reagents from Beckman Coulter (Brea, CA, USA). The LDL-c method is a two-phase homogeneous method based on the Daiichi method. 23 It depends on a unique detergent which solubilizes only the non-LDL lipoprotein particles, with the consumption of the products by an enzymatic reaction with cholesterol esterase and cholesterol oxidase, to yield a colourless product. In the second phase, a reagent containing N,N′- bis- (4 - sulphobutyl)-m-toluidine disodium(DSBmT), buffer (pH 6.3) and a detergent solubilizes the remaining LDL particles. A chromogenic coupler allows for colour formation and this is measured spectrophotometrically. The method had an imprecision of less than 2%. The total cholesterol measurement was performed by a colorimetric three-step enzymatic reaction. The CV was less than 3%. HDL-c assay was based on a two-phase homogenous, colorimetric, enzymatic reaction, whose CV was less than 3%. The triglyceride procedure had a CV of less than 2%. It is based on a sequence of three coupled enzymatic reactions which yield a product measured colorimetrically. 24
Data analysis
Data were extracted from Microsoft Excel and analysed using Statistica version 11.0 software. (Statsoft Inc. 2012). Pearson’s correlation analyses of the LDL-c as determined by the Friedewald formula and the de Cordova formula were performed against the directly measured LDL-c. These were repeated in different groups according to race, gender and gender with race. Correlation analysis was performed for very low TG values (<1.13 mmol/L) using the de Cordova formula and the modified Friedewald formula proposed by Ahmadi et al., (LDL-c = TC/1.19 + TG/0.81 – HDL/1.1 – 0.98), 11 from here on referred to as ‘the Ahmadi formula.’ The Bland-Altman plot was employed to assess the agreement between the de Cordova formula and the direct LDL-c, and also the agreement between the Friedewald formula and the direct LDL-c. This was repeated at very low TG levels, also employing the Ahmadi formula. The range of agreement was defined as mean bias ±2SD.
Results
Mean (SD) values and ranges of LDL-c as determined by the direct LDL-c assay and the Friedewald and de Cordova formulae.
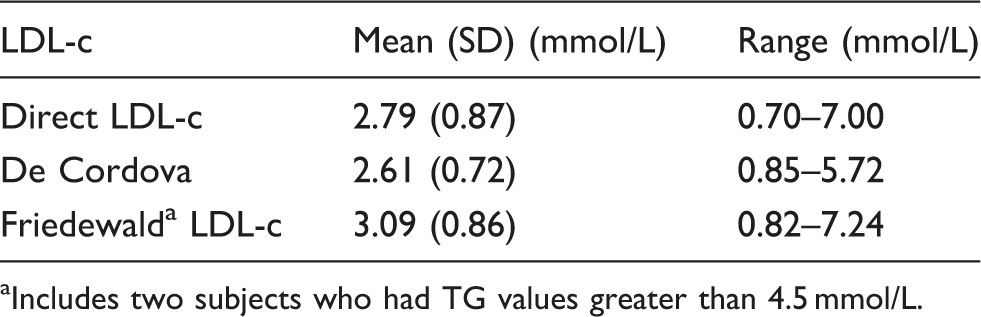
Includes two subjects who had TG values greater than 4.5 mmol/L.
Pearson’s correlation analyses demonstrated a very high correlation between the de Cordova formula and the direct LDL-c (r = 0.97, P < 0.001). This was slightly lower than the correlation observed between the Friedewald formula and the direct LDL-c (r = 0.98, P < 0.001). These are shown in Figure 1.
The correlation of LDL-c calculated by the De Cordova formula with the direct LDL-c (a) and correlation of LDL-c calculated by the Friedewald formula with the direct LDL-c (b).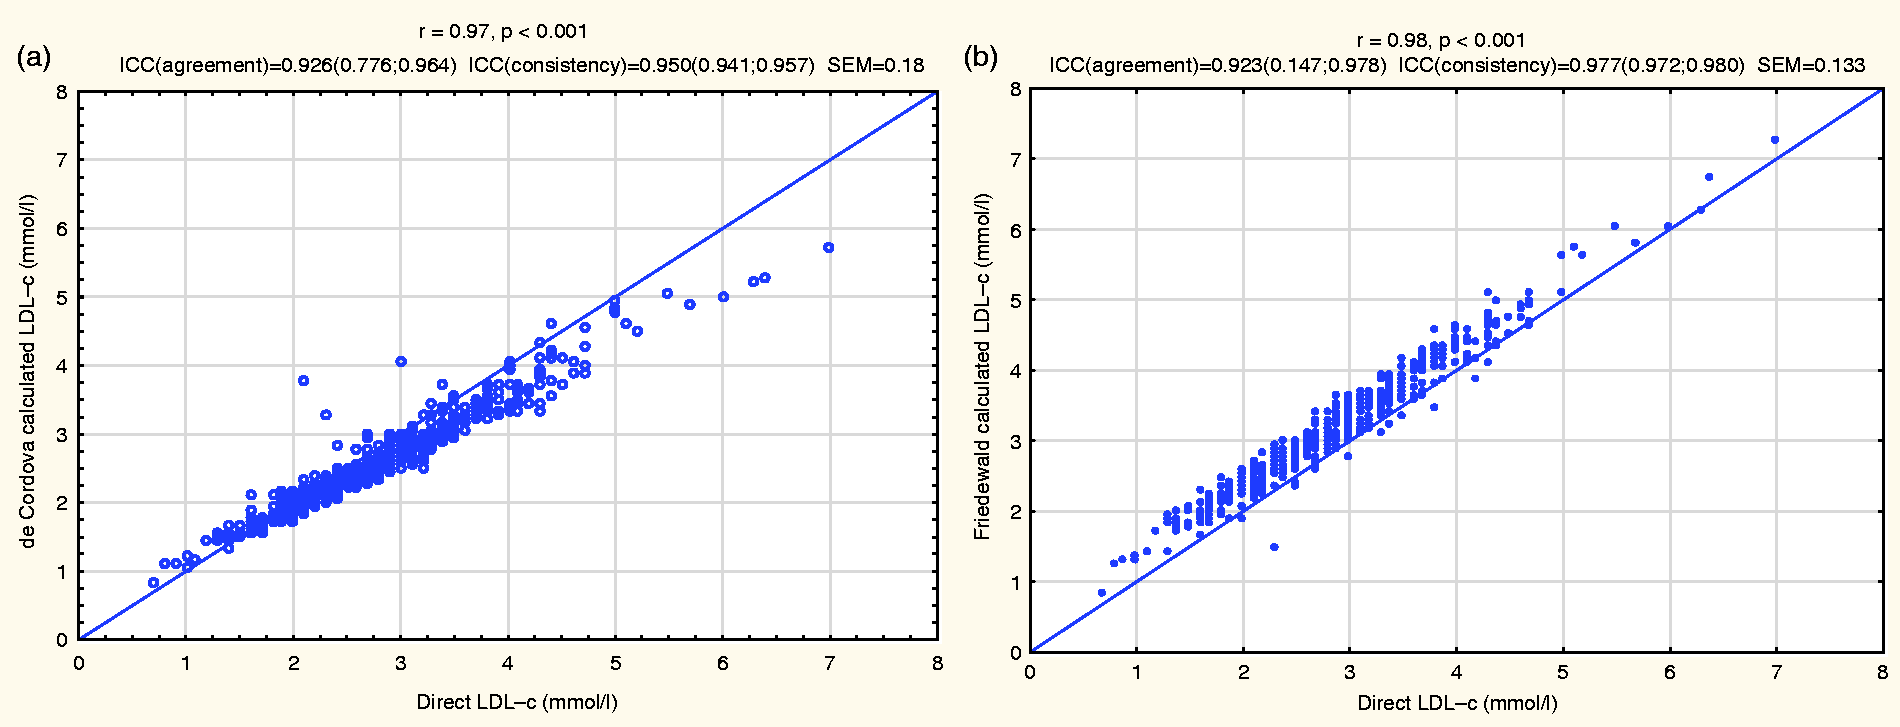
At very low TG levels, the de Cordova formula and the Friedewald formula showed equally higher correlation (r = 0.98, P < 0.001) with the direct LDL-c than the modified Friedewald formula proposed by Ahmadi et al., for very low TG levels, which showed a correlation of r = 0.92, P < 0.001 (see Figure 2).
The correlation of LDL-c calculated by the de Cordova formula (a), the Friedewald formula (b) and the Ahmadi formula (c), with the direct LDL-c at very low TG levels.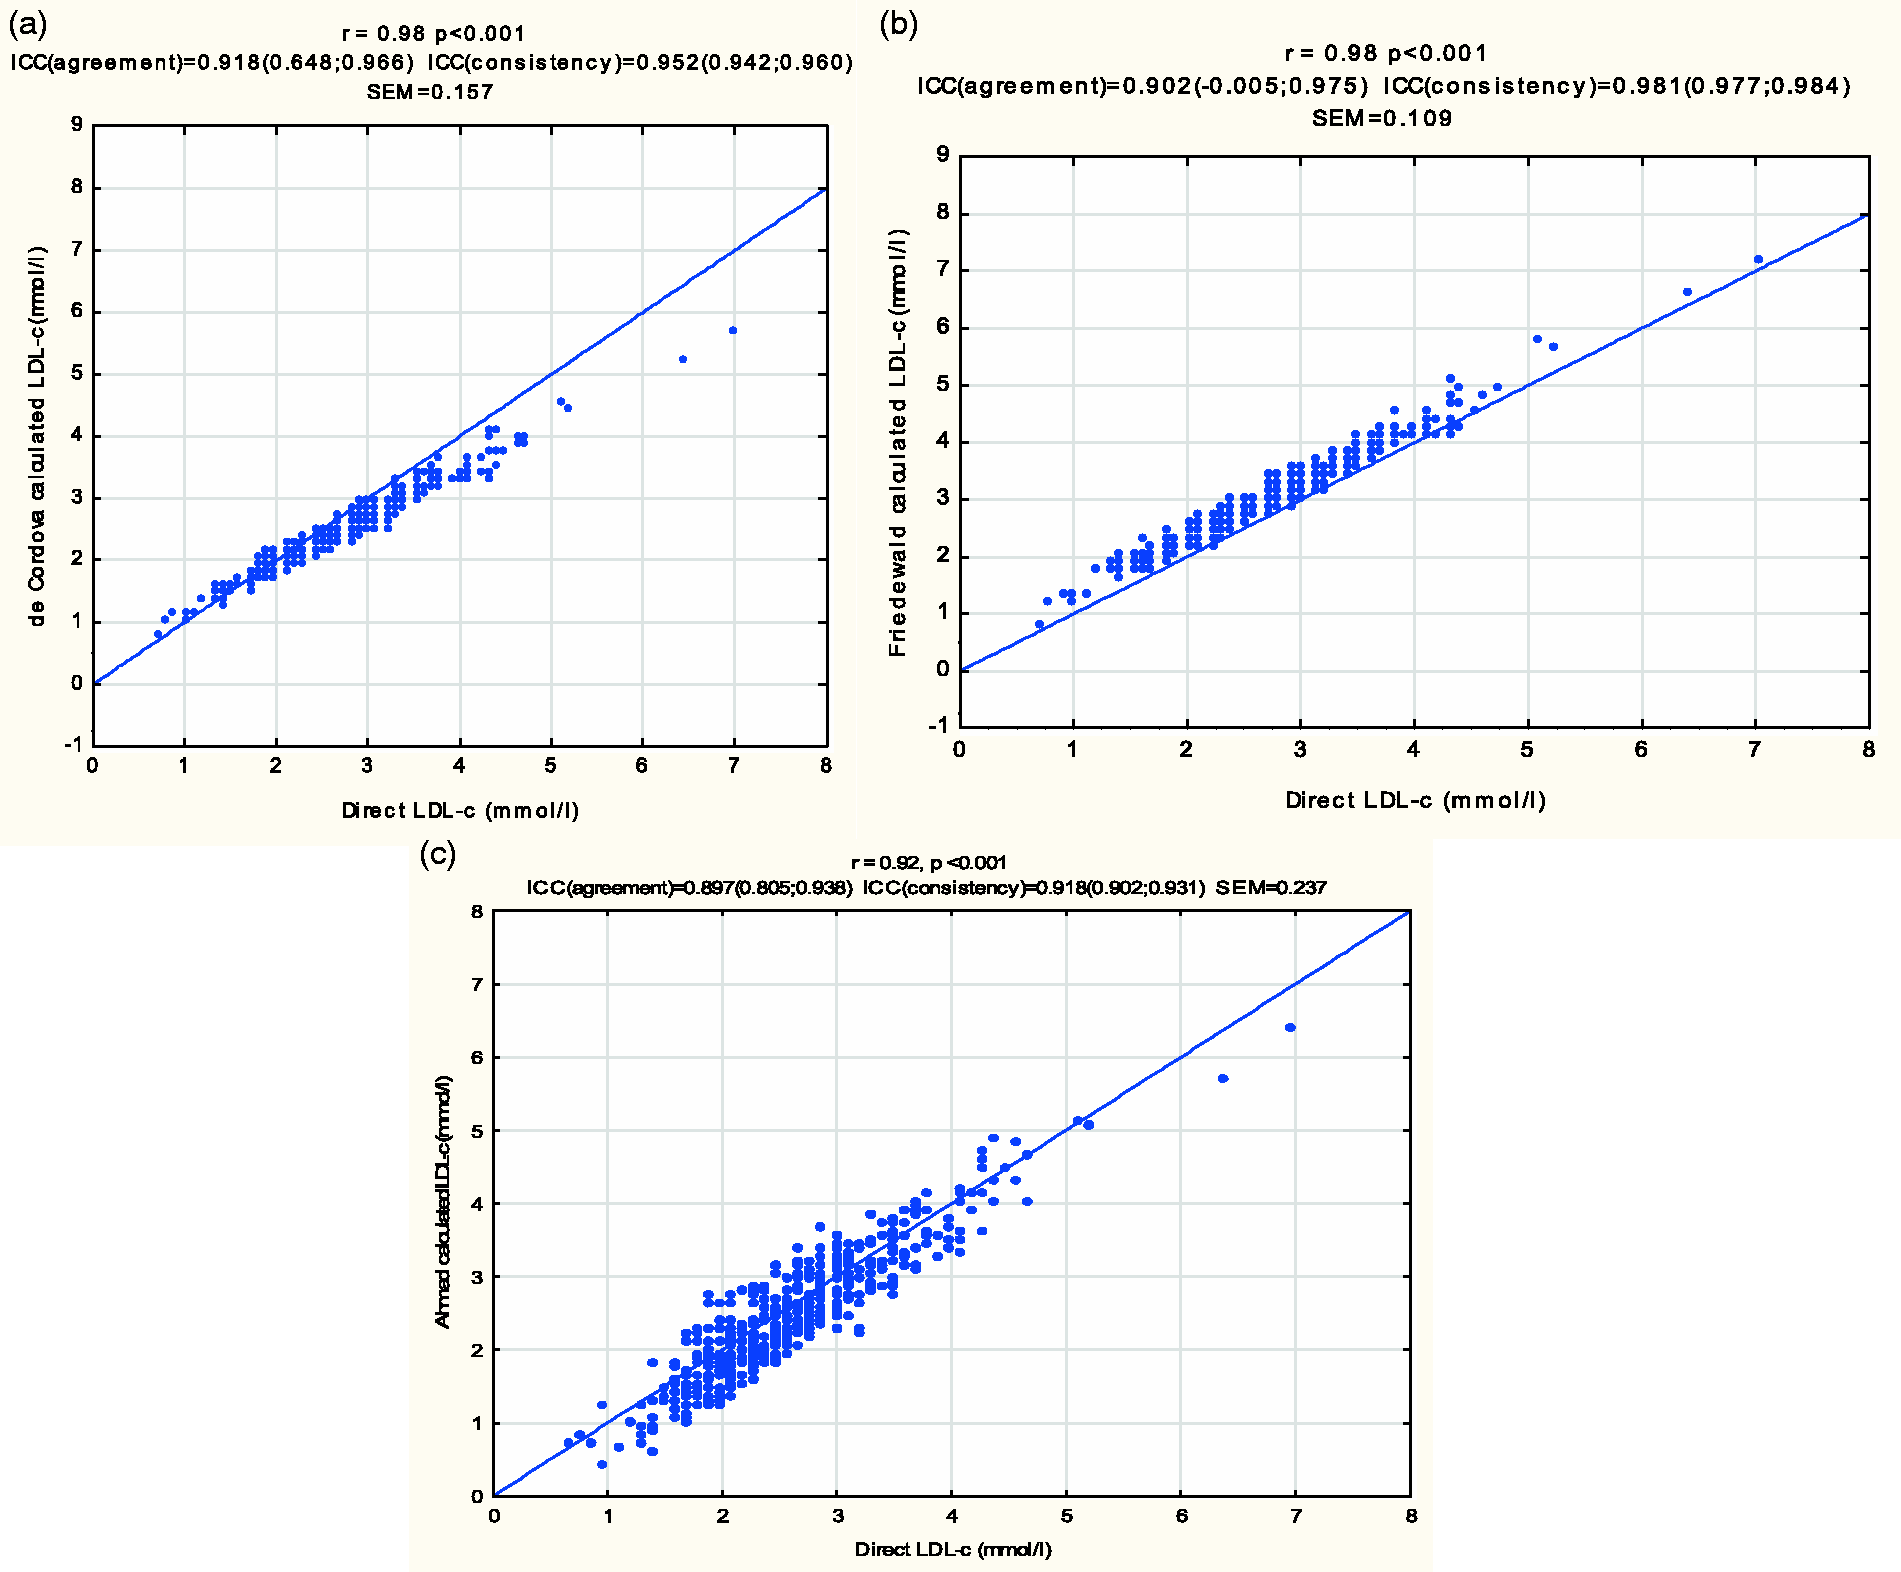
Various group analyses were carried out according to race (blacks, mixed and whites), gender (males and females) and gender and race (black females/black males; mixed females/mixed males; and white females/white males), correlating the Friedewald formula and the de Cordova formula with the direct LDL-c in each of these groups.
Among male subjects, there was a slightly higher level of correlation with the Friedewald formula (r = 0.98, P < 0.001) compared to the de Cordova formula (r = 0.97, P < 0.001). This marginally higher difference was also seen among the female subjects with the Friedewald formula having an r of 0.98, P < 0.001, and the de Cordova formula having an r of 0.97, P < 0.001.
In group analyses according to ethnicity, the Friedewald formula had a slightly higher correlation with the direct LDL-c (r = 0.98, P < 0.001) than the de Cordova formula (r = 0.97, P < 0.001) among subjects of white ancestry. A lower correlation was observed in both formulae, in subjects of mixed ancestry, where the Friedewald formula once again, had a slightly higher r value (0.97) than the de Cordova formula (r = 0.96, P < 0.001). Equal degrees of correlation were observed between each of the two formulae (de Cordova and Friedewald) and the direct LDL-c (r = 0.98, P < 0.001) among black subjects.
Sub-group analyses of the two formulae with the direct LDL-c, according to gender, together with race showed the highest correlations, using the Friedewald formula, in males of black and males of white ancestry (r = 0.99, P < 0.001). The lowest correlation with the direct LDL-c was found among males of mixed ancestry, using the de Cordova formula (r = 0.94, P < 0.001). Equal degrees of correlation were found between each of the two formulae (de Cordova and Friedewald) and the direct LDL-c, among black females (r = 0.98) and white females (r = 0.97). The Friedewald formula, however, had a slightly higher correlation with the direct LDL-c than the correlation between the de Cordova formula and the direct LDL-c in the sub-groups of black males (r = 0.99 versus r = 0.97), white males (r = 0.99 versus r = 0.96) and males of mixed ancestry (r = 0.96 versus r = 0.94).
Figure 3 shows a Bland-Altman plot of the difference of the direct LDL-c and the LDL-c derived from the de Cordova formula, against the mean of the two LDL-c values, and this had a mean bias of 0.18 ±0.50 mmol/L. A positive bias is also noted at lower LDL-c values, and a negative bias at higher LDL-c values. A similar plot of the difference between the direct LDL-c and the LDL-c derived by the Friedewald formula, against the mean of the two LDL-c values, gave a mean bias of − 0.3 ± 0.36 mmol/L.
Bland-Altman plots of direct LDL-c and de Cordova calculated LDL-c (a), and direct LDL-c and Friedewald calculated LDL-c (b).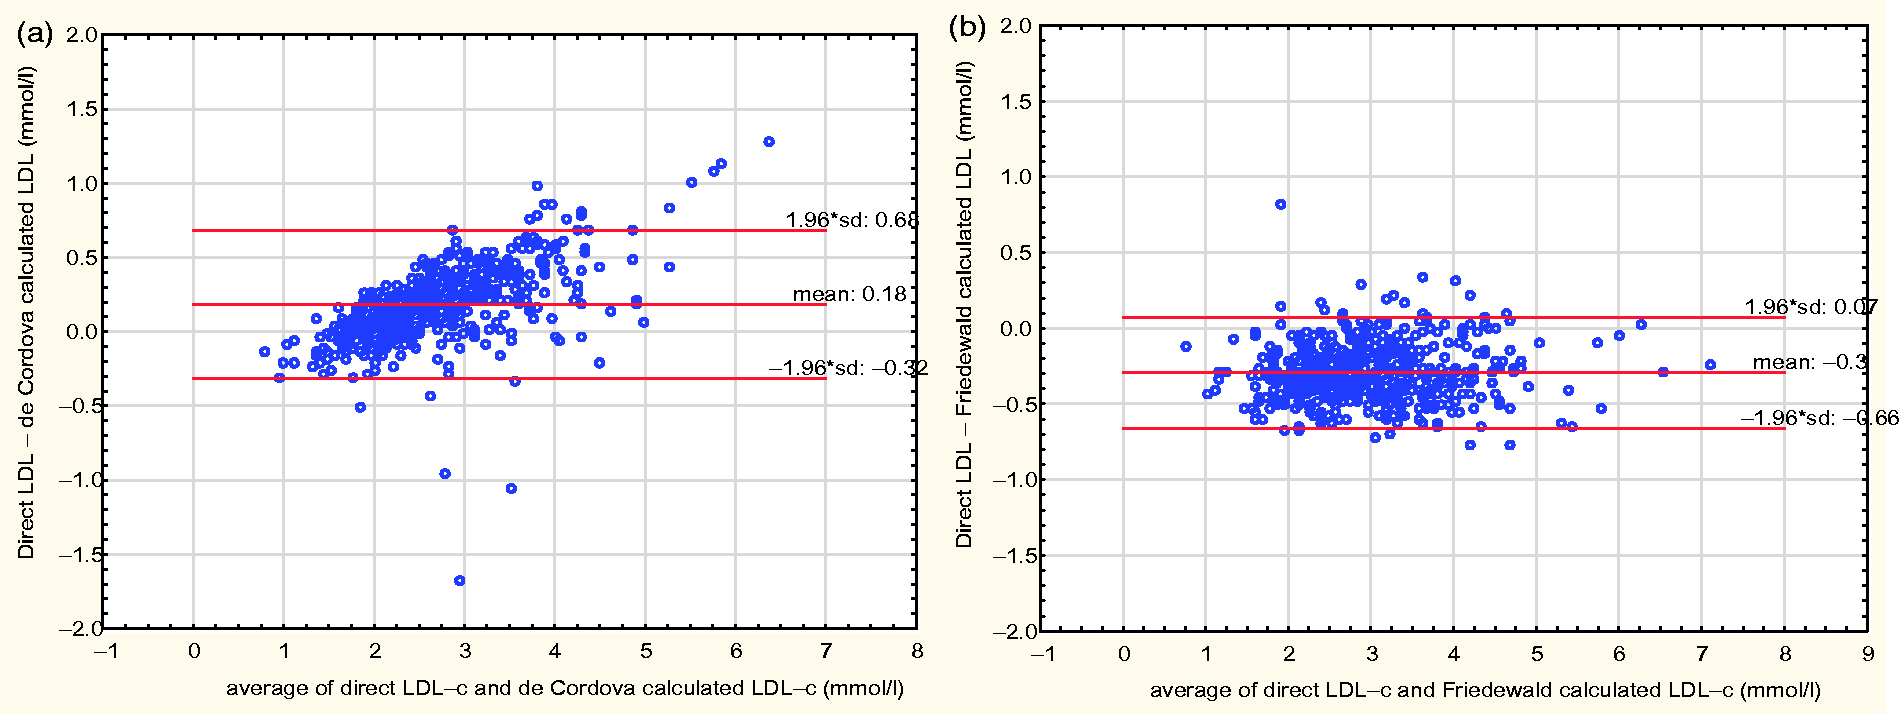
At very low TG values, the Bland-Altman plot of the direct LDL-c and the LDL-c derived from the de Cordova formula gave a mean bias of 0.19 ± 0.44 mmol/L, with a negative bias at high LDL-c values and a positive bias at low LDL-c values. A similar plot using the Friedewald formula gave a mean bias of −0.33 ±0.30 mmol/L, while that using the Ahmadi formula gave a mean bias of 0.18 ± 0.65 mmol/L. The three plots are shown in Figure 4.
Bland-Altman plots of direct LDL-c and LDL-c estimated by the de Cordova formula (a), Friedewald formula (b) and Ahmadi formula (c) at very low TG levels (<1.13 mmol/L).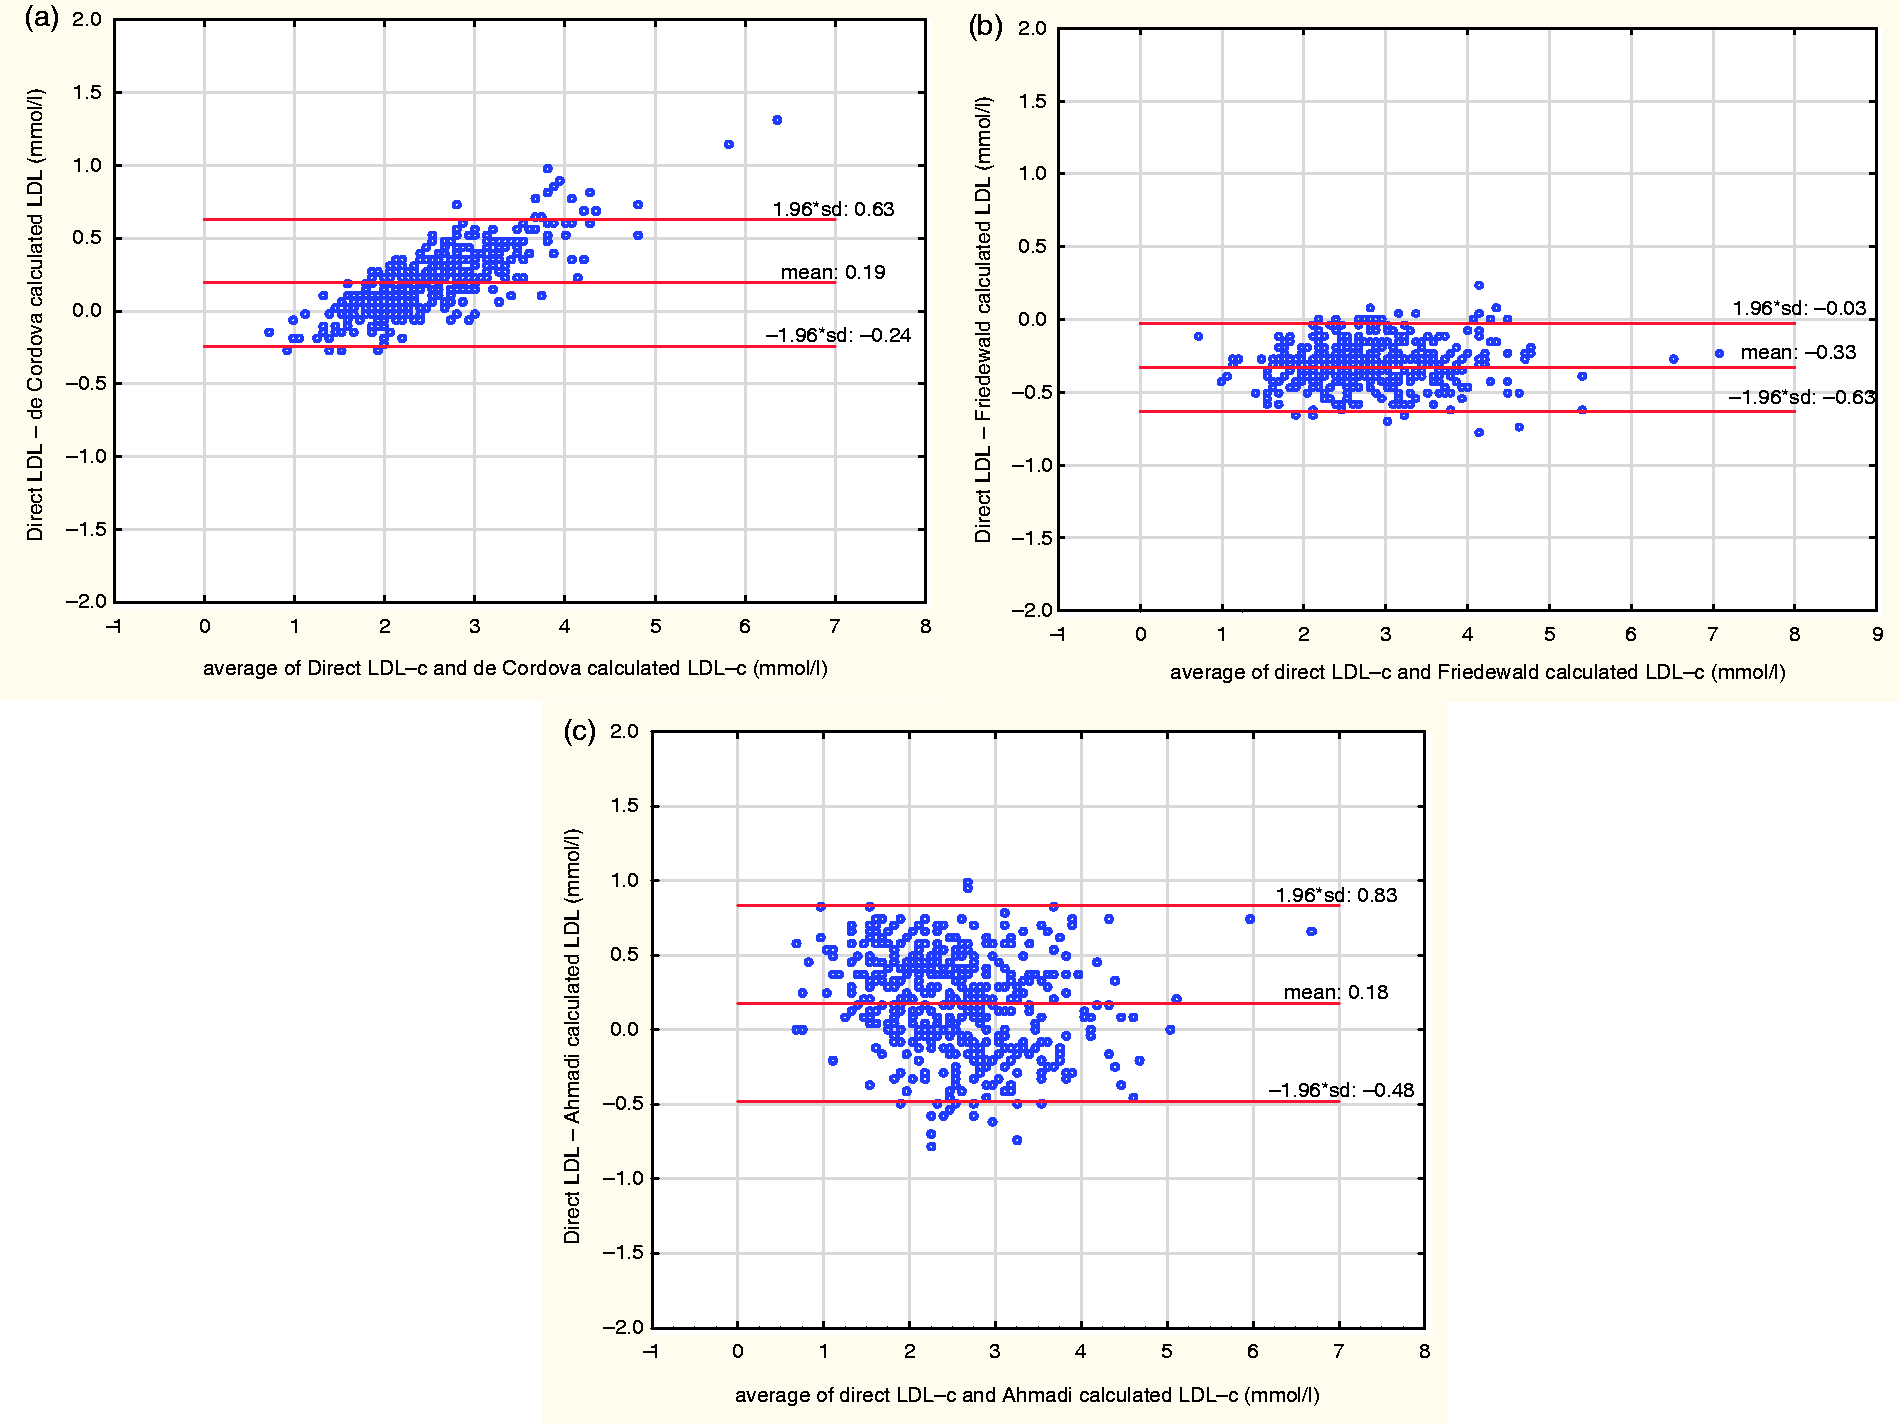
Discussion
LDL-c is pivotal in the development of artherosclerosis and coronary artery disease. Its levels are used as targets in the diagnosis and management of dyslipidaemias. The Friedewald formula was developed over 40 years ago, as a convenient way to estimate LDL-c. 10 Several authors have demonstrated the important limitations of the Friedewald formula, its poor performance in various conditions and also its inability to meet the National Cholesterol Education Program (NCEP) requirement for imprecision for LDL-c determination. Other authors have proposed new formulae to circumvent these limitations of the Friedewald formula and recommended verification of these formulae in different populations before adoption.11,18–22 De Cordova et al. recently published a simple, presumably, more accurate formula for the estimation of LDL-c. 22 We compared this newly published formula by de Cordova et al. and the Friedewald formula, against LDL-c determined by a homogeneous method, in a healthy South African population of different ethnic origins.
The two formulae were generally highly correlated with the direct LDL-c. However, as high correlation coefficients do not imply agreement of methods, we examined the degree of agreement between each of the two formulae and the direct LDL-c, using the Bland-Altman difference plot. The Bland-Altman plot suggests a lesser agreement exists between the de Cordova formula and the directly measured LDL-c. Using the de Cordova formula, an LDL-c will be underestimated by 0.18 mmol/L, but this value can vary from −0.32 to 0.68 mmol/L. This shows a level of discrepancy of up to 0.50 mmol/L for any value of LDL-c. In particular, the higher the LDL-c, the more the negative bias and the lower the LDL-c level, the more the positive bias, further making this large discrepancy unpredictable. The Friedewald formula, though showing an over-estimation of LDL-c by 0.3 mmol/L, demonstrates a better agreement with the direct LDL-c as the degree of variation is from −0.66 to 0.07 mmol/L. This variation of up to 0.36 mmol/L is narrower than the 0.50 mmol/L observed with the de Cordova formula. In addition, there is a uniform distribution of points with the Bland-Altman plot for the Friedewald formula; hence the bias observed with the Friedewald formula is uniform at the various levels of LDL-c and therefore more predictable (Figure 3).
At very low TG values, the Friedewald formula still performed better than the de Cordova and the Ahmadi formula. Though the de Cordova formula showed a lower mean bias than the Ahmadi formula, the presence of the inconsistent bias at different levels of LDL-c (positive bias at low LDL-c levels and a negative bias at high LDL-c levels) observed with the de Cordova formula makes it less reliable for estimating LDL-c at these TG levels (Figure 4). This was not in agreement with the study by de Cordova et al., 22 who observed a superior performance of the de Cordova formula to the Friedewald formula at low TG levels.
Therefore, these results imply theoretically that there is a higher likelihood for a patient in a particular risk group classified according to the NCEP-ATP III classification for the prevention and management of adults at risk of coronary artery disease 7 to be erroneously classified by the de Cordova formula, compared to the Friedewald formula. It also implies that this incorrect classification may be less predictable due to the presence of differing bias at various LDL-c levels. This has implications in the management of patients, as the estimated LDL-c values can easily vary unpredictably with the de Cordova formula, around decision limits and thus lead to unnecessary institution of therapy or withholding therapy in a patient requiring treatment.
Our finding of an overestimation of LDL-c by the Friedewald formula is in agreement with those of Cordova et al., 25 Anandaraja et al. 18 and Ahmadi et al. 11 but different from those of Vujovic et al., who evaluated different formulae for LDL-c estimation in a Serbian population and found that Friedewald formula significantly underestimates directly measured LDL-c in all TC, TG and LDL-c ranges. 26 Tighe et al. also evaluated healthy individuals with TG levels <4.52 mmol/L and found that the negative bias in the Friedewald formula occurs frequently at low TG concentrations. 27
Our study has a number of limitations. The first and major one is that it was carried out among healthy adults whose racial origins are representative of the South African population. However, the large Brazilian cohort which de Cordova et al. had studied may have included individuals with various medical conditions. In our study, there were only two values of TG greater than 4.5 mmol/L; hence our comparison of the performance of the two formulae does not include extremely high TG levels in contrast to the de Cordova study. The use of a non-reference method for the determination of LDL-c may be a second source of limitation to our findings. However, the study by de Cordova et al. employed the Wako method, which is also a non-reference method that meets the NCEP standard for precision in the determination of LDL-c. Our method is a homogeneous LDL-c method based on the Daiichi method; it also meets the NCEP standard for precision. These differing findings from the two studies may be due to differing methods for the determination of LDL-c and HDL-c and the differences in the study population.
In conclusion, in a healthy South African population, our data have shown a slightly greater, more uniform bias but better agreement of the Friedewald formula with a directly measured LDL-c based on the Daiichi method when compared to the newly published formula by de Cordova et al. Though there is a need to verify these findings in a larger South African cohort, including subjects with extremely elevated TG levels and other conditions in which the Friedewald formula has previously been found to be inaccurate, we advise that the Friedewald formula remains the formula of choice to calculate LDL-c in South Africa.
Footnotes
Acknowledgements
The authors would like to acknowledge PathCare Laboratories, South Africa, for subject recruitment and sample processing as well as the lipid analysis, Beckman Coulter for the reagents utilized for the study and Professor M Kidd for the statistical analysis.