
Abstract
Background
The association of plasma cardiovascular risk markers and metabolic syndrome (MetS) with non-alcoholic fatty liver disease (NAFLD) has not been well defined.
Methods
Japanese men (n = 809) had standard anthropometric measurements done, and had their liver fat quantitated by ultrasound. Three groups were identified: (1) normal controls without significant disease, (2) preliminary-metabolic syndrome (pre-MetS) cases and (3) MetS cases. Plasma adiponectin, high sensitivity-C reactive protein (hs-CRP), HOMA-IR, lipids, lipoproteins and liver enzymes were evaluated among the three groups.
Results
The prevalence of fatty liver was 13% in controls, 39% in pre-MetS and 62% in MetS. Plasma adiponectin and high density lipoprotein cholesterol (HDL-C) were significantly decreased, and HOMA-IR, hs-CRP, TG, remnant lipoproteins (RLPs) and small dense-LDL-C (sd LDL-C) were significantly increased in subjects with fatty liver compared to those without fatty liver. Multivariate analyses of serum parameters associated with fatty liver revealed that adiponectin and hs-CRP were more strongly associated with the presence of fatty liver than waist circumference. However, HOMA-IR, HDL-C, TG, RLP-C, RLP-TG and sd LDL-C were more strongly associated with waist circumference than with fatty liver. Factor analysis revealed that adiponectin and HDL-C were linked to liver enzymes, lipoproteins and HOMA-IR associated with fatty liver, but not with waist circumference.
Conclusions
Adiponectin was found to be a more specific diagnostic marker for the presence of fatty liver regardless of MetS status, and was inversely correlated with liver enzyme concentrations. However, RLPs were found to be more specifically associated with the presence of MetS.
Keywords
Introduction
Non-alcoholic fatty liver disease (NAFLD) is estimated to affect about 30% of the general population and over 70% of patients with type 2 diabetes. 1 Given the expected continuing increase in the prevalence of both obesity and diabetes, NAFLD will soon become an epidemic, if it is not one already. The consequences of NAFLD are numerous and range from chronic liver disease to a worsening of insulin resistance and type 2 diabetes, to being a contributor to both cardiovascular disease (CVD) and chronic kidney disease (CKD). 2 NAFLD is, therefore, a complex problem with implications far beyond the liver. It is well known that metabolic syndrome (MetS) leads to CVD, mainly due to a number of metabolic and inflammatory alterations. 3 In addition, MetS is closely associated with NAFLD, which comprises the hepatic manifestation of this syndrome. 4
Plasma adiponectin concentration has been proposed as a diagnostic marker of MetS from many clinical studies.5–8 A reduced plasma concentration of adiponectin has been said to be associated with increased visceral fat. However, we have often diagnosed cases of MetS without low plasma adiponectin concentrations. Furthermore, there have been cases without MetS, but with significantly decreased plasma adiponectin concentrations. Therefore, we have investigated cases with decreased plasma adiponectin concentrations, which may be more closely associated with other conditions than MetS. Our goal in this study was to evaluate cases with fatty liver in pathophysiology associated with the expression of increased visceral fat, most of which is diagnosed as MetS or preliminary-MetS (pre-MetS). We also evaluated the other plasma markers associated with fatty liver such as C-reactive protein (CRP), HOMA-IR, high density lipoprotein cholesterol (HDL-C), remnant lipoproteins (RLP), small dense LDL-cholesterol (sd LDL-C) and liver enzymes in this study. Those diagnostic markers are also known as the markers of CVDs. The diagnosis of fatty liver was made using ultrasonography, a non-invasive, inexpensive method of moderate specificity and sensitivity. 9 Although fatty liver has been considered to be a part of MetS, a recent Framingham Heart Study report indicated that fatty liver is a prevalent condition, characterized by dysglycemia and dyslipidemia, which in fact is independent from the visceral adipose tissue shown to be a major source of adiponectin secretion. 10
Adipokine alterations, such as reduced adiponectin and elevated tumour necrosis factor alpha (TNF-α) and interleukin-6 (IL-6) are considered the key factors in the development of the insulin resistance underlying MetS, contributing to the pro-inflammatory state. 11 Reduced adiponectin and elevated TNF-α and IL-6 may also induce the secretion of CRP in liver and an excessive intrahepatocyte free fatty acid pool promoting the deposition of triglycerides (TGs) in the hepatic parenchyma and favouring fatty liver, 12 although it is still controversial whether this is dependent on or independent of insulin resistance. Also, it has been not clear yet, whether the circulating adipokines and CRP concentrations are different in MetS with and without hepatic steatosis, and through their presence, generating a more pronounced chronic inflammatory state. 13 In addition, adhesion molecules, crucial for leukocyte interaction with the endothelium and migration into the artery wall, are reportedly elevated in patients with MetS. 14 Elevated plasma RLP was reported to induce plasma vascular cell adhesion molecule (sVCAM-1) and intracellular adhesion molecule (sICAM-1), which is implicated in the endothelial inflammatory and atherogenic process in MetS patients.15,16
We evaluated adiponectin, CRP, insulin resistance (HOMA-IR) and lipoproteins along with currently used diagnostic markers for liver injuries, comparing those with and without fatty liver in the healthy controls, pre-MetS and MetS cases. It has already been reported that there is overproduction and secretion of very low density lipoproteins (VLDL) in insulin resistance associated with NAFLD, irrespective of the presence of liver fat deposits. 17 Adiponectin regulates lipid metabolism and may influence VLDL production and/or catabolism which determines VLDL-apoB concentration and plasma TG concentrations. 18 It is not clear if the adiponectin in MetS has a different role in VLDL when a fatty liver is present. Plasma RLP cholesterol (RLP-C), triglyceride (RLP-TG) and RLP-TG/RLP-C ratio (which reflects the particle size) were also compared in MetS with and without fatty liver in terms of parameters of lipoprotein metabolism.
The aim of this study was to clarify whether the plasma markers such as adiponectin, hs-CRP, HOMA-IR and lipoproteins could be the diagnostic marker of NAFLD associated with a risk of CVD or a marker of MetS. We have also discussed the risk of CVD and its relationship with NAFLD associated with hypoadiponectinaemia in this manuscript.
Materials and methods
Subjects
The study cases were all men because the prevalence of MetS in Japan using Japanese criteria is very low in women. 19 In our analysis, a total of 809 men underwent screening who were not receiving medication for hypertension, diabetes or lipid abnormalities. In this population, we defined the MetS participants as those having abdominal obesity (85 cm or greater in waist circumference) and two or more of the following components: (1) a systolic blood pressureof 130 mmHg or higher or a diastolic blood pressure of 85 mmHg or higher, (2) a serum TG concentration of 1.7 mmol/L (150 mg/dL) or higher and HDL-C <1.0 mmol/L (40 mg/dL) and (3) a fasting plasma glucose of 6.1 mmol/L (110 mg/dL) or higher. One hundred and twenty three subjects met these criteria for MetS. In addition, we screened the subjects for meeting the criteria for pre-MetS (pre-MetS), defined as those having a waist circumference of 85 cm or greater, but fewer than two components of MetS described above. A total of 305 subjects met the criteria for pre-MetS. In addition, 382 normal control subjects were identified who had a waist circumference of <85 cm, and who had no components for MetS as described above. These three groups were selected to provide a continuum ranging from normal to pre-MetS and MetS. All these subjects were identified while receiving a health check-up at Hidaka Hospital, Takasaki, Japan from April 2008 to October 2009, and were randomly selected for the present study. Subjects having the following were excluded: (1) alcohol intake >20 g/day (certified by the frequency to drink alcohol), (2) recent history of acute illness, (3) taking medications known to modify lipid concentrations, blood pressure or blood glucose, (4) taking medications known to induce a fatty liver, (5) being seropositive for hepatitis B or C and/or (6) having any other health problem known to be associated with liver steatosis. In all the cases men were 35–65 years old. The cases of fatty liver in this study were identified as non-alcoholic fatty liver (NAFLD).
All the patients were referred to the haepatology unit at Hidaka Hospital for ultrasound investigation of hepatic steatosis, performed as a part of routine clinical practice. According to the ultrasound results, subjects in the groups with MetS, pre-MetS and controls were further divided into those with and without a fatty liver. The fatty liver positive group included the cases who presented with ‘bright liver’ echo patterns according to standard criteria (i.e. evidence of a diffuse increase in echogenicity of the liver compared with that of the kidneys). The non-fatty liver group with MetS, pre-MetS and normal controls comprised of the cases who did not exhibit any echogenic evidence of fatty liver. The weight and height of each participant were measured and body mass index (BMI) was calculated to evaluate for the presence of obesity. Waist circumference measurement was made midway between the lateral lower rib margin and the superior anterior iliac crest in a standing position in all cases by the same investigator. Written informed consent was obtained from all of the participants. The study had the approval of the Ethical Committees of Hidaka Hospital and of Gunma University School of Medicine.
Biochemical analysis
After 12-hour overnight fast, blood samples were taken, and sera were isolated and stored at 4℃. The following analytes were measured within 48 h of drawing the blood: liver enzymes, haemoglobin A1c (HbA1c), total cholesterol (TC), TGs, direct low density lipoprotein cholesterol (LDL-C) and high density lipoproteins (HDL-C) as previously reported. 20 Aliquots of serum were also stored at −80℃ for subsequent determination of adiponectin, high sensitivity C-reactive protein (hs-CRP), RLP-C and RLP-TG. Specifically, the reagent used for measuring LDL-C and HDL-C was a direct method obtained from Denka Seiken (Tokyo, Japan) and hs-CRP was a latex-based immunoturbidometric assay obtained from Denka Seiken. In addition, the adiponectin assay was also a latex-based immunoturbidometric method obtained from Otsuka (Tokyo, Japan) and the immunoseparation methods of RLP-C and RLP-TG (JIMRO II) were obtained from Otsuka. Automated sd LDL-C assay kit was provided from Denka-Seiken. Liver enzymes including (aspartate aminotransferase (AST), alanine aminotransferase (ALT) and gamma-glutamyltranspeptidase (GGT) as markers of hepatic damages and glucose, insulin and HbA1c were measured using commercial enzymatic kits on a Hitachi 917 auto-analyzer. In order to estimate the insulin resistance, HOMA-IR index (a homeostatic model for the assessment for insulin resistance) was calculated as fasting insulin (μmol/mL) × fasting glucose (mmol/L)/22.5 at BML (Tokyo).
Statistical analysis
The data are presented as median values with 25th and 75th percentile values, rather than as mean values with standard deviations because almost all variables, especially markers of inflammation, were not normally distributed. Accordingly, differences between groups were tested by the Mann-Whitney U test and the following multivariate analyses were done after logarithmic transformation of test results for AST, ALT, GGT, TG, RLP-C, RLP-TG, sd LDL-C, adiponectin, hs-CRP, HbA1c and HOMA-IR. Multiple regression analysis was performed for each variable with age, presence of fatty liver (binary: 0 or 1) and waist circumference (cm) set as explanatory variables in order to examine the relative contribution of ‘fatty liver’ to the waist circumference adjusted for age. On the other hand, the relative contribution of the variables in diagnosing the status of fatty liver was evaluated by use of multiple logistic regression analysis. In addition, factor analysis was performed to explore the commonality among the variables based on the principal component method with the varimax rotation of the factorial axes. Comparison of factor scores derived from the analysis between patients with or without fatty liver was made by use of receiver operating characteristic (ROC) analysis. The area under the ROC curve was used as an index of accuracy in differentiating the two conditions. All these statistical analyses were performed by use of StatFlex Ver 6 (Artech, Osaka, Japan). P values <0.05 were considered statistically significant.
Results
The clinical and biochemical characteristics in controls, pre-MetS and MetS cases
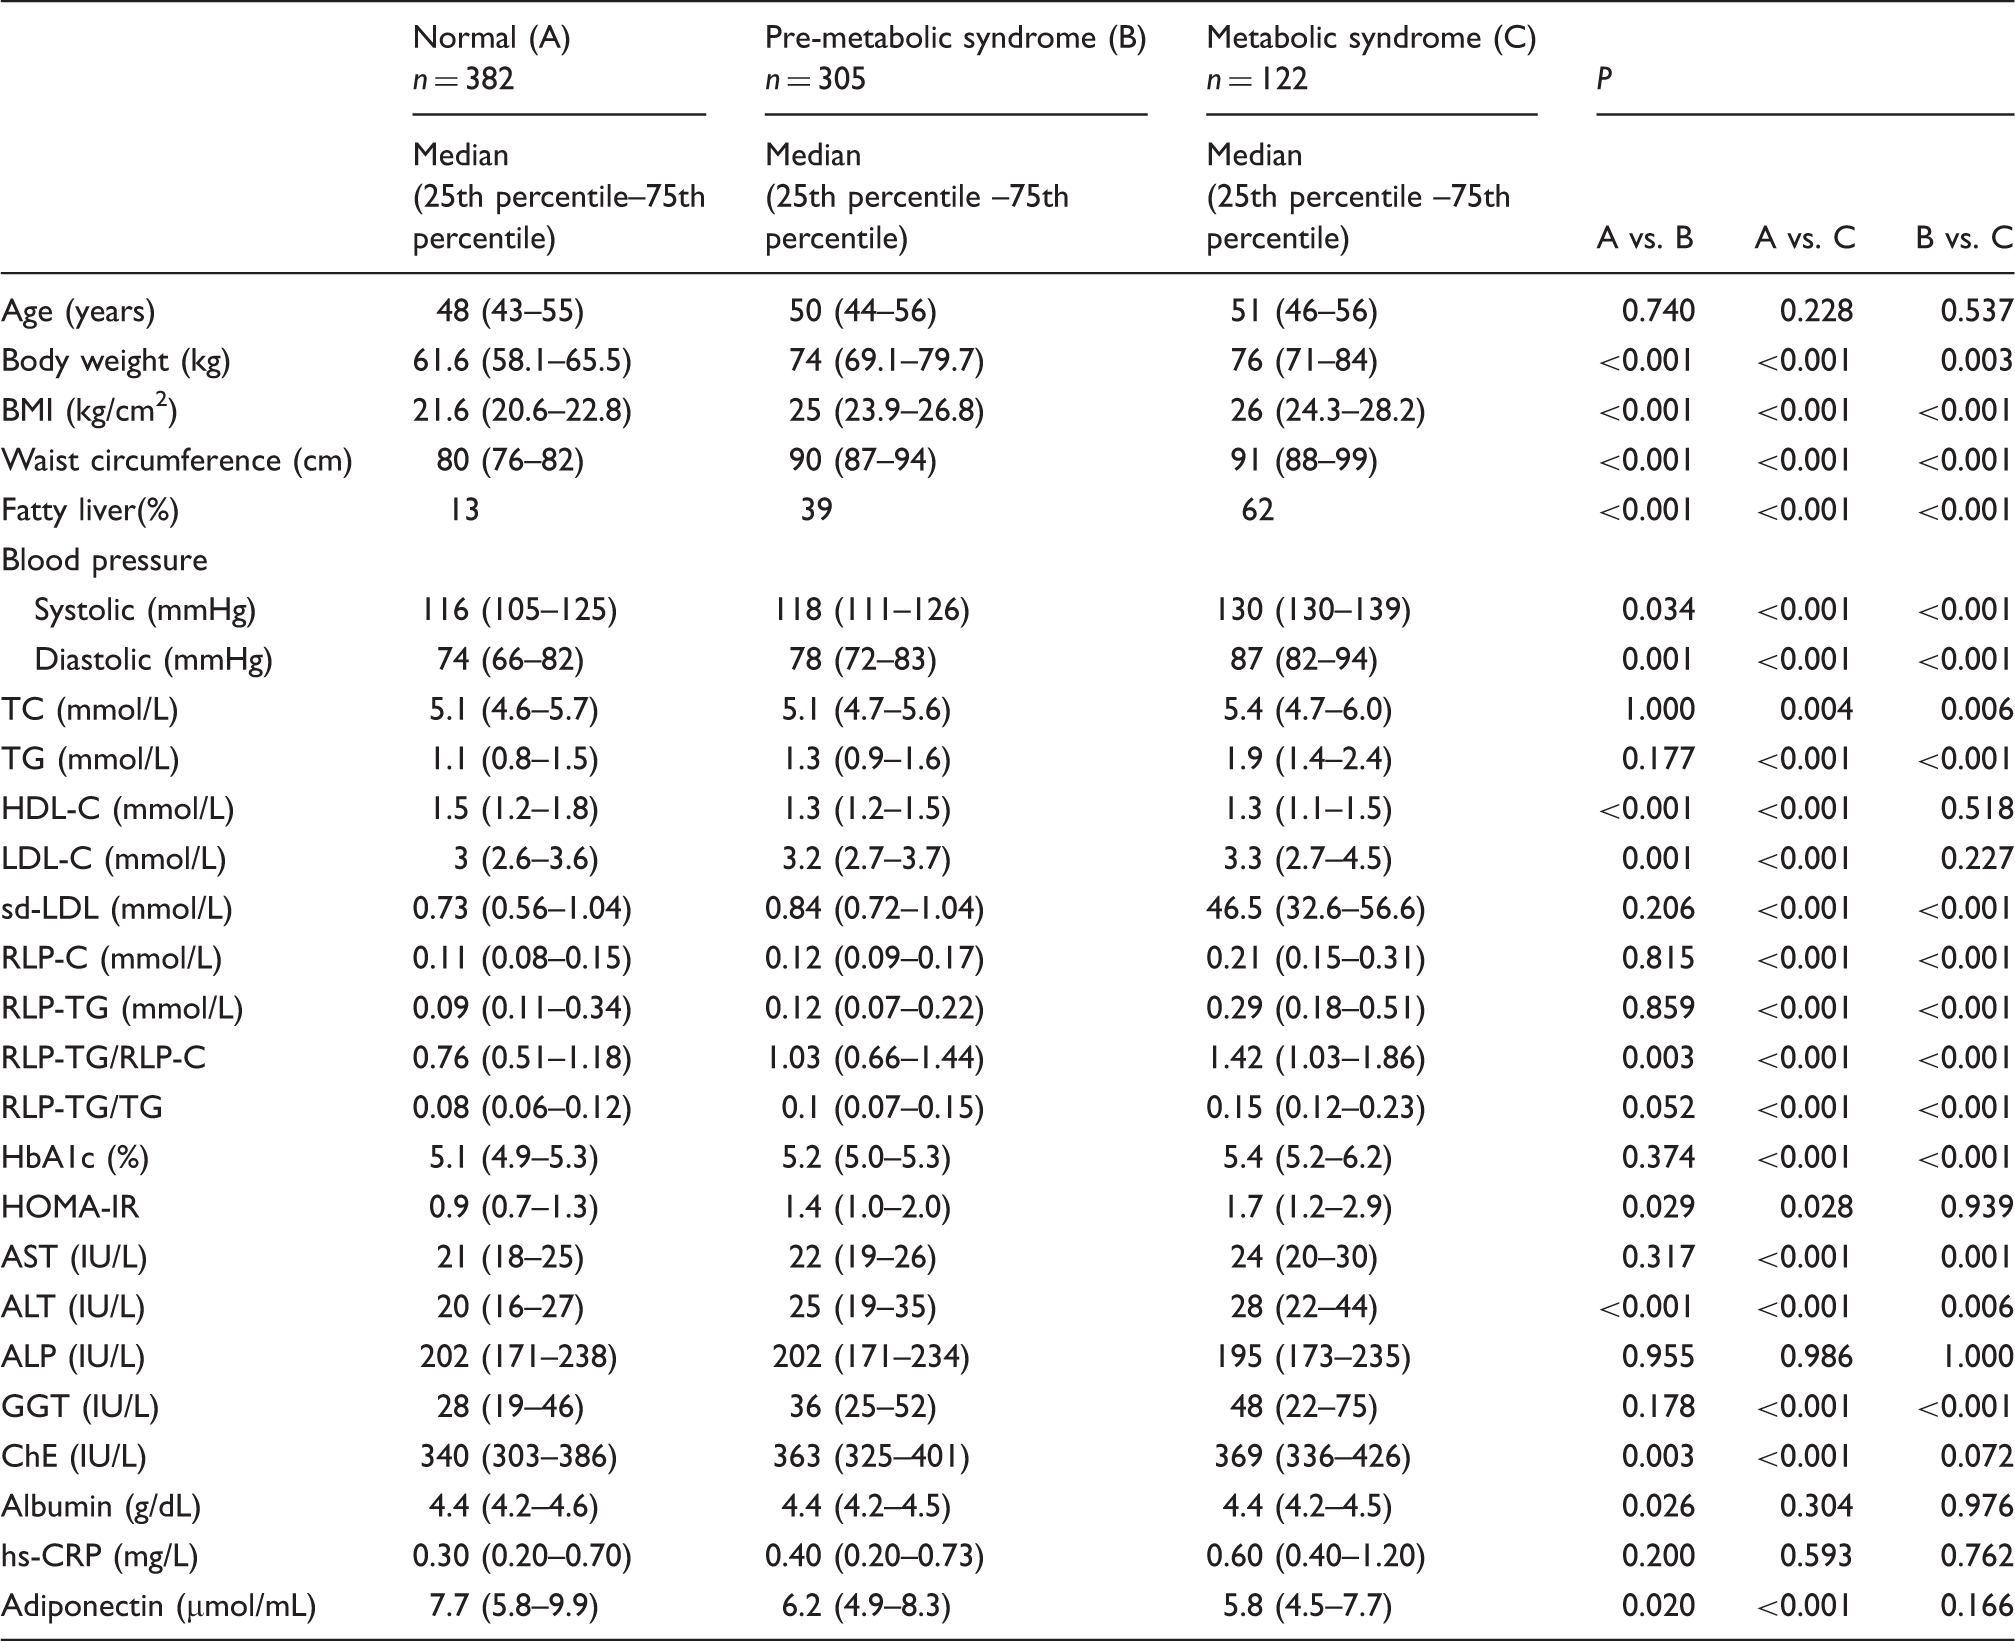
Clinical and biochemical characteristics of metabolic syndrome and control subjects in men.
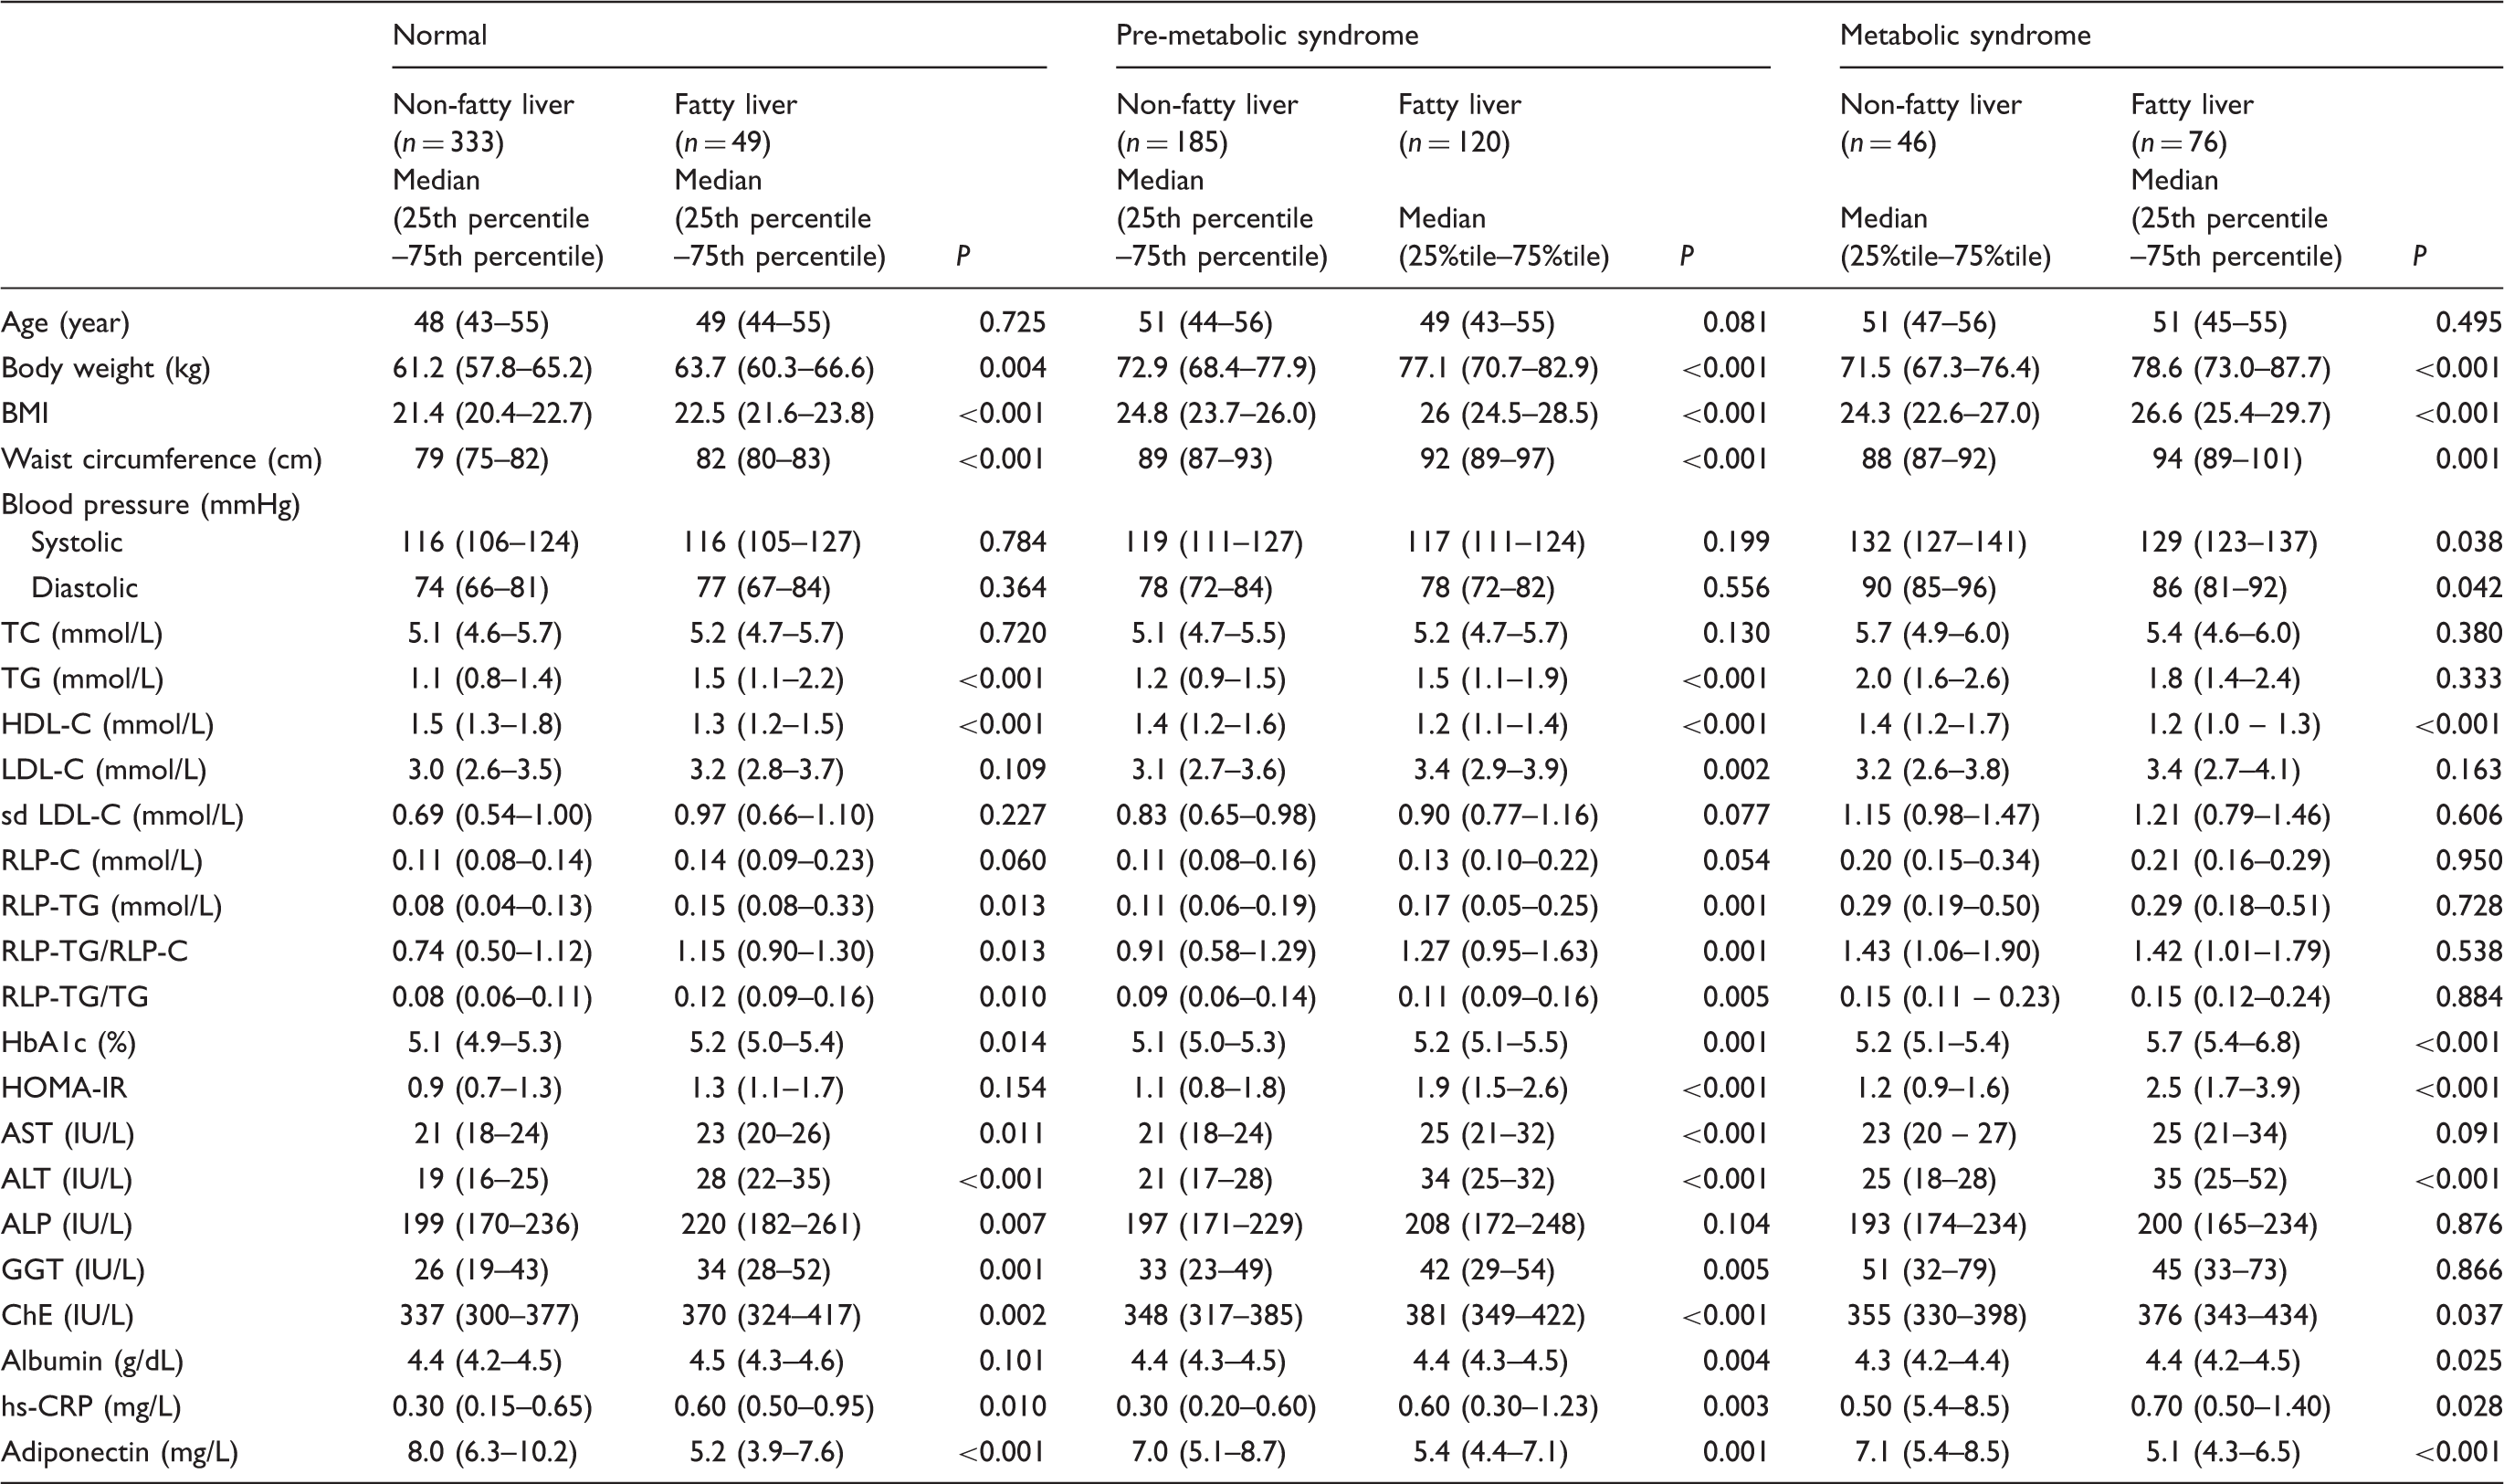
Plasma concentrations of adiponectin, hs-CRP, HDL-C, HOMA-IR and remnant lipoproteins in subjects with and without metabolic syndrome according to the status of fatty liver.
The comparison of diagnostic parameters among the cases with or without fatty liver in controls, pre-MetS and MetS cases
In Table 2, the data are presented as median values with 25th and 75th percentile values, rather than as mean values with standard deviations because almost all variables, especially markers of inflammation, were not normally distributed. All of the parameters among the three groups are further divided into those with or without a fatty liver. These results show the stronger associations with lipoproteins (elevated TG, RLP-TG, RLP-C/RLP-TG and low HDL-C), markers of glucose homeostasis (HOMA-IR), liver function and inflammation (adiponectin and hs-CRP) in those with a fatty liver than those without fatty liver, which were independent from the waist circumference above 85 cm..
A significantly reduced adiponectin concentration was found in the pre-MetS and MetS groups as compared to the control group. Moreover, low concentrations of adiponectin were strongly associated with the prevalence of fatty liver which was found in the control, pre-MetS, and MetS groups (Table1). Adiponectin concentrations were significantly lower in cases with fatty liver versus those without fatty liver in all three groups (control, pre-MetS and MetS) (Table 2). The hs-CRP concentration was also significantly higher in patients with fatty liver versus those without fatty liver in all three groups (Table 2). HOMA-IR was significantly higher in pre-MetS and MetS cases with fatty liver versus those without fatty liver. HDL-C was reduced similarly with adiponectin and reduced significantly with fatty liver in all three groups. Choline esterase (ChE) displayed the same trends as adiponectin, hsCRP and RLP-TG. Also, the cases with fatty liver exhibited significantly higher concentrations of ALT, AST, γGTP and ALP than those without a fatty liver, although most of these concentrations were within the normal cut-off values.
The multiple regression analysis of cardiovascular risk markers for their association with the status of fatty liver
Multiple regression analysis of cardiovascular risk markers associated with age, fatty liver and waist circumference.
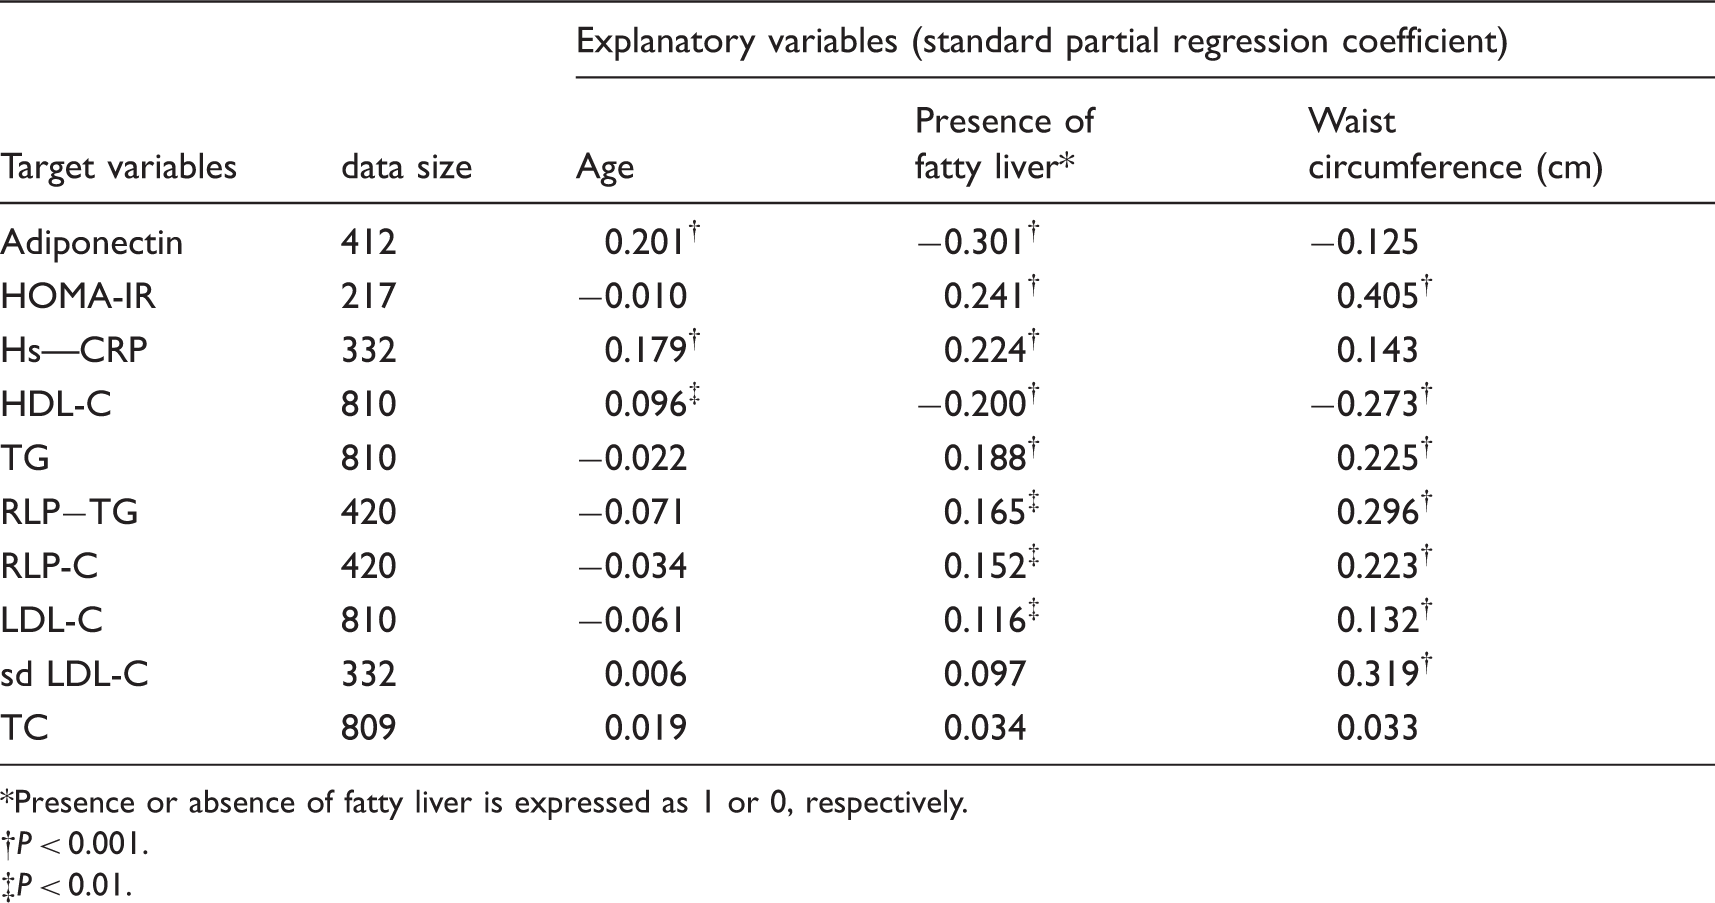
Presence or absence of fatty liver is expressed as 1 or 0, respectively.
P < 0.001.
P < 0.01.
Multiple logistic regression analysis to identify the variables useful in diagnosing fatty liver
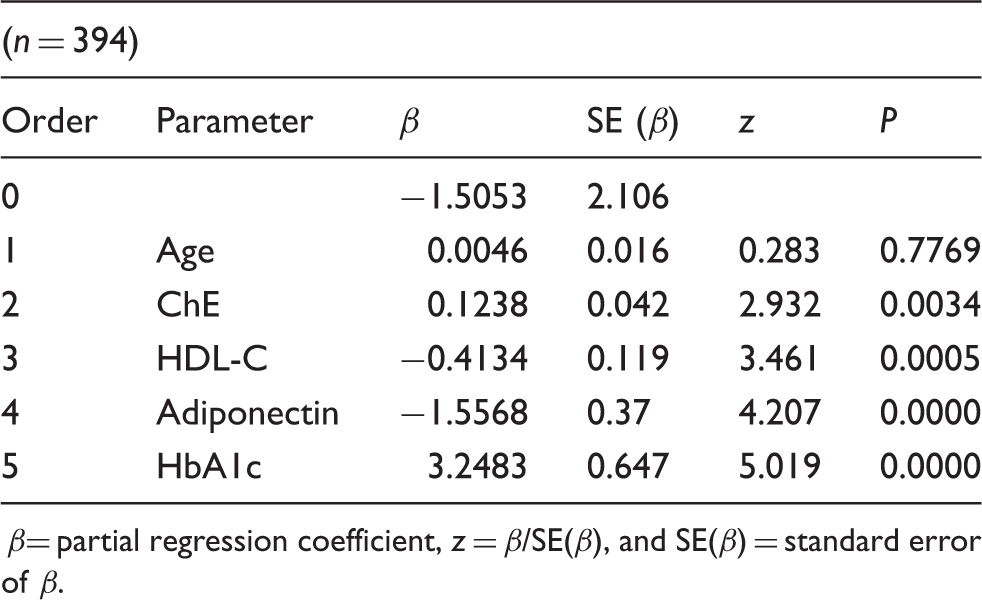
The relative contribution of the variables in diagnosing the status of fatty liver by multiple logistic regression analysis.
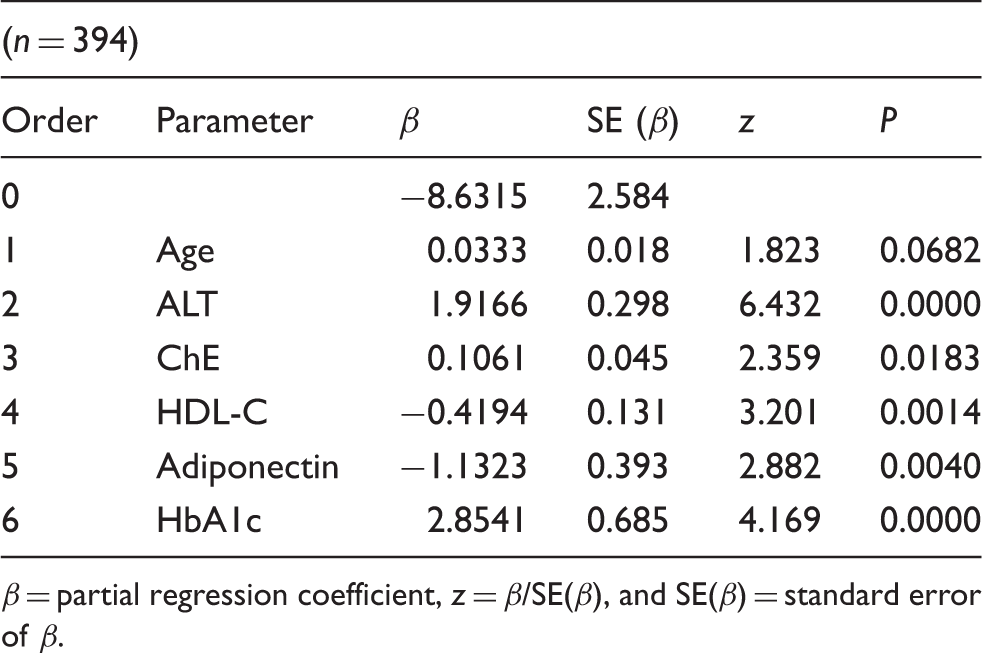
β = partial regression coefficient, z = β/SE(β), and SE(β) = standard error of β.
The relative contribution of the variables without ALT in diagnosing the status of fatty liver by multiple logistic regression analysis.
β= partial regression coefficient, z = β/SE(β), and SE(β) = standard error of β.
Factor analysis for evaluation of commonality among the cardiovascular parameters and liver enzymes
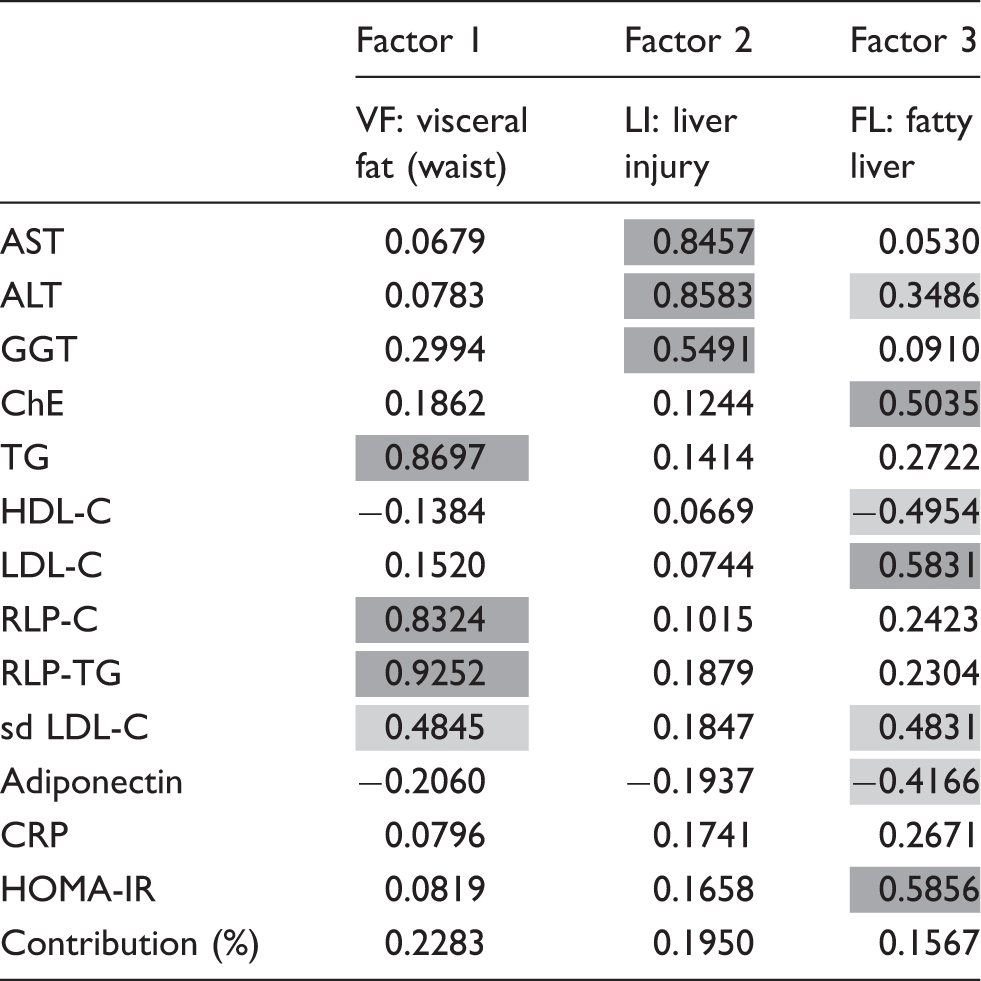
Factor analysis for evaluation of commonality among the cardiovascular parameters and liver enzymes.
The prevalence of low adiponectin concentration (<4 mg/L) with fatty liver in controls, pre-MetS and MetS
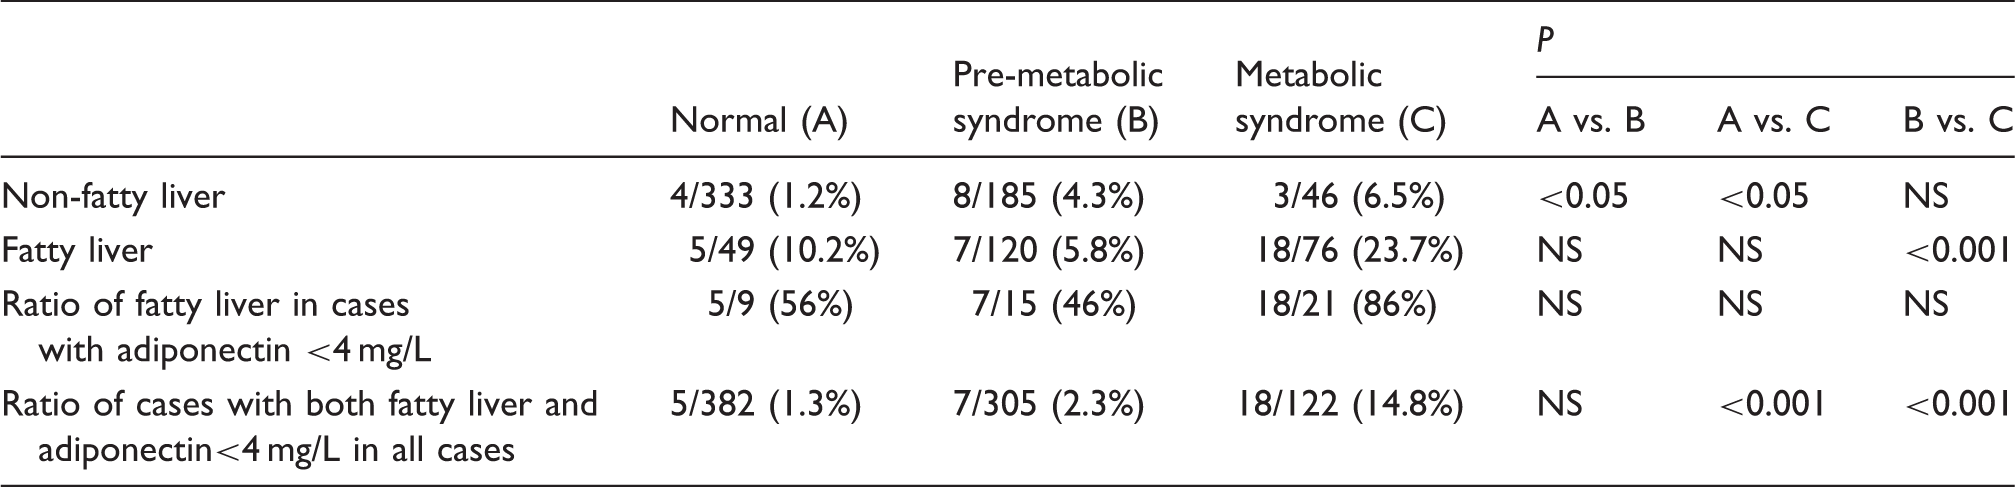
Frequency of the fatty liver in cases with serum adiponectin concentrations lower than 4 mg/L in normal, pre-MetS and MetS groups.
Discussion
Coronary artery disease and CKD, but not chronic liver disease, have been reported to be common causes of death in patients with NAFLD.3,21,22 Therefore, establishing a diagnostic marker for fatty liver associated with CVD is of significant clinical importance. Although certain fatty liver markers, such as ChE, liver enzymes and the markers of dysglycemia are already well established, those diagnostic markers are elevated as a consequence of liver injuries. More rigorous and predictive plasma markers associated with fatty liver and CVD are required in routine clinical practice that can be used together with ultrasonography at general hospitals. This is the first report describing the comparative study among the plasma cardiovascular risk markers, the presence of fatty liver, waist circumference above 85 cm and their associations with liver injury markers in the three different groups of Japanese men.
We have found a significantly higher prevalence of fatty liver in MetS as compared to pre-MetS or controls in our hospital. Therefore, the primary aim of this study was to evaluate the diagnostic markers of fatty liver which are also recognized as cardiovascular risk markers such as adiponectin, hs-CRP, HOMA-IR, HDL-C, LDL-C and RLPs. Another aim of this study was to clarify whether fatty liver is always associated with MetS or plays an important role in predicting the risk of coronary heart disease (CHD) in much the same way as increased visceral fat has been proposed to predict the risk of CHD, especially by evaluating the plasma concentrations of adiponectin.
The anthropometric parameters, such as waist circumference and BMI, differed in the groups with and without fatty liver (Table 2). Our data also show that fatty liver was associated with reduced adiponectin,23,24 increased hs-CRP13,25 and a high degree of insulin resistance, expressed as a higher HOMA-IR index 13 as reported previously. Furthermore, increased RLP-C was observed in the fatty liver group with the higher concentration of insulin resistance.26–28 Other characteristics which were evaluated hepatic enzymes, e.g. ALT and other enzymes associated with liver injuries, and those were mildly to moderately increased in patients with a fatty liver, suggesting that these enzymes were the consequences of liver injury pathogenesis, but not predictors of CVD associated with fatty liver. HOMA-IR has been known to be a marker of diabetes and known as a risk marker for CVD.
The adiponectin concentrations exhibited significant reduction in all three groups with fatty liver similar to HDL-C, regardless of the presence of MetS. Adiponectin secretion has been reported to be suppressed by TNF-α, IL-6, etc. or when adipocytes enlarged with the accumulation of lipids. 29 Therefore, when the waist circumference increases, the enlarged adipocytes in MetS and pre-MetS have been said to reduce adiponectin secretion compared to normal adipocytes in cases with normal waist circumference. However, we did not find the decreased plasma adiponectin concentrations in MetS and pre-MetS cases without fatty liver who had larger waist circumference above 85 cm. Therefore, the decreased plasma adiponectin concentrations in cases with fatty liver may be the consequence of increased hepatic uptake of adiponectin from the blood in order to protect against damages due to fatty liver. Whereas, in the MetS and pre-MetS cases without fatty liver, the hepatic uptake of adiponectin from the blood is not required, and plasma adiponectin concentrations remained normal concentrations. In those cases, adiponectin in enlarged adipocytes may be synthesized and secreted normally as in normal adipocytes. Therefore, we can say that decreased plasma adiponectin concentrations reflect the strong association with the presence of fatty liver, but independent from the visceral fat volume or waist circumference above 85 cm.
CRP has been measured to detect the chronic inflammatory state and taking into account the fact that CRP plays an important role in the progression of NAFLD and atherosclerosis.30,31 A significant increase in hs-CRP concentration with fatty liver was observed in MetS, pre-MetS and normal control cases compared to the cases without fatty liver in our study. Some authors have reported higher hs-CRP concentrations in patients with fatty liver and even proposed it to be a predictor of NAFLD.13,25 On the other hand, Musso et al. 32 did not find any difference in hs-CRP concentration upon conducting an intragroup analysis of insulin resistant patients, comparing those with and without fatty liver. In our findings, there was an increase in hs-CRP among the normal controls, pre-MetS and MetS cases, all linked to the presence of fatty liver regardless of the presence of MetS. CRP may thus play a role in the CHD associated with fatty liver. Ridker et al. 33 reported in the JUPITER trial that the statin significantly reduced cardiovascular events in cases with higher hs-CRP concentrations regardless of LDL-C concentrations. These results may be associated with the attenuation of fatty liver more rather than the reduction of LDL-C by statin treatment, although they did not assess the relationship between the CHD risk reduction and the presence of fatty liver in JUPITER trial.
The relationship between MetS and plasma lipoprotein concentrations such as TG and HDL-C has been well established. 19 RLPs are also reported to increase significantly in MetS. 20
Although both RLP-C and RLP-TG increased significantly in MetS compared to normal controls and pre-MetS, the relationship between the cases with and without fatty liver indicated the different trends from adiponectin and hsCRP. RLP-TG was significantly higher in controls and pre-MS with fatty liver compared to the non-fatty liver cases, but not different in MetS. However, RLP-C was not different between the cases with and without fatty liver in all the three groups, although RLP-C significantly increased in MetS compared with pre-MetS and controls. These results indicate that formation of RLP-C is controlled by a different metabolic pathway from that of RLP-TG. RLP-C formation is known to be strongly associated with cholesteryl ester transfer protein activity in plasma,34–36 while RLP-TG formation is known to be associated with LPL activity which is partly activated by adiponectin.37–40 RLP-TG was most strongly associated with waist circumference among the variables studied, indicating a specific marker of MetS by factor analysis (Table 6). The ratio of RLP-TG/RLP-C is known to reflect the particle size of RLPs,41–43 and RLP particles in fatty liver were shown to be larger particle sizes than those without fatty liver in controls and pre-MetS, but not different in MetS which was significantly larger in both cases (Table 2).
Another significant lipoproteins associated with fatty liver were HDL-C. HDL-C decrease was very similar to adiponectin decrease in cases with fatty liver compared to those without fatty liver in all three groups. Furthermore, HDL-C was also linked to variables associated with liver injury markers and adiponectin as determined by factor analysis (Table 6). Therefore, adiponectin and HDL-C were significantly correlated with liver injury markers which may also be associated with the risk of CVD. The decrease in HDL-C in fatty liver may be due to a similar mechanism to that which lowers adiponectin. Both variables may reduce the plasma concentrations in order to protect against liver injury including oxidative stress damages in fatty liver.
Table 3 shows that adiponectin and hs-CRP were stronger diagnostic markers of fatty liver than waist circumference by multiple regression analyses. Since waist circumference and BMI are highly correlated, we have used waist circumference instead of BMI for this analysis followed by the definition of MetS. HOMA-IR, HDL-C, TG, RLP-C, RLP-TG and sd LDL-C were stronger markers of waist circumference (cm) than the presence of fatty liver. These results suggest that adiponectin and hs-CRP were more strongly associated with the presence of fatty liver, independent of visceral fat volume, regardless of the presence of MetS. However, most lipoproteins were more strongly associated with the visceral fat volume than the presence of fatty liver.
Furthermore, the multiple logistic regression analysis (Table 4) revealed that the important predictors of fatty liver were ALT, HbA1c, HDL-C and adiponectin. The replacement of HbA1c with HOMA-IR in the model resulted in similar manner in the accuracy for diagnosing fatty liver in the same category of insulin resistance. This priority of HbA1c over HOMA-IR in the diagnosis is of clinical importance because HbA1c measurement is more commonly ordered than HOMA-IR at hospital laboratories together with liver enzymes. The addition of adiponectin measurement to the model led to better prediction of fatty liver with higher accuracy. After removing the strongest predictor of ALT (Table 5), HbA1c, adiponectin and HDL-C were proved to be more effective in diagnosing fatty liver. On the other hand, another logistic analysis was performed to explore variables which are effective in diagnosing MetS with waist circumference above 85 cm. RLP-TG and fasting glucose were selected as significant (data not shown). However, adiponectin was not included as a significant variable for predicting MetS. These results indicated the same with the previous study reported by Speliotes et al. 10 at Framingham Study that fatty liver is independent from the visceral adipose tissue when predicted by plasma adiponectin concentrations.
As an additional investigation, we obtained the three factors by exploratory factor analysis as shown in Table 6. Three factors were interpreted as reflecting or representing visceral fat (Factor 1), liver injury (Factor 2) and fatty liver (Factor 3), respectively. Factor 3 showed moderate positive correlation with ALT, ChE, LDL-C, sd LDL-C and HOMA-IR and also moderate negative correlations with HDL-C, and adiponectin. Therefore, Factor 3 was interpreted as representing the status of fatty liver. As a whole, we interpreted the findings as follows: ALT represents both liver injury and fatty liver factors; sd LDL-C represents both visceral fat and fatty liver. Factors such as ChE, LDL-C, HDL-C, adiponectin and HOMA-IR primarily represent fatty liver factor, while TG, RLP-C, RLP-TG primarily represent visceral fat factor. Although hs-CRP was shown to be more significantly associated with the presence of fatty liver than with waist circumference in Table 3, only slight correlations were found with Factor 3 by the factor analysis. The individual scores of Factor 3 (FL-score) were computed and the diagnostic utility of the FL-s core in diagnosing the presence of fatty liver was examined. The AUC representing the accuracy of the diagnosis was 0.822 (data not shown). The use of Factor 3 markers which are most commonly ordered by routine clinical practice at hospital laboratories could bring more accurate detection of fatty liver when adiponectin is added.
The prevalence of fatty liver cases with plasma adiponectin concentration less than 4 mg/L, which has been recommended as the adiponectin cut-off value for MetS or cardiovascular risk assessment in the Japanese population8,31 was 86% in MetS, with significantly lower prevalence in the controls and pre-MetS cases, as shown in Table 7. These results suggest that the co-presence of fatty liver and low adiponectin concentration in MetS is strongly associated with CHD risk.44–47 High prevalence of CHD in MetS thus appears to be closely associated with the presence of fatty liver.48,49 Recently, Ai et al. 50 reported that plasma hypoadiponectin is an independent risk factor for CHD in men in the Framingham Offspring Study. Those results may be associated with the presence of fatty liver in cases with low adiponectin concentrations, although they did not assess liver fat status in this study. Further studies need to be done by multidetector computed tomography examinations of the abdomen which allow for a more precise quantification compared with indirect measures of fatty liver by ultrasonography.
In conclusion, we have shown that adiponectin was found to be a more specific diagnostic marker of fatty liver than waist circumference, regardless of the presence of MetS. Adiponectin was also linked live enzyme, HbA1c and HDL-C, indicating the association between the liver injury pathogenesis and the risk of CVD. RLPs, especially RLP-TG, were found to be the most specific marker of waist circumference, namely visceral fat volume, but not of fatty liver. By adding the measurement of plasma adiponectin concentrations as Fatty Liver- score, we believe that it could predict the CHD risk with higher accuracy in patients with fatty liver in addition to standard risk factors such as HDL-C.
Footnotes
Acknowledgements
The authors deeply thank Professor Kiyoshi Ichihara of Yamaguchi University Graduate School of Medicine for his valuable discussions on the statistical analysis in this study.
Declaration of conflicting interests
The authors declare no conflict of interest.
Funding
This research received no specific grant from any funding agency in the public, commercial or not-for-profit sectors.
Ethical approval
The study was conducted following informed consent and was approved by the Ethical Committees of Hidaka Hospital and of Gunma University School of Medicine.
Guarantor
KN.
Contributorship
All authors confirmed they have contributed to the intellectual content of this paper and have met the following three requirements: (a) significant contributions to the conception and design, acquisition of data, or analysis and interpretation of data; (b) drafting or revising the article for intellectual content and (c) final approval of the published article.