
Abstract
On 3 August 2016 South Africa held its fifth local government elections (LGE) since the end of Apartheid in 1994. Against a backdrop of increasing political frustration with the ruling party's poor performance and continued debates about corruption and cronyism in the highest government circles, the African National Congress (ANC) maintained its dominant position but lost 8 per cent of the aggregate vote (53.91 per cent). The Democratic Alliance (DA) gained some 3 per cent (26.89 per cent) of the vote, and the Economic Freedom Fighters (EFF), first-time LGE campaigners, garnered 8.02 per cent. Importantly, the ANC lost control of three of the seven big metropolitan municipalities it had previously held. Since there was no clear-cut majority in four of the eight metros, coalition politics and the art of compromise will become a major feature of South African politics in the coming years. The elections were highly competitive and considered free and fair. At 57.97 per cent, voter turnout was slightly higher than in 2011.
Despite the fact that local governance was central to the negotiation process that led to the end of Apartheid (Picard and Mogale 2015: 155), subsequent LGEs in South Africa have received rather low levels of attention outside of the country. The 2016 elections were quite different. In the run-up to the fifth LGEs held since 1995/96, dramatic scenarios were discussed with regard to the future of the dominant-party state and Jacob G. Zuma, who is president of both the country and the ruling party. Given the government's poor record on service delivery and its failure to close the ever-widening gap between rich and poor, but more importantly on endemic corruption and party infighting associated with Zuma in particular, most observers not only expected fiercely contested elections, but nothing less than dramatic outcomes, especially in the eight biggest cities (or metropolitan municipalities). However, this happened to only some degree.
Though for the first time since 1994 the ANC's electoral support fell to below 60 per cent, it was reaffirmed as the dominant party. However, compared to the last LGEs held in 2011, on average the ruling party lost some eight percentage points. The official opposition party, the DA, led by Mmusi Maimane, gained some two and a half percentage points, and the EFF, led by former ANC Youth League leader Julius Malema, which for the first time contested LGEs, got 8 per cent of the valid votes cast. The ANC lost three of the seven metros it held before the LGEs. Though it can still rely on its rural electorate, the party seems to be losing the growing urban population.
Run-up to the 2016 LGEs
Since 1994 the ANC has dominated all general and local elections (on the LGEs, see Mangcu 2015). However, in the 2011 LGEs the party's support declined in eight out of nine provinces – “Still on top, but ANC is left shaken,” the Sunday Times titled its election post-mortem (Moyo 2012; see also Kersting 2012). Although the ANC also dominated the last general election, held in May 2014 (see Engel 2014; Ndletyana and Maserumule 2015), dissatisfaction with the ruling party has grown.
The general social conditions have been deteriorating for a number of years: officially, the unemployment rate is 27 per cent (unofficially above 40 per cent); the post-1994 generation is worse off economically than their parents; service delivery, the primary function of local government, is poor and has constantly triggered protests – some of which turned violent; 1 and in recent years people have had to get used to regular power cuts under the state-owned provider, Eskom.
This issue already played a key role in the 2006 LGEs (see Bauer 2009: 37–41). On the nexus between violent protest and protest around poor service delivery, see Amtaika (2013: 291–308).
To make things worse, President Zuma provoked a heavy plunge of the South African currency, the rand (down from ZAR 15.25 per euro to ZAR 17.42 and – in January 2016 – even ZAR 18.36), and risked the country's credit worthiness when, on 9 December 2015, he fired the finance minister, Nhlanhla Nene, only to replace his little-known successor David van Rooyen four days later with the man who was finance minister directly before Nene, Pravin Gordhan. In this context, the deputy finance minister, Mcebesi Jonas, revealed in March 2016 that the Indian Gupta brothers had offered the position of finance minister to him. “State capture” by vested business interests became a catchy slogan – at least until April 2016, when the Gupta family left the country for Dubai under still not fully disclosed circumstances. Zuma (“Zupta”) certainly was suspected of no longer separating state and private family interests.
On 31 March 2016 the Constitutional Court found that Zuma “failed to uphold, defend and respect the Constitution” because he did not abide by the Public Protector's directive to repay some of the ZAR 215.9 million (USD 14.7 million) spent on a swimming pool and animal enclosures at his home in Nkandla, KwaZulu-Natal (see Public Protector 2014). On top of this, on 24 June 2016 the Pretoria High Court dismissed a Zuma appeal, effectively stating that he could still be investigated for 783 cases of corruption that were buried just before his nomination as president in 2009.
All of this brought Zuma into a very difficult situation that he only managed to fence just before the 2016 LGEs. In March 2016, the Oliver and Adelaide Tambo Foundation, the Nelson Mandela Foundation, and the Ahmed Kathrada Foundation, as heirs of the liberation struggle, expressed their deep concern over “the current course on which our country is headed,” going on to state, “We believe this course is contrary to the individual and collective legacy of our Founders.” 2 A few days later, General Siphiwe Nyanda (the former chief of the defence forces, 2005–2010, and commander of the ANC's liberation army Umkhonto we Sizwe [Spear of the Nation, MK] in Angola, 1983–1988) presented a memorandum to the ANC general secretary, Gwede Mantashe, calling on President Zuma to step down. He did so on behalf of 25 former senior commanders and commissars of the armed struggle against Apartheid: “We call on the leadership of the ANC to act against this tendency and reclaim its dignity. We must free the ANC and the State from the influence of the Guptas and their beneficiaries.” 3 On 5 April 2016 Zuma survived an impeachment in the National Assembly by 233 to 143 votes. 4 It was widely discussed whether Zuma would have to step down as ANC leader before or just after the LGEs, or whether he could hold onto the presidency of the party until the next ANC national conference, scheduled for December 2017 (see, for instance, Branson 2016; Tull 2016).
See https://martinplaut.wordpress.com/2016/03/20/we-are-deeply-concerned-about-south-africas-current-course/ (10 April 2016).
See https://africajournalismtheworld.com/2016/03/28/south-africa-former-mk-head-nyanda-calls-on-zuma-to-make-dignified-exit/ (10 April 2016).
See www.bdlive.co.za/national/2016/04/05/zuma-easily-survives-impeachment-vote (10 April 2016).
Against this backdrop, only 59.3 per cent of the voting-age population participated in the 2014 general election. A key question for the 2016 LGEs, therefore, was whether opposition parties would manage to mobilise in high numbers voters who were unhappy with the ANC government. The campaigns themselves were remarkably devoid of content:
The ANC has simply used race, the DA has used Mandela, the EFF has used anger. […] The ANC has relied on the past, rather than policy throughout this campaign. This has been a campaign dominated by personalities, and the squabbles, petty and personal, between them. Not unlike elsewhere in the world, LGE 2016 was more about politics of identity than politics of delivery. 5
Stephen Grootes, LGE 2016: Payback Time from the ANC's Old Leaders, in: Daily Maverick, 2 August 2016, online: www.dailymaverick.co.za/article/2016-08-02-lge-2016-payback-time-from-the-ancs-old-leaders/#.V71WNTXQNaU (2 August 2016).
The Results of the 2016 LGEs
As of 1 June 2016 a total of 26,333,353 voters were registered, of which 1.38 million represented new registrations (out of which 547,534 were first-time voters aged 18 to 19 years; IEC 2016a). This was approximately 77 per cent of the voting-age population (estimated to be approximately 34.2 million). The turnout of the 2016 LGEs was 57.97 per cent – a slight increase compared to the 57.64 per cent turnout in 2011. Figures across provinces vary considerably, from 63.47 per cent in Western Cape to 50.33 per cent in Limpopo. Thus, roughly 46.15 per cent of the voting-age population participated in the 2016 LGEs – 13.19 percentage points fewer than in the 2014 general elections, but 7.26 points more than in the 1995/96 LGEs.
According to the Local Government: Municipal Electoral Act 27 of 2000, read with the electoral regulations issued by the Independent Electoral Commission (IEC), local elections are governed by a mixed-member proportional (MMP) electoral system, combining the proportional representation (PR) and first-past-the-post systems (FPTP). Thus, there are votes for party wards and party lists.
The ANC lost 8.06 percentage points against the 2011 LGEs and 8.24 points against the 2014 general elections (see Table 1). The DA gained 2.95 points (or +4.66 against the 2014 general elections). Running for the first time in LGEs, the EFF got 8.2 per cent of the vote (against 6.35 per cent in the 2014 general elections). The Inkatha Freedom Party (IFP) received 4.25 per cent of the votes, which was an improvement against the 2014 general elections and the 2011 LGEs, with respective gains of 1.85 and 0.68 percentage points.
Compared to the 2011 LGEs, the ANC lost considerably in all provinces but KwaZulu-Natal (+0.69 percentage points) – on average dropping 8.06 points (here and in the following, see IEC 2016b). Its biggest losses occurred in North West (-14.65), Gauteng (-13.81), and Limpopo (-11.84). And compared to the first LGEs held in 1995/96, over the past 20 years only in KwaZulu-Natal and Northern Cape has the ANC managed to increase its average vote (+24.88 and +9.26 points, respectively). In all other provinces it has lost votes – most dramatically in Western Cape (-10.88 points in absolute terms, or, 29.23 per cent of the share of its votes), North West (-14.92 points / −20.08 per cent), and Eastern Cape (-15.59 / −19.27). Still, in all provinces but Western Cape the ANC maintains a majority of votes against the DA. The difference between the two parties varies from a huge 60.69 percentage points in the mainly rural Limpopo to 8.64 points in the much more urbanised Gauteng Province (average national difference: 27.02 points).
At the same time, the DA has on average improved by 2.95 percentage points – with slight losses in Mpumalanga (-0.85 points) and North West (-0.97) that were compensated for by gains in Western Cape (+5.63 points), Gauteng (+3.78), and Eastern Cape (+3.5). In some provinces, the DA did not manage to come in second: the IFP captured the second-most votes (18.39 per cent) ahead of the EFF in KwaZulu-Natal, and the EFF was runner-up to the ANC in Limpopo and North West (16.73 and 15.52 per cent, respectively).
Overall Results: Selected Parties in General Elections (grey) vs. Local Government Elections (in per cent)
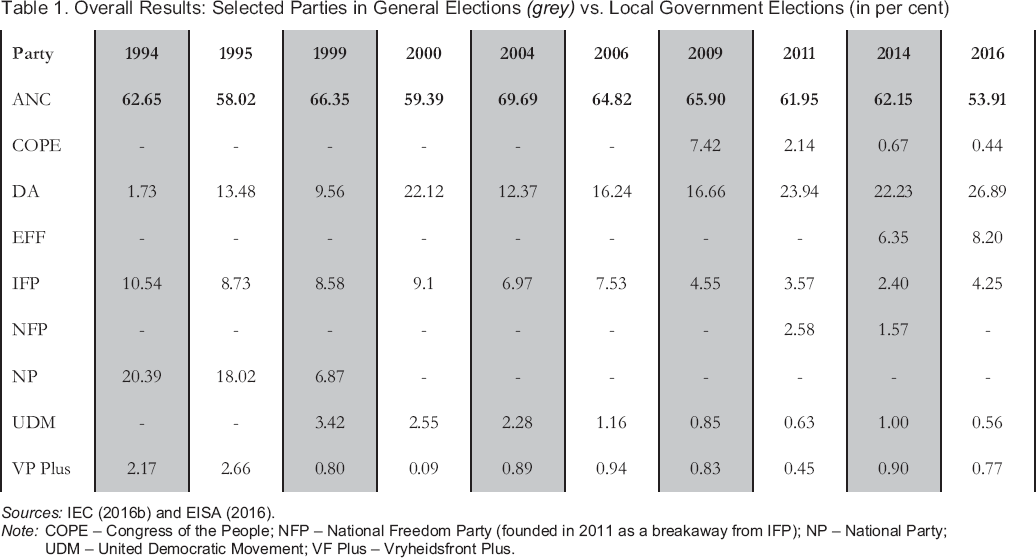
Sources: IEC (2016b) and EISA (2016).
Note: COPE – Congress of the People; NFP – National Freedom Party (founded in 2011 as a breakaway from IFP); NP – National Party; UDM – United Democratic Movement; VF Plus – Vryheidsfront Plus.
Countrywide, the EFF held an average of 8.20 per cent of all votes, with considerable variation across provinces (from a 16.73 per cent high in Limpopo to a mere 2.81 per cent in Western Cape). In this year's absence of the IFP breakaway, the National Freedom Party (NFP), which had not paid its party registration fee and therefore was not allowed to stand for election, the IFP got 4.25 per cent on aggregate and also recovered slightly in KwaZulu-Natal (up 2.59 percentage points to 18.39 per cent). Symbolically important, it hung on to the wards of Nongoma (home of the Zulu King Goodwill Zwelithini) and Nkandla (home of the Zuma family), but the results were a far cry from the party's dominance in 2000 (52.95 per cent vs. 96.71 per cent, and 54.00 vs. 92.25 per cent, respectively).
Of all the very minor parties, the African Independence Congress (AIC) – a party founded in 2005 in protest of a land transfer between Eastern Cape and KwaZulu-Natal – came in first with 0.78 per cent of the vote, followed by the mainly Boer and conservative Vryheidsfront Plus (VF Plus, 0.77 per cent) and the United Democratic Movement (UDM, 0.56 per cent), which was founded in 1997 as an ANC/NP breakaway. The AIC achieved above-average results in Eastern Cape (1.33 per cent) and Gauteng (1.12 per cent); the VF Plus in Free State (1.97 per cent), North West (1.83 per cent), and Northern Cape (1.42 per cent); and the UDM in its traditional heartland, Eastern Cape (3.68 per cent). In some areas, independent candidates fared rather well (on average 1.14 per cent but, for instance, in Buffalo City 2.69 per cent and in Mangaung 2.47 per cent).
There are also some real niche parties that campaigned only locally, such as the Bushbuckridge Residents Association (2.25 per cent in Mpumalanga) and the Forum 4 Service Delivery (3.1 per cent in North West), in addition to the 2008 ANC breakaway Congress of the People (COPE, with 2.54 per cent in Northern Cape, but only 0.44 per cent countrywide – after a remarkable 7.42 per cent in the 2009 general elections).
Contested Metropolitan Municipalities
As directed by the Constitution, the Local Government: Municipal Structures Act 117 of 1998 contains criteria for determining when an area must have a category-A municipality (metropolitan municipalities) and when municipalities fall into categories B (local municipalities) or C (district municipalities). There are eight metropolitan areas with a combined 20.5 million citizens (2011, i.e. roughly two-fifths of the country's population), six of them established in 2000 and two in 2011. In the run-up to the 2016 LGEs, these metros were considered to be the major sites of electoral contestation and possible political change of the South African political party system (see Mabin 2006). Not surprisingly, both the ANC and the DA concentrated their electoral campaigns on these areas.
In 2000 the following metros were established: Cape Town (Western Cape); Nelson Mandela Bay (Port Elizabeth, Eastern Cape); eThekwini (Durban, KwaZulu-Natal); Johannesburg Gauteng); Tshwane (Pretoria, Gauteng); and Ekurhuleni (Germiston, Gauteng). In addition, Buffalo City (East London, Eastern Cape) and Mangaung (Bloemfontein, Free State) were designated metropolitan municipalities in 2011. Elections were also held for 44 district municipalities and 207 local municipalities.
The ANC lost its majority in three of the seven metros it held. Losing Nelson Mandela Bay in Eastern Cape may have hurt it most in symbolic terms (see Prevost, Steyn Kotze, and Wright 2014). The reigning party lost 10.99 percentage points to end up at 40.92 per cent, and the DA gained 6.58 points to make it 46.71 per cent. The ANC also lost its absolute majority to the DA in Tshwane (41.22 per cent as opposed to 55.32 per cent in 2011 vs. 43.11 per cent as opposed to 38.65 per cent in 2011). It also lost its absolute majority, but remained the strongest party, in Johannesburg (44.55 per cent, down from 58.56 per cent in 2011) and in Ekurhuleni (48.64 per cent, down from 61.63 per cent). Still, in these two metros the DA failed to win a majority (38.37 per cent and 33.65 per cent, respectively). However, the ANC held on to Buffalo City (58.74 per cent, previously 70.01 per cent), Mangaung (56.52 per cent), and eThekwini (56.01 per cent). In Cape Town, the DA extended its majority from 60.92 to 66.61 per cent of the vote, while the ANC lost 8.54 percentage points to come in second (26.22 per cent). The EFF achieved above-average results in the Gauteng metros of Ekurhuleni (11.23 per cent), Johannesburg (11.09 per cent), and Tshwane (11.23 per cent), while it showed rather weak results in Cape Town (3.17 per cent) and Durban (3.44 per cent).
Thus, only in four of the eight metropolitan areas does any of the parties have an outright majority of seats: the ANC in Buffalo City, eThekwini, and Mangaung, and the DA in Cape Town (see Table 2). But there is no clear-cut majority for any party in Ekurhuleni, Johannesburg, Nelson Mandela Bay, or Tshwane. In addition, there are another 23 hung councils (IEC 2016b). Thus, already with a view to the 2019 general elections political parties will have to think about forming coalition governments and negotiate their programmes accordingly. In the past, coalition policies have been practised only at council level and in Cape Town (since 2002), but not in other metros (Netswera 2012).
Seats Held by Political Parties in Municipalities 2016 and 2011
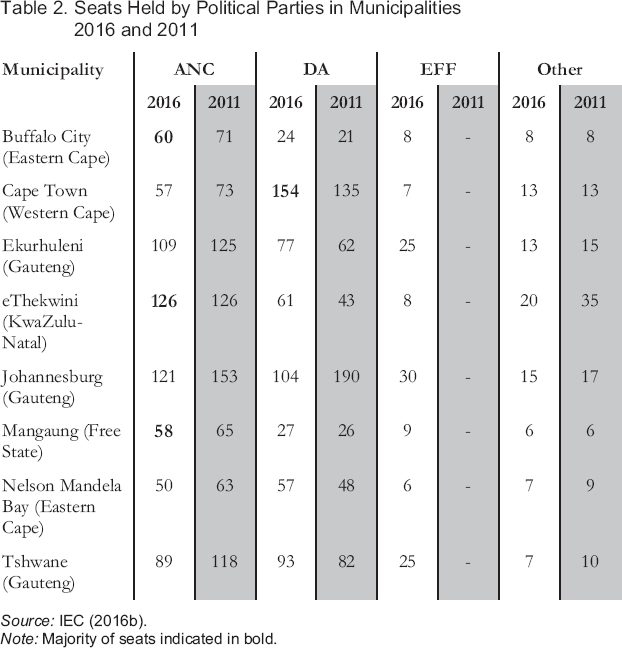
Source: IEC (2016b).
Note: Majority of seats indicated in bold.
So, what's changed?
Pre-election polls had already indicated rising levels of frustration with the ANC and a lack of trust not only in the Zuma administration but also in the democratic system (Branson 2016: 3; Lekalake 2016). Thus, the results do not really come as a big surprise. Most are in line with midterm electoral trends – though they clearly have been accelerated by the public's perception of the ANC's performance under the Zuma administration. The ANC's hegemony has come under attack, especially in the metropolitan municipalities and their townships (Paret 2016), yet the dominant-party state (Southall 2005) has proved to be fairly stable. The 2016 LGEs strongly suggest that the future of South African politics, both at national and subnational levels, will be decided in two arenas: the ANC and the metros.
Overall, the post-Apartheid party system continues to steadily evolve: After the demise of the National Party and the IFP in the late 1990s, the DA continued its rise as the official opposition party while the EFF seems to be the first ANC breakaway with some chance to last. The development of a two-party system (Amtaika 2013: 265f.) is not on the cards. The DA has profited from a generally changing voting pattern, which has both attested to the apparently decreasing role of ethnic identity (“race”) and managed to mobilise supporters of former ANC President Thabo Mbeki who would not want to vote pro-Zuma. Many voters clearly did not consider the DA a “white” party, as was suggested by the ANC who again tried to “play the race card” (on the ANC's 2011 racial-nationalist campaign, see Moyo 2012: 371). The often-provocative protest party EFF continued its slow ascent. In negotiations about coalitions in the metros, the EFF will now be tasked with figuring out how to ready itself for actual government service. The IFP that once was striving to compete with the ANC on a national level remains a party with relevance only in KwaZulu-Natal and – despite its momentary recovery – even there, it has been relegated to the status of a rural party.
The 2016 LGEs also show that in the margins of the country's polity there are still chances for minority parties, whether they are based on religion (e.g. the African Christian Democratic Party, 0.42 per cent on aggregate; Al Jama-ah in Western Cape, 0.43 per cent), ethnicity (e.g. the VF Plus, 0.77 per cent), regionalism (IFP), or class (rent-payers' associations). Results in many provinces also indicate that issue-specific independents (1.14 per cent) have a marginal chance to garner some support where specific local policy agendas trump regional/national ones.
At the time of writing, little can be said about electoral behaviour. The trend would suggest that the born-free generation, whose members largely did not register for the 2014 general elections, have continued not to express political preferences through the ballot box – somewhat contradicting a hope expressed by Schoeman and Puttergill (2007: 152) after the 2006 LGEs. However, the massive #RhodesMustFall campaign that questioned the current memorialisation policy regarding the Apartheid legacy and the student protests against study fees in 2015 (#FeesMustFall) seem to indicate that this generation is not that apolitical at all.
Regardless of the many dynamics evident in the 2016 LGEs, the fundamental deficits of subnational governance in South Africa still need to be firmly addressed. As Picard and Mogale (2015: 254) neatly summarise,
What is unique in South Africa is the continued bifurcation of governance and service delivery patterns in the so-called developed versus underdeveloped parts of the country. Race continues to be a factor in South African governance at all levels, but particularly at subnational levels because people of different races (except for a small upper-middle-class elite) tend to be segregated geographically from each other.
Plus ça change, plus c'est la même chose (“What goes around comes around”).