
Abstract
The ability to visualize plasmid DNA entrapment in muscle cells undergoing an “in vivo” electroporation treatment was investigated on BALB/c mice using a 7-T magnetic resonance imaging (MRI) scanner using the paramagnetic Gd–DOTA–spd complex as imaging reporter. Gd–DOTA–spd bears a tripositively charged spermidine residue that yields a strong binding affinity toward the negatively charged DNA chain (6.4 kb, Ka = 2.2 × 10³ M−1 for approximately 2500 ± 500 binding sites). Cellular colocalization of Gd-DOTA-spd and plasmid DNA has been validated by histological analysis of excised treated muscle. In vivo MRI visualization of Gd-DOTA-spd distribution provides an excellent route to access the cellular entrapment of plasmid DNA upon applying an electroporation pulse.
Introduction
“In vivo” electroporation is a newly emerging technique aimed at pursuing an enhanced delivery of plasmid DNA [1–3] and hydrophilic drugs [4,5] to tissues in gene therapy or in anticancer treatment. Gene delivery to skeletal muscle fibers is used for the local secretion of angiogenic or neurotrophic factors and for DNA vaccination [6]. The transfer of a foreign gene into muscle fibers by injection of naked plasmid DNA leads to transgene expression, but the level of gene expression can be too low to elicit an immune response [7]. The use of ballistic technology (i.e., “gene gun”) [8] and neutral polymers [9] resulted in a moderate enhancement of gene transfer into skin and muscle. In the 1982 publication by Neumann et al. [10], electric pulses for cell electropermeabilization have been used to efficiently introduce foreign DNA into prokaryotic and eukaryotic cells [11] and in several organs [12]. A clinically important application of pulsed electric fields is the delivery of chemotherapeutic agents to tumor cells (i.e., electrochemotherapy) [13]. Electroporation for DNA delivery has also been exploited to elicit protective antitumor immunity in mice [7,14].
In mice that develop a mammary invasive carcinoma in each of their mammary glands because of the presence of a transgenic rat HER-2 oncogene, repeated electroporations of DNA plasmids coding for the extracellular and transmembrane domain of rat HER-2 receptor keeps the majority of 1-year-old mice tumor free. Compared with DNA vaccination through intramuscular plasmid delivery, the electroporation-based route provides a greater and more persistent immunity [15].
Electroporation occurs when an applied external field exceeds the capacity of the cell membrane. Upon application of a suitable pulse (i.e., 375 V cm−1) between two electrodes placed in the region of interest (ROI), transient hydrophilic pores are formed. Their formation occurs in a time frame of less than a second, whereas their resealing takes minutes. Small molecules continue to diffuse inside the cell for minutes, whereas large molecules (i.e., DNA) can enter the cell only if they were already present in the extracellular matrix at the time of application of the electroporating pulse [1,4]. At present, the success of gene electrotransfer is evaluated indirectly by measuring the expression of a reporter gene and measuring the involved tissue area by analyzing histologic sections.
Current magnetic resonance imaging (MRI) technology displays a superb spatial resolution (up to < 100 μm) and is the technique of choice for in vivo observation of up to a small number of cells labeled with suitable contrast agents [16–21]. Paturneau-Jouas et al. [22] proposed the use of MRI as a noninvasive in vivo method to detect the region involved in the electrotransfer process. The method is based on simultaneous intraperitoneal or local injection of the plasmid DNA and the contrast agent. Increased signal intensity on T1-weighted MR images can be taken as a direct reporter of efficiency and spatial extent of gene electrotransfer. An improved approach relies on the use of a Gd(III) complex that binds to the plasmid DNA. In this study, a positively charged Gd(III) complex bearing on its surface a spermidine residue that binds to the negatively charged polymeric chain of DNA has been synthesized (Gd-DOTA-spd). The stability of the supramolecular adduct formed between the Gd(III) complex and plasmid DNA is high enough to ensure their colocalization.
Materials and Methods
1H and 13C NMR spectra were obtained on a JEOL EX-400 (400 and 100.4 MHz, respectively) spectrometer. Elemental analyses were performed with a Perkin-Elmer (Boston, MA) 240 apparatus.
The longitudinal water proton relaxation rate was measured on a Stelar Spinmaster spectrometer (Stelar, Mede, Italy) operating at 20 MHz by means of the standard inversion-recovery technique (16 experiments, 2 scans). A typical 90° pulse width was 3.5 μsec and the reproducibility of the T1 data was ±0.5%. The 1/T1 nuclear magnetic relaxation dispersion profiles of water protons were measured over a continuum of magnetic field strength from 0.00024 to 0.5 T (corresponding to 0.01-20 MHz proton Larmor frequency) on the fast field-cycling Stelar Spinmaster FFC 2000 relaxometer equipped with a silver magnet. The relaxometer operates under complete computer control with an absolute uncertainty of ±1% in the 1/T1 values. The typical field sequences used were the NP sequence between 40 and 8 MHz and PP sequence between 8 and 0.01 MHz. The observation field was set at 13 MHz. Sixteen experiments of two scans were used for the T1 determination for each field.
Variable-temperature 17O NMR measurements were recorded on a JEOL EX-90 (2.1 T) spectrometer equipped with a 5-mm probe by using D2O as external lock. Experimental settings were as follows: spectral width 10,000 Hz, pulse width 7 μsec, acquisition time 10 msec, 1000 scans, and no sample spinning. Solutions containing 2.6% of 17O isotope (Yeda, Rehovot, Israel) were used. The observed transverse relaxation rates (R2obsO) were calculated from the signal width at half height.
MALDI mass spectra were acquired in the positive reflectron ion mode with delayed extraction on a Reflex III time-of-flight instrument (Bruker Daltonics, Bremen, Germany) equipped with a 337-nm nitrogen laser.
5,10-bis(tert-Butyloxycarbonyl)-1,5,10-triazadecane (
Synthesis of 7,10-bis-(tert-Butyloxycarbonyl)-3,7,10-triazatridecanenitrile (2)
Acrylonitrile (0.285 g, 5.34 mmol, 1.3 eq.) was added to 1,6-bis(tert-butyloxycarbonyl)-1,6,10-trazadecane (
Synthesis of 3,7,10-tris-(tert-Butyloxycarbonyl)-3,7,10-triazatridecanenitrile (3)
BOC-ON (1.08 g, 4.40 mmol) was added in small portions to a solution of
Synthesis of 1,6,10-tris-(tert-Butyloxycarbonyl)-1,6,10,14-tetraazatridecane (4)
Compound
Synthesis of N-(4,8,13-tris-(tert-Butyloxycarbonyl)-4,8,13-triazatridecane)-2-bromoacetamide (5)
To a suspension of K2CO3 (1.7 g, 12.3 mmol) and
Synthesis of 1-(7,11,16-tris-(tert-Butyloxycarbonyl)-3,7,11,16-tetraaza-2-oxo-exadecan)-4,7,10-triscarboxymethyl-1,4,7,10-tetraazacyclododecane (6)
To a solution of DO3AtBu·HBr (1.204 g, 2.02 mmol) and diisopropylethylamine (2.6 g, 20.2 mmol) in CH3CN (40 mL) heated to reflux temperature and kept under N2 atmosphere, a solution of
Synthesis of 1-(3,7,11,16-Tetraaza-2-oxo-exadecan)-4,7,10-triscarboxymethyl-1,4,7,10-tetraazacyclododecane·5HCl (DOTA-spd)
Synthesis of Gd-DOTA-spd
The DOTA-spd ligand (73.2 mg, 0.095 mmol) was dissolved in water (1.5 mL) and the pH was adjusted to 7 by adding 1 M NaOH. GdCl3·6H2O (40 mg, 0.108 mmol) was dissolved in 0.5 mL of water and slowly added to the first solution while maintaining the pH value at 6.7 with NaOH. The mixture was then stirred at room temperature for 16 hr. The pH was then increased to 9, and the solution was stirred for 2 hr. The suspension was centrifuged at 10,000 rpm and filtered over a 0.2-μm syringe filter. The free Gd3+ still present in solution was quantified by UV measurement in the presence of xylenol orange by determining the absorbance ratio between 573 and 433 nm; the overall Gd content was determined by 1H NMR T1 measurement of the mineralized complex solution (in 6 M HCl at 120°C for 16 hr). The excess free Gd3+ was then complexed with a stoichiometric amount (with respect to the excess Gd3+) of ligand as mentioned before. The final free Gd3+ was 0.25%. Finally, the solution was lyophilized and a white solid was obtained.
Plasmid and DNA Preparation
pcDNA3 vector (Invitrogen, San Diego, CA) coding the extracellular (EC) and transmembrane (TM) domains of rp185 neu (ECTM plasmid) was produced and used as described [15]. Green fluorescent protein (GFP) plasmid was obtained commercially (Invitrogen). Escherichia coli strain DH5α was transformed with ECTM and GFP plasmids and then grown in Luria-Bertani medium (Sigma, St. Louis, MO). Large-scale preparation of the plasmids was conducted by alkaline lysis using EndoFree Plasmid Giga kits (Qiagen, Chatsworth, CA). DNA was precipitated, suspended in sterile saline water, and stored in aliquots at −20°C for use in electroporation protocols.
DNA Injection and Electric Pulse Delivery
BALB/c mice (Charles River, Calco, Italy) were anesthetized with sodium pentobarbital (1.15 mg ip) while 20 μL of a solution containing ECTM plasmid and contrast agent were injected directly into the leg quadriceps muscles with a 28-gauge syringe needle. Mice of Group 1 received in the left leg 0.3 μmol of the Gd-DOTA-spd and in the right leg 0.3 μmol of the Gd-DOTA-spd mixed with 0.065 mg of ECTM plasmid. Mice of Group 2 received 0.3 μmol of the Gd-HPDO3A (Prohance, Milano, Italy) in the left leg and 0.3 μmol of the Gd-HPDO3A mixed with 0.065 mg of ECTM plasmid in the right leg. Mice of Group 3 received 0.3 μmol of the Gd-DOTA-spd mixed with 0.065 mg of GFP plasmid injected into both the right and the left leg. One minute after the injection, transcutaneous electric pulses were applied by two stainless steel plate electrodes placed at each side of the leg. Electrical contact with the leg skin was ensured by shaving each leg and applying a conducting gel. Two square-wave 25-msec, 375 V/cm pulses were generated by a T820 electroporator (BTX, San Diego, CA).
All experiments with mice were performed according to recommendations of the National Institutes of Health (Bethesda, MD) Guide for the Care and Use of Laboratory Animals.
Magnetic Resonance Imaging
All MR images were acquired on a Bruker Avance 300 (7 T) equipped with a microimaging probe. The system is endowed with two birdcage resonators with 30- and 10-mm inner diameter, respectively. In vivo images of the mice legs (Groups 1 and 2) were acquired 3 days after electroporation using a T1-weighted, fat-suppressed, multislice multiecho protocol (TR/TE/NEX 200/3.2/4, 1 slice = 1 mm). Fat suppression was performed by applying a presaturation pulse (90° BW = 1400 Hz) at the absorption frequency of fat (−1100 Hz from water). Statistical analysis was performed using GraphPad Prism Software. Probability values < .05 were considered statistically different. In vivo T1 was measured using a SNAP (multislice gradient-echo for fast applications) sequence, by applying a preparatory 180° inversion pulse (TR/TE/NEX 3.4/1.9/8, flip angle = 5°). Hyperintense ROIs were defined including all pixels with a signal intensity (SI) 30% higher than those measured on the untreated legs. The integrals of SI values over the ROI area were obtained by using the following equation: SI integrals = mean SI × area (cm2).
Before MRI examinations, the animals were anesthetized as described above. MRI scans were acquired before the treatment (untreated mice) and 3 days after electroporation (Groups 1 and 2 treated mice). Group 1 mice were examined by MRI weekly for 21 days. Group 3 mice were sacrificed 1, 2 (data not shown), and 3 days by intramuscular injection of a lethal dose of sodium pentobarbital. Their quadriceps muscles were then excised, fixed in 4% paraformaldehyde and 154 mmol/L piperazine-N,N′-bis(2-ethanesulfonic acid) (PIPES, pH 7.5, Sigma) overnight at 4°C, and analyzed by MRI and immunohistochemistry. “Ex vivo” imaging was performed using a T1-weighted spin echo protocol (TR/TE/NEX 250/3.2/12, FOV 2.6 cm, 1 slice = 0.7 mm). Two untreated legs were analyzed as control.
Immunohistochemical Procedures
The excised muscle tissues were washed in rinse water and treated with 0.1 mol Tris (pH 7.5) with 0.2% glycine, then dewaxed and embedded in paraffin wax. Serial sections were taken and finally mounted on glass microscope slides (Bacto Laboratories). GFP fluorescence at 488 nm excitation and 520 nm emission wavelengths was analyzed with a confocal laser scanning microscopy system equipped with an argon-ion laser (LSM510, Zeiss, Jena, Germany). All images were prepared at the same contrast and brightness under the same magnification (10×). Images of 512 × 512 were acquired.
Results
Synthesis of the Ligand
The synthesis of 1-(3,7,11,16-tetraaza-2-oxo-exadecan)-4,7,10-triscarboxymethyl-1,4,7,10-tetraazacyclododecane (DOTA-spd) was accomplished starting from the alkylation of 1,6-bis(tert-butyloxycarbonyl)-1,6,10-triazadecane [23] with acrylonitrile (Scheme 1). Boc protection of the free secondary amine, cyanide reduction with hydrogen under pressure, and further alkylation with bromoacetyl bromide led to the synthesis of the arm, which was then attached to the DO3AtBu macrocycle [1,4,7-tris-(tert-butyloxycarbonylmethyl)-1,4,7,10-tetraazacyclododecane]. The latter reaction was carried out in CH3CN in the presence of an excess of DIPEA (ca. 60% yield). Successive deprotection of the carboxylic and amine functionality with TFA led to the formation of the desired product that was isolated as hydrochloride salt. DOTA-spd was characterized by 1H and 13C spectra and the resonances were assigned with the help of 2-D COSY and 1H-13C HMQC NMR experiments. The elemental analysis is consistent with the formation of the pentahydrochloride salt of DOTA-spd. Furthermore, analytical HPLC chromatography confirmed the purity of the final product (higher than 95%).

Schematic representation of the synthesis of DOTA-spd ligand: i, acrylonitrile, 1.3 eq.; ii, BOC-ON, NEt3, 1,4-dioxane/H2O; iii, H2, Ni Raney, EtOH, NaOH; iv, bromoacetyl bromide, K2CO3, CH3CN; v, DO3AtBu; DIPEA, CH3CN; vi, CHCl3/TFA.
Synthesis and Characterization of the Gd Complex
The Gd3+ complex was synthesized by adding 0.108 mmol of GdCl3 to the aqueous solutions of the ligand (0.095 mmol) while maintaining the pH of the solution at 6.7 with 1 M NaOH. The mixture was then stirred at room temperature for 16 hr. The excess of Gd3+ was removed by increasing the pH to 9 and separating the solid by centrifugation at 10,000 rpm followed by filtration over 0.2-μm syringe filter.
The relaxivity (the proton relaxation enhancement of water protons in the presence of the paramagnetic complex at 1 mM concentration) of Gd-DOTA-spd (Figure 1), measured at 20 MHz and 298 K, is 5.6 mM−1 sec−1, that is, a value slightly higher than that reported for the parent Gd-DOTA complex (r1p = 4.7 mM−1 sec−1). The exchange rate (kex = 1/τM) of the inner-sphere water was determined by measuring the transverse relaxation time of 17O nuclei of solvent water molecules as a function of temperature and by fitting the obtained data to the values calculated on the basis of Swift-Connick theory [24]. Gd-DOTA-spd has a τM value, at 298 K, of ca. 940 nsec, in agreement with those previously reported for a number of analogous Gd complexes with variously substituted DOTA-monoamide ligands [25]. Having independently measured τM, the various parameters affecting the observed proton relaxivity r1p can be assessed by analyzing the dependence of the 1H-water relaxation rates as a function of the applied magnetic field (1/T1 NMRD profile; Figure 2). The best fit of the data to the values calculated on the basis of the Solomon-Bloembergen-Morgan equations [26] (for the inner sphere contribution) and of Freed's equation [27] (for the outer sphere contribution) indicates that the increase in relaxivity with respect to the parent Gd-DOTA complex is due to a small lengthening of τr as a consequence of the increased molecular size following the introduction of the spermidine substituent on the surface of the DOTA ligand (Table 1). Gd-DOTA-spd displays a constant r1p value up to pH 1, suggesting overall good stability as far as the release of free Gd3+ ions is concerned.

Schematic representation of the Gd-DOTA-spd complex.

1/T1 1H NMRD profile of a 1 mM Gd-DOTA-spd water solution at pH = 7 and T = 25°C. The solid line through the data points was calculated with the parameters reported in Table 1.
Binding of Gd-DOTA-spd to Plasmid DNA
The assessment of the interaction strength between the complex and ECTM plasmid (6.4 kb) and of the number of binding sites on the polymeric chain was carried out using the proton relaxation enhancement method [25]. In a first titration, the longitudinal water proton relaxation time of a 0.084 mM solution of Gd-DOTA-spd complex was measured at a fixed frequency of 20 MHz and in the presence of an increasing concentration of ECTM plasmid (Figure 3A). For the equilibrium

the product (Ka·n) and r1pb is obtained, where Ka is the thermodynamic association constant, n the number of the equivalent binding sites, and r1pb the millimolar relaxation rate of the macromolecular adduct, respectively. By means of a second titration at constant plasmid concentration (0.28 μM), the number of binding sites was determined. Figure 3B shows the result of the second titration linearized as a Scathchard plot. The interaction between the tripositive Gd-DOTA-spd complex and ECTM plasmid seems to be quite strong [Ka = (2.2 ± 1) × 103 M−1] and each plasmid chain can bind up to 2500 ± 500 Gd-DOTA-spd complexes. The binding yields a 50% increase in the relaxivity (Rb = 11.0 ± 0.4 sec−1 mM−1) of the Gd(III) complex probably as a consequence of the lengthening of its molecular reorientation time.
In Vivo MRI of the Electroporated Area
DNA electrotransfer was carried out by injecting 20 μL of a solution containing 0.3 μmol of the Gd-DOTA-spd complex mixed with 0.065 mg of the ECTM plasmid into the quadriceps muscle on the right posterior leg of BALB/c mice (Group 1). Based on the Ka value, about 70% of the injected dose of the Gd complex is bound to the plasmid chain. The same amount of Gd-DOTA-spd devoid of ECTM plasmid was also injected into the left posterior leg on the same animal. One minute after injection, transcutaneous electric pulses were applied on both legs. After 3 days, when the elimination of the noninternalized Gd complex has been completed, fat-suppressed T1-weighted MR multislice multiecho images (7 T) were recorded. Figure 4A and B clearly shows hyperintensity in both posterior legs with respect to the corresponding image of the same mouse before treatment (Figure 4C). The amount of internalized Gd complex is large enough to obtain a significant effect on MRI signal intensity due to the drastic decrease of the longitudinal relaxation time (T1) in the region of cellular entrapment. However, the extension of the hyperintense regions is markedly different whether the contrast agent is injected alone (0.28 ± 0.097 cm2) or bound to the plasmid (0.13 ± 0.051 cm2), clearly reflecting the occurrence of differences in the internalization pathways. The SI integrals measured on legs in which Gd-DOTA-spd was injected alone were about 40% to 50% higher than those obtained on legs treated with the same amount of Gd-DOTA-spd coinjected with ECTM plasmid (p < 0.003; Table 2). The hyperintensity was detectable at Days 7, 11, and 16, whereas it disappeared at Day 21 in all mice.
Analogous experiments were carried out in mice of Group 2 by replacing Gd-DOTA-spd with the aspecific Gd-HPDO3A (Prohance). As expected, Figure 5 shows that also with this contrast agent the region involved in the electropermeabilization seems easily detectable by T1-weighted spin echo image. Conversely to the result obtained with Gd-DOTA-spd, the extension of the area in the two legs treated with 0.3 μmol of GdHPDO3A with and without ECTM plasmid seems very similar. The differences of SI integrals measured in the ROIs were ≤10% and reflected the normal variability of these determinations (p > 0.91) (Table 3).
1/T1 NMRD profile (T = 25°C, pH = 7)

aBest fitting parameters obtained from the analysis of the NMRD profile by considering one inner-sphere water molecule (q = 1) whose protons are at an average metal distance of 3.1 Å.
bBest fitting parameters obtained from the analysis of the 17O NMR profile by considering the temperature dependence of 7O R2p for an 18 mM solution of Gd-DOTA-spd by using a Gd- 17O scalar coupling constant of −3.8 × 10⁶ rad sec−1 and a Gd- 17O distance of 2.5 Å.

Proton relaxation rate of an 84 μM solution of Gd-DOTA-spd as a function of the ECTM plasmid (6.4 kb) concentration (A) and a 0.28 μM solution of plasmid as a function of the Gd-DOTA-spd concentration (B), both measured at 20 MHz, 25°C, PBS, pH = 7.4.
In addition, to estimate the amount of the Gd complex internalized into the skeletal muscle fibers, the T1 of Gd-DOTA-spd and ECTM plasmid-treated legs (Group 1) were measured in vivo using the SNAP sequence. Assuming that the in vivo relaxivity of the adduct formed by Gd-DOTA-spd and ECTM plasmid is the same as that measured in water at 7 T, the Gd complex concentration in the tissue was calculated by using the following equation:

In vivo MRI of quadriceps muscles treated with Gd-DOTA-spd. T1-weighted spin echo images of the same animal [TR/TE/NEX 200/3.2/4, FOV 3.1 cm, 1 slice 1 mm (A) and TR/TE/NEX 260/4.4/6, FOV 3.6 cm, 1 slice 1 mm (B)] 3 days after the electroporation. Gd-DOTA-spd (0.3 μmol) was injected with (right leg) or without (left leg) plasmid DNA (0.065 mg). T1-weighted spin echo images (TR/TE/NEX 200/3.2/4, FOV 3.1 cm, 1 slice 1 mm) of the same mouse before treatment (C).
Comparison of ROI Signal Intensity Integrals on T1-Weighted Images of Group 1 Mice

The mean SI integrals measured on legs treated only with Gd-DOTA-spd were about 40% to 50% higher than those obtained on legs treated with the same amount of Gd-DOTA-spd coinjected with DNA (p < 0.003). Data are the mean SI ± SD.

where R1 treated is the relaxation rate of protons in the selected ROI of the muscle treated with Gd-DOTA-spd and the plasmid, R1 untreated is the relaxation rate of the same area measured in the untreated mouse, and r1p(Gd/DNA) is the relaxivity of the Gd-DOTA-spd/DNA adduct at 7 T in water (r1p = 7.6). By using this method, it was estimated that a concentration of 0.10 ± 0.07 mmol/L of residual Gd complex is present in the ROI 3 days after the electroporation. On the basis of the presence of 2500 binding sites on the polymeric chain for the Gd complex, the corresponding amount of ECTM plasmid delivered to muscle fibers is ca. (4.5 ± 1.5) × 10−13 mol.

In vivo MRI of quadriceps muscles treated with Gd-HPDO3A. T1-weighted spin echo image (TR/TE/NEX 260/4.4/3, FOV 2.9 cm, 1 slice 1 mm) 3 days after the electroporation. Gd-HPDO3A (0.3 μmol) was injected with (right leg) or without (left leg) DNA plasmid (0.065 mg).
Comparison of ROI Signal Intensity Integrals on T1-Weighted Images of Group 2 Mice
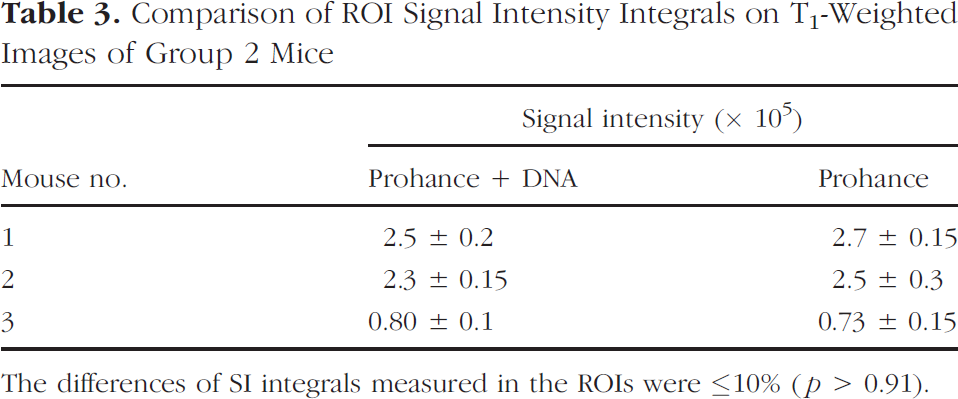
The differences of SI integrals measured in the ROIs were ≤10% (p > 0.91).
Histological Validation of the MRI Observations
To further validate the colocalization of the Gd-DOTA-spd complex the DNA plasmid histological analysis and ex vivo MRI visualization of excised treated muscles were carried out. To this purpose, a plasmid coding for GFP was coinjected with Gd-DOTA-spd into the quadriceps muscle (Group 3 mice). Then an electroporating pulse was applied as described above. After 3 days, the animals were sacrificed and the quadriceps muscles fixed, dissected, and analyzed by MRI and immunohistochemistry. The MR images showed a strong signal enhancement in the electroporated area of all treated mice (Figure 6). At the confocal microscope, very intense GFP-induced fluorescence was observed in the electroporated region (panel B), in good agreement with the hyperintense areas detected in the MR images. Conversely, the GFP response is weak (panel C) or completely absent in the other areas (panel D). Histological analysis showed that GFP expression occurs only in the region subjected to the electroporating treatment; the simple injection of GFP-coding plasmid did not result in a detectable expression of the protein (data not shown).
Discussion
Gd-DOTA-spd is characterized by a residue bearing a tripositively charged spermidine on the surface of the neutral Gd-DOTA-like cage. The linear spd residue can wrap around the DNA chain by setting electrostatic interactions with adjacent, negatively charged phosphate groups. A rough estimate based on the measured binding affinity (Ka = 2.2 ± 1 × 10³) indicates that most of Gd-DOTA-spd is bound to plasmid DNA. It may therefore act as an MRI reporter of the localization of the plasmid. The occurrence of strong binding between the Gd(III) imaging probe and the DNA molecule is an essential requisite for precise assessment of those cells that have successfully entrapped the plasmid through the electroporation process. Thus, the use of Gd-DOTA-spd represents a great improvement with respect to the recently reported use of Gd-DTPA for the visualization of DNA cellular entrapment [22]. Small molecules and macromolecular systems behave quite differently as far as their cellular entrapment in the electroporation experiment is concerned. In fact, for small molecules, diffusion alone appears to be the main determinant of intracellular uptake through the hydrophilic pores in the membrane. Moreover, low molecular weight compounds diffuse into electropermeabilized cells also during the time required for the membrane resealing, which in vivo is about 9 min [1]. On the contrary, it has been shown that no gene transfer takes place if the plasmid DNA is added after the application of the electric pulse. This is because macromolecules (e.g., DNA) enter the cells with a different mechanism driven by electrophoretic forces and the transport and pore formation are facilitated if the DNA is bound to the membrane before the application of the electroporating pulse. In this work, it has been shown that the use of Gd-HPDO3A does not lead to an accurate delineation of the region of plasmid DNA entrapment. Gd-HPDO3A is neutral and does not show any affinity for the negatively charged DNA. The hyperintense region corresponding to the uptake of this small molecule (as Gd-HPDO3A and Gd-DOTA-spd alone) is much wider than that depicted by the internalization of (Gd-DOTA-spd) n DNA plasmid constructs. Further improvement in the sensitivity of the method may be attained by synthesizing spd-containing systems based on Gd chelates characterized by a faster exchange rate of the coordinated water. In fact, the long τm value measured for Gd-DOTA-spd acts as a quenching factor for the relaxivity attainable for the macromolecular adduct formed by Gd-DOTA-spd units bound to the plasmid. The observed relaxivity is only about twice that of the free complex. Relaxation enhancement factors of 7 to 8 have been found in the presence of macromolecular adducts involving Gd chelates characterized by a fast exchange of the coordinated water molecule [28]. Furthermore, an even higher sensitivity enhancement may be envisaged by using Gd chelates with two water molecules in the inner coordination sphere. From the extent of signal enhancement in the spin echo T1-weighted images it is possible to estimate the local concentration of Gd chelate in the given ROI. Having established the number of Gd-DOTA-spd chelates bound to each DNA plasmid chain, the MRI method allows one to give an estimate of the actual concentration of DNA. On the basis of the available DNA, one could anticipate whether the gene expression in the transfected cells will be high enough, for instance, for pursuing an immunogenetic response in DNA vaccination protocols.
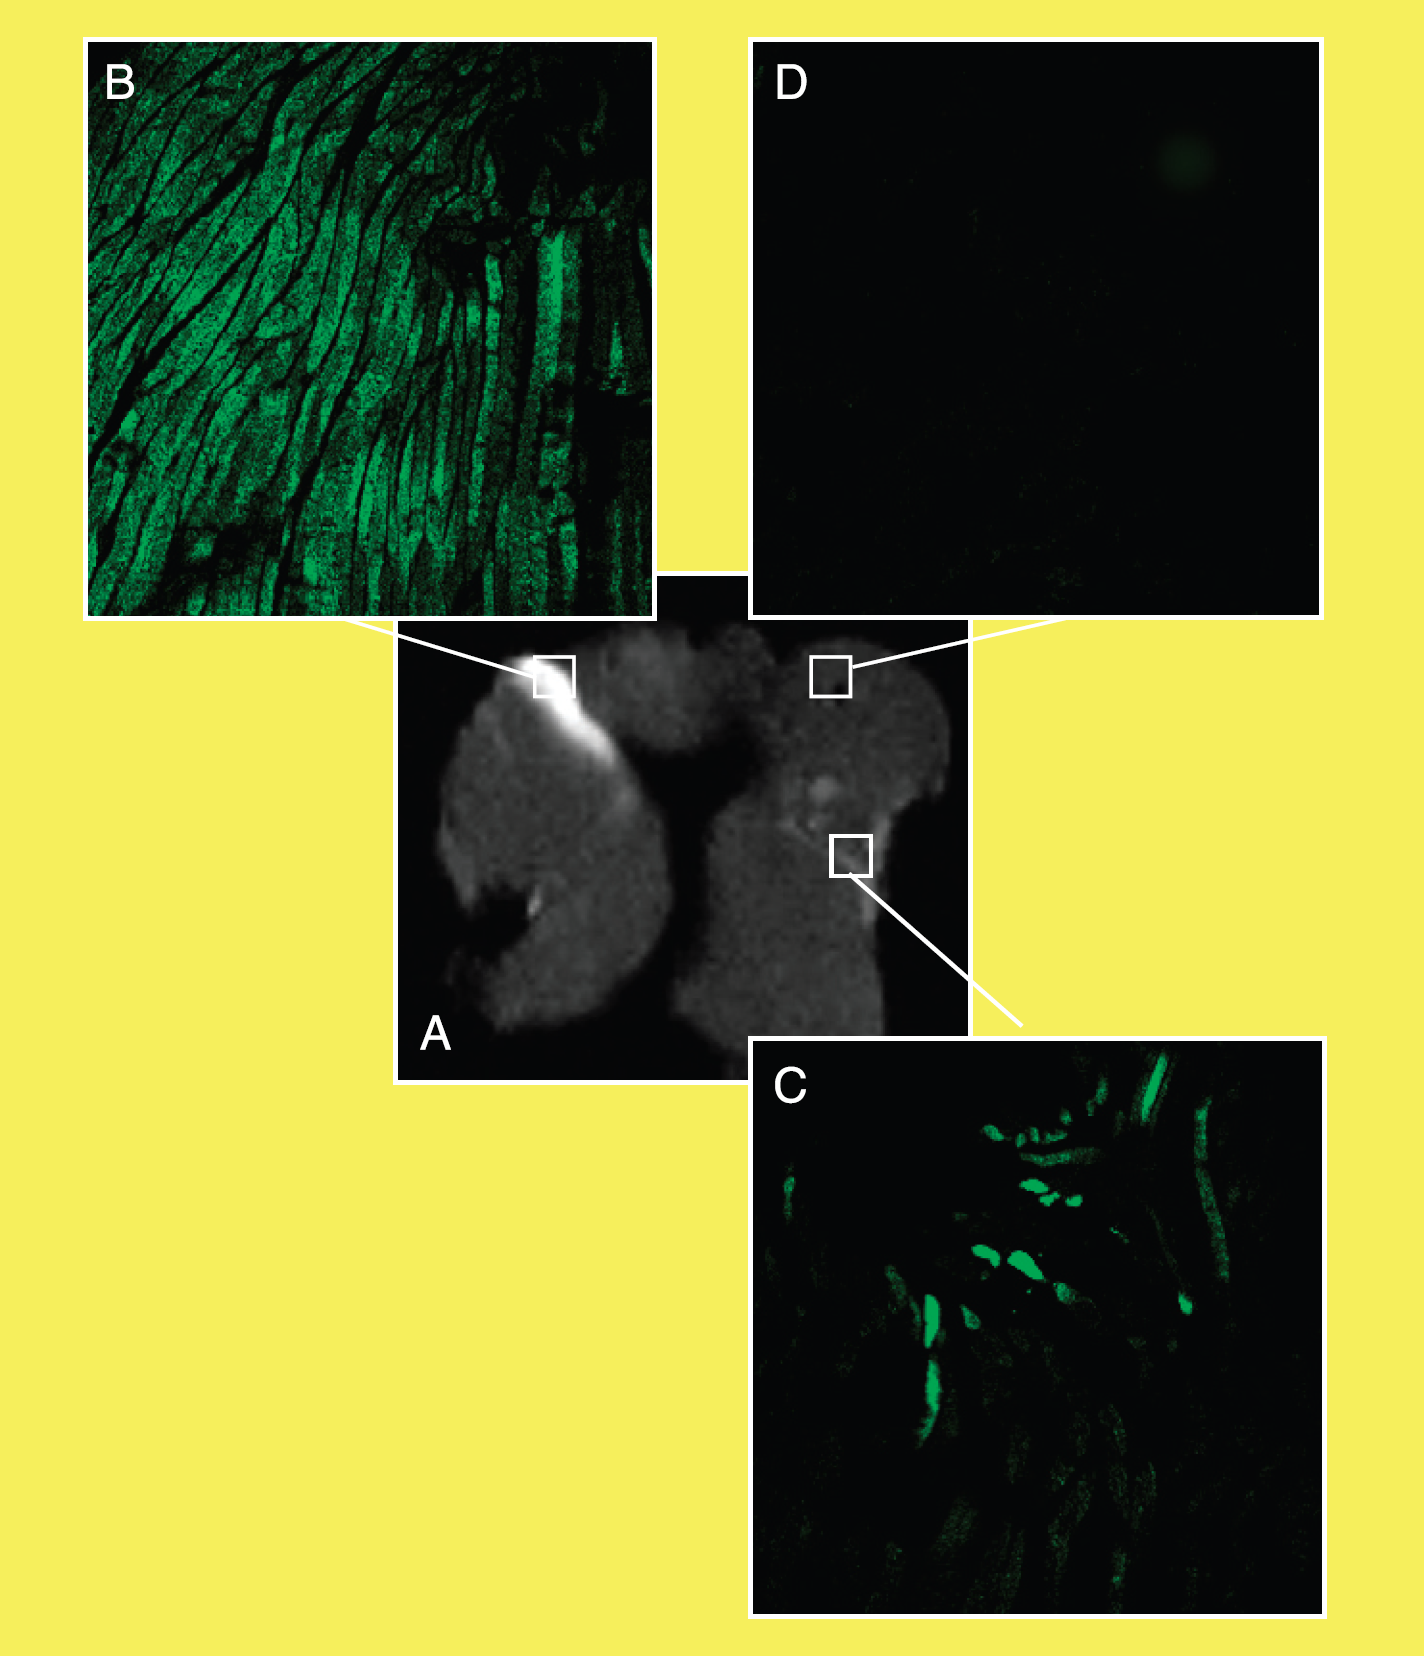
MRI and confocal analysis of a muscle electroporated with Gd-DOTA-spd and GFP-expressing plasmid. Note that the localized distribution of Gd-DOTA-spd (A) corresponds to areas of greater GFP expression (B, magnification 10×), whereas in the other regions the GFP signal is weak (C, magnification 10×) or completely absent (D, magnification 10×).
The lower amount of DNA required as compared with intramuscular DNA vaccination [29], the positive results obtained in large animals [30], along with the availability of devices for electroporation in humans could make the use of DNA electroporation for vaccination not too unlikely.
Footnotes
Acknowledgments
This work was supported by MIUR (PRIN and FIRB project). Support from Bracco Imaging SpA is gratefully acknowledged. Stefania Lanzardo thanks Federchimica for a scholar fellowship.