
Abstract
We examined the accumulation of Cy5.5-labeled annexin V in the paws of mice with and without collagen-induced arthritis, with and without methotrexate (MTX) treatment, by near-infrared fluorescence imaging. Fluorescence reflectance imaging (FRI) of paws was performed 48 hr after MTX injection and at 10 min and 3 hr after the injection of Cy5.5-annexin V (1 nmol dye per mouse). With arthritic paws, MTX treatment caused a 7-fold increase in fluorescence intensity compared with the paws of untreated mice and a 4-fold increase compared to nonarthritic paws of MTX-treated mice (p < .001 each). Tissue samples of paws were examined histologically for Cy5.5 fluorescence and by TUNEL staining for apoptosis. Cy5.5-annexin V was seen in the hyperplastic synovia of MTX-treated mice, and TUNEL staining for apoptosis showed apoptotic cells in the hyperplastic synovia. Monitoring the uptake of Cy5.5-annexin V in arthritic paws by FRI provided a method of assessing a response to MTX, a response that was readily quantitated with simple instrumentation and that occurred before conventional measurements of treatment response.
Introduction
Imaging the alteration in molecular markers after short courses of chemotherapy offers the prospect of determining which patients will benefit from longer-term treatment regimes (see below and ref. [1] for a recent review). The use of molecular imaging in this fashion requires two essential capabilities or conditions. The first is that the level of a molecular marker must be quantifiable through imaging and that the level of this marker must change before changes in gross pathology, such as tumor shrinkage in the case of cancer, or a decrease in joint swelling in the case of arthritic disease. The second is that variations in the levels of the molecular marker between individuals after short courses of therapy must be predictive of variations of longer-term treatment efficacy. Clinical investigation of this hypothesis involves single-photon emission computerized tomography (SPECT) or positron emission tomography (PET) imaging because those are the only modalities capable of the necessary quantitation of molecular markers used in the clinic. Several studies have assessed decreased [18F]FDG uptake as an early indicator of the response to cancer chemotherapy [2–6]. An alternative to the decreased uptake by [18F]FDG is provided by the increased uptake of [99m]Tc-annexin V, which has been used to monitor the early response of chemotherapy in a limited number of patients with cancer [7].
The antiproliferative effects of the folate antagonist methotrexate (MTX) have made it a useful drug for the treatment of cancer and arthritis. The ability to image and quantify levels of molecular markers that change early in the course of MTX therapy might be useful in understanding the mechanism of drug action because such early changes might provide clues to the mechanisms underlying longer term therapeutic benefits. In addition, the ability to image molecular markers after short-term chemotherapy might provide a basis for studying the relation between variable marker expression from individual to individual and longer term drug efficacy. We therefore examined levels of phosphatidylserine (PS) expression after MTX treatment using a murine model of collagen-induced arthritis (CIA) by injecting Cy5.5-annexin V and imaging its accumulation in paws using fluorescence reflectance imaging (FRI). Here we demonstrate that annexin V, a probe for extracellular facing PS, accumulates in the paws of mice with CIA 48 hr after MTX injection, at a time when the gross pathology of the paw (swelling and ankylosis) is unchanged. To demonstrate this, we used a fluorescent annexin V (Cy5.5-annexin V) and FRI, a method that avoids radioisotopes, uses relatively simple instrumentation, and is well suited to imaging molecular markers in murine paws because the light needs to travel through only 1–2 mm of tissue and is therefore minimally attenuated.
Materials and Methods
Cy5.5–Annexin V and Aminofluorescein-Labeled Human Serum Albumin
Pure annexin V was obtained from Theseus Imaging (Worcester, MA) and reacted with the N-hydroxysuccinimide ester of Cy5.5 (Amersham-Pharmacia, Picataway, NJ) as described [8]. Aminofluorescein-labeled human serum albumin (AFLc-HSA) was prepared as described and had 0.5 to 1 fluorochrome per mole of albumin [9].
Animals and Arthritis Model
All studies were approved by the institutional animal care committee. CIA was employed, as first described by Wooley [10] and in detail elsewhere [11]. Briefly, male DBA-1J mice, 4–5 weeks of age (Jackson Laboratory, Bar Harbor, ME), received intradermal injections of an emulsion (bovine II collagen, Mycobacterium tuberculosis, incomplete Freund's adjuvant) at the base of the tail (50 μL each). Three weeks after the first immunization, the procedure was repeated. Within two weeks after the second injection, 6 of 10 mice developed arthritis characterized by erythema and swelling of the paws.
MTX Treatment and the Administration of Cy5.5–Annexin V
Six mice with arthritis were randomly divided into two groups of three, one of which was injected with MTX, the other with saline. Mice received 35 mg MTX/kg (Ben Venue Laboratories Inc., Bedford, OH) or saline by tail vein injection. After 48 hours, Cy5.5-annexin V (1 nmol dye per mouse) and aminofluorescein-labeled human serum albumin (AFLc-HSA, 0.5 mg/kg) were injected by tail vein. Paws were initially divided into normal or arthritic groups based on visual criteria (apparent volume, ankylosis).
In Vivo Optical Imaging and Image Analysis
Reflectance fluorescence imaging was performed using an imaging system described previously [12], adapted for fluorescein and Cy5.5 dual-channel imaging as described [13]. Mice were anesthetized with ketamine/xylazine (80/12 mg/kg body weight) and imaging was performed 10 min and 3 hr after injection of Cy5.5-annexin V and AFLc-HSA. White light images were taken, followed by near-infrared fluorescence (NIRF) images (image acquisition time, 120 sec). Images were analyzed with commercially available software from Kodak (Kodak Digital Science 1D, Kodak, Rochester, NY) for image field correction, and Image J software (National Institutes of Health, Bethesda, MD). Regions of interest (ROI) were placed over the paws, the skin (snout), and the reference standard of Cy5.5. The fluorescent signal of the mouse paws, expressed as relative fluorescence intensity (RFI), was calibrated to the standard, subtracting the skin as background as described [8]. The snout was used to obtain a value for skin fluorescence because fur obscures other anatomical areas. Data are presented as means plus or minus the standard error of the mean (SEM). Statistical significance was tested using Student's unpaired t test. p values less than 0.05 were considered significant.
Histology
After FRI at 3 hr post injection, paws were fixed for 48 hr in 10 % formalin and decalcified using Fisher's decalcifier A and B (24 hr each), rinsed in water for 24 hr, fixed again for 48 hr in 10 % formalin (all at room temperature), paraffin wax embedded, and cut into 8-μm serial sections. Tissue sections were analyzed for NIRF (Cy 5.5–annexin V) and green fluorescence (AFLc-HSA) with an inverted epifluorescence microscope (Axiovert; Zeiss, Thornwood, NY) equipped with a cooled, charge-coupled device camera (Sensys; Photometrics, Tucson, AZ) and fitted with filter sets to detect Cy5.5 and fluorescein fluorescence (Omega Optical, Brattleboro, VT). After fluorescence microscopy as above, the serial sections were stained with hematoxylin and eosin (HE) and with a commercially available terminal desoxyribosyl transferase-mediated dUTP nick end labeling kit (TUNEL stain; ApopTaq Red Kit; Intergen, Purchase, NY).
Results
White light and NIRF images 3 hr after Cy5.5-annexin V injection are shown in Figure 1. A four-group experimental design was used consisting of normal or CIA paws treated with saline or MTX. Fluorescence of all four groups of paws increased between 10 min and 3 hr, a time course similar to that seen with the accumulation of Cy5.5-annexin in the cyclophosphamide-treated Lewis lung carcinoma model [14]. With CIA paws, MTX treatment was associated with an increased NIRF signal compared to no MTX treatment or compared to MTX-treated normal paws. The magnitude of the increase is shown in Figure 2. With CIA paws, MTX treatment produced an increased fluorescence, expressed as the RFI, with the mean increasing from 75 to 554, or about 7-fold. With non-CIA paws, MTX increased the RFI from 32 to 131, or about 4-fold. The effects of MTX treatment were highly significant for both CIA and normal paws (p < .001 each). Of interest was the fact that after 3 hr without MTX treatment, arthritic and normal paws had similar signal intensities compared with normal paws (<i>p > .05), indicating the arthritic state of the joint per se did not result in an increased Cy5.5-annexin V accumulation. Ankylosis and paw weights appeared to be unaffected during the 48 hr after MTX treatment (data not shown).
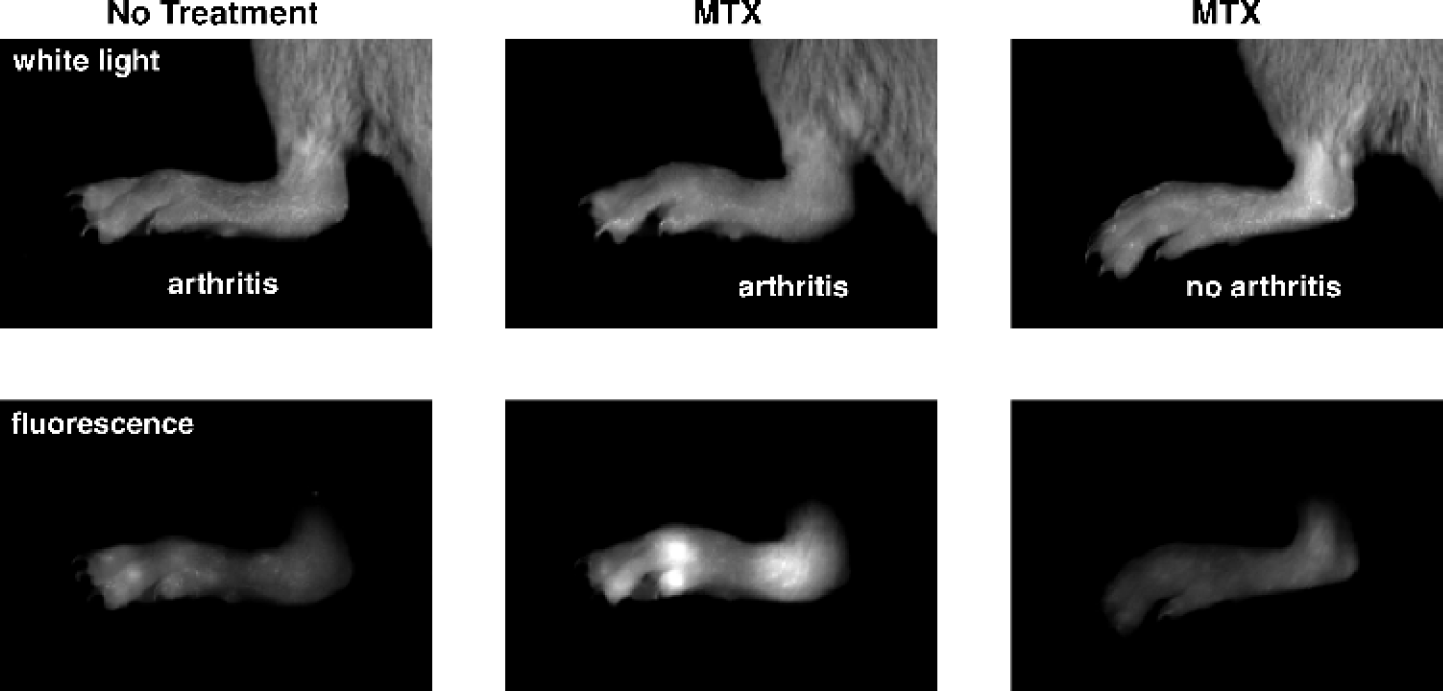
White light and NIRF images of paws 3 hr after injection of Cy5.5-annexin V. Arthritic paws of MTX-treated mice showed a higher fluorescence intensity than arthritic paws of untreated mice and nonarthritic paws of MTX-treated mice.
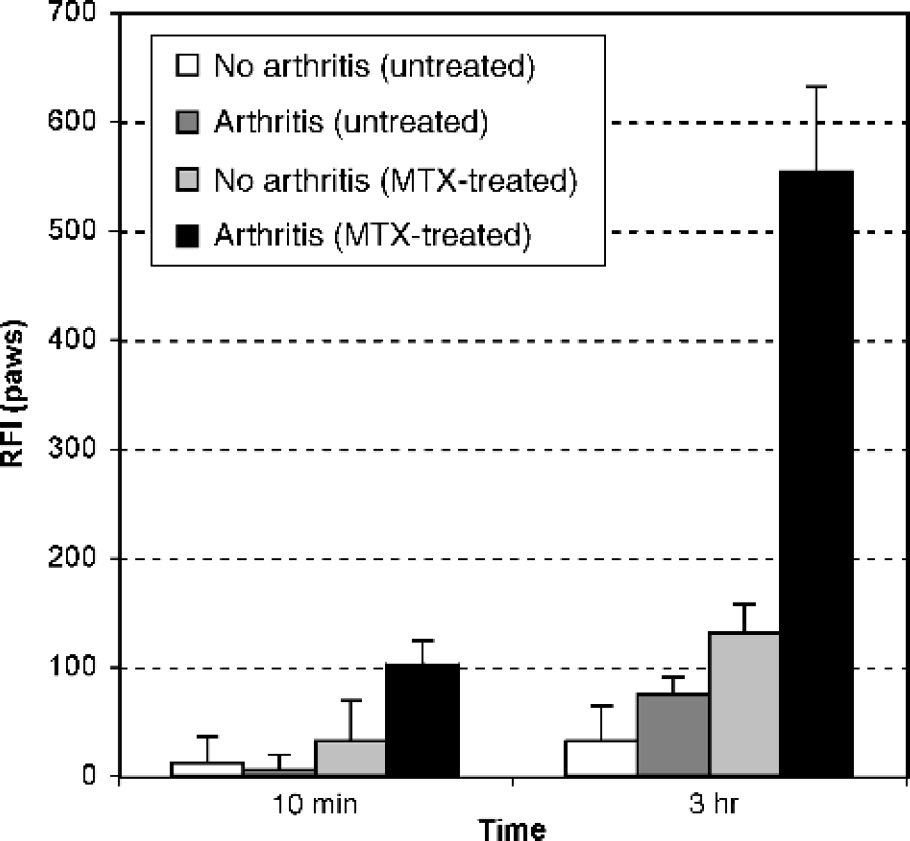
. Fluorescence intensities of arthritic and nonarthritic paws of untreated and MTX-treated mice 10 min and 3 hr after injection of Cy5.5-annexin V. Signal intensity is expressed as relative fluorescence intensity (RFI). Results are presented as mean ± 1 SEM. Three hours after injection, arthritic paws of MTX-treated mice showed a 7-fold higher fluorescence intensity than arthritic paws of untreated mice, and a 4-fold higher fluorescence intensity than nonarthritic paws of MTX treated mice (p < .001 each). For all groups, n = 6.
After imaging, animals were sacrificed and serial sections of joints were examined by dual-channel fluorescence microscopy (Cy5.5-annexin V and AFLc-HSA). Sections were then stained with HE and with the TUNEL method for apoptotic cells. Figure 3 shows serial paraffin sections of an arthritic paw of an MTX-treated mouse 3 hr after injection of Cy5.5-annexin V and AFLc-HSA. The HE-stained section (Figure 3A) shows hyperplastic synovia (top portion), bone (lower portion, center), and two joint spaces (lower portion on the left and the right). With the hyperplastic synovia of MTX-treated mice, numerous foci of Cy5.5 (Figure 3B) and TUNEL stain (Figure 3C) were observed, which were rarely seen with non-MTX-treated mice. The green fluorescence of AFLc-HSA was broadly distributed throughout the hyperplastic synovia of MTX-treated and untreated mice (Figure 3B).
We also compared the accumulation of Cy5.5-annexin V in the hyperplastic synovia of mice with and without MTX as shown in Figure 4. The hyperplastic synovia from MTX-treated mice had far more points of Cy5.5 fluorescence than those from nontreated animals.
Discussion
A four-group experimental design was used to determine the effect of MTX on the accumulation of Cy5.5-annexin V in the paws of mice with CIA paws (+ MTA/+ CIA, – MTX/ + CIA, + MTX/ – CIA, – MTX/ – CIA). MTX caused a 7-fold increase in Cy5.5-annexin accumulation in CIA paws (p < .001) and 4-fold increase in normal (– CIA) paws (<i>p < .001), whereas induction of arthritis without MTX treatment did not produce a significant increase (<i>p > .05). The MTX-induced accumulation of Cy5.5-annexin V was examined 48 hr after MTX administration and preceded changes in paw weight or ankylosis, common measurements of therapeutic response used with animal models.
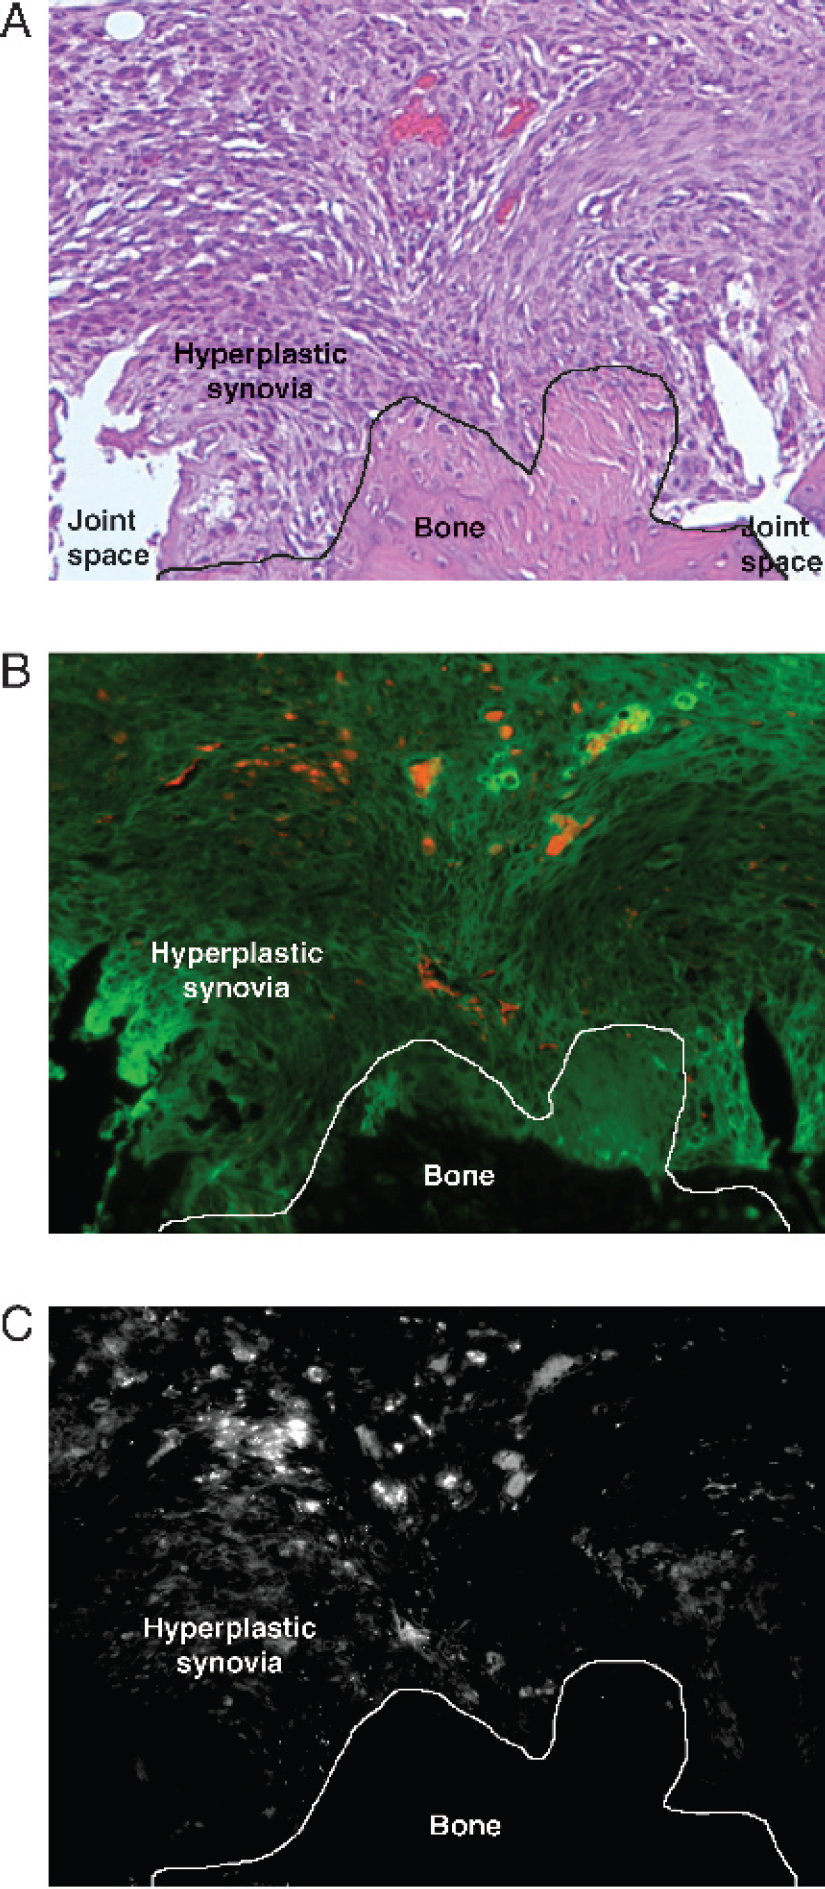
. Serial sections of an arthritic paw of an MTX-treated mouse 3 hr after injection of Cy5.5-annexin V and AFLc-HSA. (A) HE-stained section. (B) Fluorescence microscopy of Cy5.5-annexin V (red) and AFLc-HSA (green). (C) TUNEL stain. TUNEL staining and Cy5.5-annexin V fluorescence show numerous foci in the hyperplastic synovia, whereas AFLc-HSA fluorescence was broadly distributed.
The accumulation of Cy5.5-annexin V induced by MTX treatment in the CIA model differed markedly from results obtained when a cathepsin B-activated fluorescent probe was used [11]. With the cathepsin B probe, CIA increased the fluorescence of arthritic compared with normal paws and MTX treatment then decreased fluorescence. With Cy5.5-annexin V, CIA had no effect and MTX treatment increased fluorescence. Therefore, MTX treatment in the CIA model had opposite effects on the accumulation of the Cy5.5-annexin V- and cathepsin B-activated probes, suggesting each probe is measuring completely different aspects of the inflammatory process.
Annexin V is attractive as a carrier for an optical imaging agent because it is a human protein that has been cloned and because it has been used to image PS in cardiac rejection [15], radiation-induced apoptosis [16], primary head and neck tumors [17], and the response to chemotherapy [7]. The accumulation of radioactive annexin V in arthritic rodent joints has been imaged using radioactive annexin V [18]; however, there are significant advantages to using Cy5.5-annexin V and FRI. These include the avoidance of radioactivity, simple instrumentation, minimal attenuation of light due to its passage through tissues of only 1–2 mm, and the ability to visualize Cy5.5-annexin V by fluorescence microscopy.
A considerable body of evidence now suggests that the accumulation of annexin V seen with different imaging modalities is related to levels of PS, a molecular marker of apoptotic cells. First, annexin V binds tightly and specifically to anionic phospholipids such as PS [19,20], which is a reflection of its biological role as an anticoagulant [21,22]. Second, several studies have correlated the accumulation of radioactive or fluorescent annexin V with apoptosis induced by treatment with chemotherapeutic agents [8,14,23–28]. In addition, the induction of apoptosis by MTX is important for its mode of action in animal models [29] and has been observed with T cells in vitro [30]. For these reasons it seems likely that the MTX-induced Cy5.5-annexin V accumulation we have observed is associated with binding to apoptotic cells.
Our data indicate that FRI can be used to image the MTX-induced accumulation of Cy5.5-annexin V in a murine model of CIA, a result consistent with preclinical and clinical studies showing annexin V accumulates in the response to short courses of antiproliferative drug therapies in a variety of situations [7,14,23,24,26–28, 31,32]. However, the relationship between the Cy5.5-annexin V accumulation and the mechanism of MTX action, or between annexin V accumulation and the long-term treatment response (i.e., drug efficacy), will await additional longer term studies designed to address these questions.

Fluorescence microscopy of arthritic joints from an untreated and MTX-treated mouse 3 hr after injection of Cy5.5-annexin V and AFLc-HSA. The non-MTX-treated mouse shows little Cy5.5-annexin V accumulation in the hyperplastic synovium (red, see arrow), whereas MTX-treated synovia has numerous foci stained with Cy5.5-annexin V. Fluorescence from AFLc-HSA (green) was observed in the hyperplastic synovia of MTX-treated and untreated mice.
Footnotes
Acknowledgments
We thank Theseus Imaging for the supply of annexin V and Denise Torres for the excellent technical assistance in histology.