
Abstract
Mutations in the p53 gene are the most frequently observed genetic lesions in human cancers. Human cancers that contain a p53 mutation are more aggressive, more apt to metastasize, and more often fatal. p53 controls numerous downstream targets that can influence various outcomes such as apoptosis, growth arrest, and DNA repair. Based on previous observations using 1H magnetic resonance spectroscopy (MRS), we have identified choline phospholipid metabolite intensities typical of increased malignancy. Here we have used 1H MRS to characterize the choline phospholipid metabolite levels of p53+/+ and p53−/– cells, and demonstrated that loss of p53 function results in increased phosphocholine and total choline. These data suggest that the increased malignancy of cancer cells resulting from loss of p53 may be mediated, in part, through the choline phospholipid pathway.
Introduction
The tumor suppressor p53 controls numerous downstream targets that can impact upon apoptosis, transient growth arrest, and sustained growth arrest or senescence [1]. Inactivation of the p53 tumor suppressor gene occurs in nearly half of all human tumors, implying that loss of this gene represents a fundamentally important step in the pathogenesis of cancer [2].
We have previously shown that in human mammary epithelial cells (HMECs), both total choline (CHO) and phosphocholine (PC) levels increased significantly with progression to the malignant phenotype [3]. Another study using normal and malignant human prostatic cells also showed that tumor cells exhibited significantly higher PC as well as glycerophosphocholine (GPC) levels compared to normal cells [4]. Recent studies suggest that choline kinase, the enzyme responsible for the generation of PC, is elevated in human cancers [5], which may explain the increased PC levels observed with malignant transformation. We also demonstrated that a metastasis suppressor gene (nm-23) transfected breast cancer cells, and transgene tumors derived from these cells, showed significantly lower ratios of PC to GPC [6]. Treatment of HMECs with the nonsteroidal anti-inflammatory drug, indomethacin, mimicked the effects of nm-23 transfection, and altered the choline phospholipid metabolite intensities to those more representative of a less malignant phenotype, with lower PC/GPC [7].
In this study, we used 1H and 31P MRS to determine the effect of the p53 tumor suppressor gene on the choline phospholipid metabolite levels of human colon cancer cells with wild-type (wt) p53 (p53+/+) and without p53 (p53−/–). These MRS studies identified clear differences in the choline phospholipid metabolism of cancer cells with and without p53.
Materials and Methods
Cell Culture
Human colon carcinoma cell lines HCT116 with wt p53 (p53+/+) and a p53-deficient derivative (p53−/–), created by homozygous deletion via homologous recombination [8], were gifts from Dr B. Vogelstein. Cells were cultured in McCoy's 5A medium (Biofluids, Rockville, MD) supplemented with 10% fetal bovine serum (FBS), 2 mM l-glutamine (Mediatech, Herndon, VA), and 5 IU penicillin and 5 μg/mL streptomycin (Mediatech) at 37°C in a humidified 5% CO2 atmosphere.
Cell Extraction
HCT116 cells were grown in culture medium to 70–80% confluency, collected by trypsinization, and counted using a hemacytometer after staining with trypan blue. Cell growth rates were similar for both p53+/+ and p53−/– cell lines. Similar cell numbers were seeded at the start of the experiment (mean ± SE; p53+/+:5.8 × 107 ± 1.5 × 10⁶; p53−/–: 5.8 × 10⁷ ± 5.8 × 10⁶, n = 7). Almost identical cell numbers were counted prior to cell extract preparation (mean ± SE; p53+/+: 1.6 × 10⁸ ± 2.0 × 10⁷; p53−/–: 1.5 × 10⁸ ± 2.1 × 10⁷, n = 7).
To determine the choline phospholipid metabolite content, perchloric acid (PCA) cell extracts were obtained as previously described [3]. Briefly, cells were washed twice with cold 0.9% (w/v) NaCl solution and extracted in cold 8% (v/v) PCA by homogenization. The homogenates were centrifuged (15,000 rpm for 15 min) and supernatants were neutralized with 3 M K2CO3/1 M KOH buffer to pH 7.0. The samples were again clarified by centrifugation, treated with ~50 mg chelex (Sigma, St. Louis, MO) to remove divalent ions, and lyophilized.
MR Spectroscopy
PCA cell extracts were resuspended in 0.6 mL D2O for MRS analysis. Five microliters of 0.75% (w/w) 3-(trimethylsilyl)propionic 2,2,3,3-d4 acid sodium salt (TMSP) in D2O was used as an internal standard for 1H spectra and phenyl phosphonic acid (PPA) was used as external standard for 31P spectra. MR spectra of the extracts were acquired on an 11.7 T MSL Bruker MR spectrometer. Fully relaxed 1H spectra with water suppression were obtained using the following acquisition parameters: 30° flip angle, 6000 Hz sweep width (SW), 4.7 sec repetition time (TR), 32K block size (CB), and 128–512 scans. 31P spectra were recorded using proton decoupling and the following acquisition parameters: 45° flip angle, 10,000 Hz SW, 4.7 sec TR, 32K CB, and 10,800 scans. Data were analyzed using an in-house software program, CSX (P. Barker, The Johns Hopkins University). Peak areas were determined and normalized to total cell volume, and compared to the standard. Cell size was determined by trypsinizing the cells and measuring the diameter of 100 randomly selected cells using an optical microscope. Cell diameters were comparable for p53+/+ and p53−/– cells (mean ± SD: 16.00 ± 3.09 μm and 15.6 ± 4.08 μm, respectively). 31P spectra from three independent pairs of extracts and 1H spectra from seven independent pairs of extracts were analyzed.
To determine concentrations, peak integration (In) from 1H spectra for PC, GPC, and CHO and total CHO-containing metabolites (PC + GPC + CHO) were compared to that of the internal standard TMSP according to the equation:
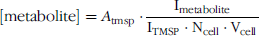
where [metabolite] is the molar concentration of the metabolite expressed as mM, Atmsp is the number of moles of TMSP in the sample, Ncell is the cell number, and Vcell is cell volume (L) calculated from the radius (r) of the cell according to the equation, Vcell = 4/3 × π × r3. Because the number of protons contributing to the signal of all the CHO metabolites at 3.20–3.24 ppm and to the TMSP peak at 0 ppm is the same, correction for differences in the number of protons was not required. For Equation 1 to be valid, it is necessary that spectra are fully relaxed, as in this study, or to correct for saturation.
To compare metabolites from 31P spectra, peak integration values (In) for PC, GPC, phosphoethanolamine (PE), and glycerophosphoethanolamine (GPE) were compared to that of the external standard PPA according to the equation:

where AU is the concentration in arbitrary units of the metabolite.
Statistical Analysis
Data were expressed as mean ± SE. The statistical significance of differences in metabolite levels between wt p53+/+ and p53−/– was determined using an unpaired t test (two-tailed). p values of ≤ .05 were considered to be significant.
Immunoblot Analysis
HCT116 cells were grown in culture medium to 70% confluency and were scraped into RIPA buffer [50 mM Tris, pH 7.4, 150 mM NaCl, 1 mM EDTA, 1% Triton 100, 1% sodium deoxycholate, 1 mM PMSF, 0.1% SDS and complete EDTA-free protease inhibitor cocktail (Roche, Indianapolis, IN)]. Cell lysates were incubated on ice for 15 min and spun down at 14,000 rpm. Protein samples from whole-cell extracts (50 μg) were resolved on 1-D 10% SDS-PAGE gels and transferred to Immun-Blot PVDF membrane (BioRad, Hercules, CA) using a semi-dry transfer unit (BioRad). After 2 hr incubation in blocking solution [2% BSA in 1× PBS with 0.05% Tween-20], overnight incubation with anti-p53 antibody (dilution 1: 1000) (Ab-6, Oncogene Research Products, Boston, MA) was performed. Anti-tubulin antibody (dilution 1:1000) (Molecular Probes, Eugene, OR) was used for equal loading assessment. Secondary antibody was horseradish peroxidase conjugated anti-mouse IgG (dilution 1:2000) (Vector Laboratories, Burlingame, CA). Reactions were revealed using SuperSignal West Pico Substrate (Pierce Biotech, Rockford, IL).
Results
Proton spectra of HCT116 p53−/– and p53+/+ colon cancer cells were typical of malignant cells, exhibiting high PC and low GPC (Figure 1). In comparison with wt p53+/+ cells, however, p53−/– cells exhibited significantly higher PC and total CHO (CHO + PC + GPC) (Figures 1 and 2). There were no significant differences in GPC levels or in PC/GPC levels in the proton spectra of the two cell lines. Consistent with data from 1H spectra, a significant increase of PC in the p53−/– cells compared to wt p53+/+ cells was detected in the 31P spectra (Figures 3 and 4).
Results from the immunoblot assay showed that the basal expression level of p53 protein in p53−/– cells was not detectable, whereas p53+/+ cells expressed detectable levels of p53 protein (Figure 5).
Discussion
Numerous studies of the breast, prostate, and brain have shown that an increase of total CHO is a hallmark of cancer [3,4,9,10]. In the studies here, HCT116 p53−/– colon cancer cells exhibited an increase of PC and total CHO compared with wt p53+/+ cells. Recently, Rosi et al. [11] demonstrated that growth conditions and cell confluency can significantly alter levels of PC and GPC. Because the p53+/+ and p53−/– cell lines were seeded at similar densities, exhibited similar growth rates, and were maintained under identical conditions, it is unlikely that differences in choline phospholipid levels detected here were due to growth conditions.

Representative 1H NMR spectra obtained from PCA extracts of identical numbers of (A) HCT116 p53+/+ and (B) HCT116 p53−/– cells (2.3 × 10⁸ cells). Spectra were acquired with a 30° flip angle, 6000 Hz SW, 4.7 sec TR, 32K block size, and 512 scans. Spectra are expanded to display signals from the PC, GPC, and CHO region only.

PC, GPC, and total CHO (PC + GPC + CHO) levels measured in HCT116 p53+/+ (white bars) and p53−/– cells (shaded bars) from 1H spectra. The data represent the mean ± SE of seven cell extracts for each cell line; ** significantly different compared to p53+/+ (p #x003C; .01).

Representative 31P NMR spectra obtained from PCA extracts of (A) 2.0 × 10⁸ HCT116 p53+/+ and (B) 1.4 × 10⁸ HCT116 p53−/– cells. Spectra were acquired with a 45° flip angle, 10,000 Hz SW, 4.8 sec TR, 4K block size, and 10,800 scans. Spectra are expanded to display signals from the inorganic phosphate (Pi), PC, GPC, PE and GPE only, and are displayed with comparable signal to noise.
Mutation of the p53 gene is one of the most common genetic alterations in human cancers [12,13]. Wt p53 protein is induced by stimuli such as radiation and DNA damaging agents [8]. The function of p53 is mainly regulated by p53 protein levels, localization of p53 protein and modulation of the activity of p53 [14]. We detected significant differences in the choline phospholipid metabolites of p53+/+ cells and p53−/– cells without any stimulation of p53 protein. It is possible that even larger alterations of PC and total CHO may occur with stimulation of the p53 protein. Such studies would determine if the effect of the p53 gene on CHO metabolism is mediated through, or independently of, the p53 protein.
A range of highly specific molecular changes induces similar effects in the CHO compounds. For instance, Ras activation and c-erb2 transfection resulted in the increase of PC levels, and nm-23 transfection resulted in increased GPC levels [6,9,15]. Some of the mechanisms underlying these effects may include changes in choline kinase activity, choline transport, and phospholipase activity. Previous studies have shown that various growth factors [16], chemical carcinogens [17], and oncogenes [18,19] enhanced the activity/expression of CHO kinase in mammalian cells. Thus, intracellular PC may play an important role as a regulator of cell growth [20]. The relations between these enzyme levels and the p53 pathway also require further investigation.
In conclusion, we have reported that loss of p53 function in colon cancer cells resulted in an increase of PC and total CHO. Several highly specific molecular alterations, which increase malignancy, result in a similar effect on the choline phospholipid metabolites; choline phospholipid metabolism appears to be one of the rare “common pathways” in cancer.

PE, PC, GPE, and GPC levels in HCT116 p53+/+ and p53−/– (white bars and shaded bars, respectively) from 31P spectra. Data represent the mean ± SE of three cell extracts for each cell line; * significantly different compared to p53+/+ (p #x003C; .05).

Basal expression levels of p53 protein in HCT116 wt p53+/+ and p53−/– cells obtained by immunoblot assay. Fifty micrograms of protein from each cell line was loaded on 10% reducing SDS-PAGE gel.
Footnotes
Acknowledgments
We thank Dr V. P. Chacko for assisting with the NMR spectroscopy experiments. This work was supported by NIH RO1 CA82337 (ZMB), P20 CA86346 (ZMB), P50 CA 103175 (ZMB) and RO1 097714 (KKS).