
Abstract
Magnetic resonance studies have previously shown that solid tumors and cancer cells in culture typically exhibit high phosphocholine and total choline. Treatment of cancer cells with the anti-inflammatory agent, indomethacin (INDO), reverted the phenotype of choline phospholipid metabolites in cancer cells towards a less malignant phenotype. Since endothelial cells form a key component of tumor vasculature, in this study, we used MR spectroscopy to characterize the phenotype of choline phospholipid metabolites in human umbilical vein endothelial cells (HUVECs). We determined the effect of growth factors, the anti-inflammatory agent INDO, and conditioned media obtained from a malignant cell line, on choline phospholipid metabolites. Growth factor depletion or treatment with INDO induced similar changes in the choline phospholipid metabolites of HUVECs. Treatment with conditioned medium obtained from MDA-MB-231 cancer cells induced changes similar to the presence of growth factor supplements. These results suggest that cancer cells secrete growth factors and/or other molecules that influence the choline phospholipid metabolism of HUVECs. The ability of INDO to alter choline phospholipid metabolism in the presence of growth factor supplements suggests that the inflammatory response pathways of HUVECs may play a role in cancer cell-HUVEC interaction and in the response of HUVECs to growth factors.
Keywords
Introduction
Endothelial cells are a key component of tumor vasculature, and play a major role in tumor vascularization and metastasis. Magnetic resonance spectroscopy (MRS) studies of endothelial cell metabolism, particularly in response to growth factors or conditioned medium (CM) derived from cancer cells, can provide further understanding of endothelial cell-cancer cell interaction.
Recent studies have demonstrated that nonsteroidal anti-inflammatory drugs (NSAIDs) exhibit anticancer activity [1]. NSAIDs target cyclooxygenase (COX), an enzyme that catalyzes the conversion of arachidonic acid to prostaglandin (PG) G2/H2. There are at least two isoforms of cyclooxygenase, COX-1 and COX-2. COX-1 is constitutively expressed in most tissues and appears to be responsible for the production of PGs that mediate normal physiological functions. In contrast, COX-2 is undetectable in most normal tissues but is induced by numerous cytokines, growth factors, hormones, mechanical and chemical stimuli [2]. Thus, increased PG synthesis is detected in inflamed and neoplastic tissues [3].
Studies by Tsujii et al. [4] have shown that endothelial cell tube formation that occurred when cells were co-cultured with COX-negative colon cancer cells (HCT-116) was reduced in the presence of aspirin or a COX-1 antisense oligonucleotide. These results suggest that endothelial COX-1 activity plays a significant role in endothelial tube formation and tumor angiogenesis. Other studies by Jones et al. [5] have shown that both COX-2 selective (NS-398) and nonselective (INDO) NSAIDs directly inhibited in vitro angiogenesis of endothelial cells.
We recently observed that human mammary epithelial cells (HMECs) exhibited alterations in choline phospholipid metabolism with progression to the malignant phenotype. The most striking changes detected in proton spectra of cell extracts were that malignant HMECs demonstrated higher amounts of phosphocholine (PC) relative to glycerophosphocholine (GPC), while nonmalignant HMECs contained lower amounts of PC relative to GPC [6]. Treatment of malignant HMECs with the NSAID INDO reverted the choline phospholipid metabolites towards a normal cell pattern, that is, an increase of GPC and a decrease of PC levels [7].
In this study, we used 1H MRS to examine the effect of conditioned media obtained from a malignant cell line on the choline phospholipid metabolism of human umbilical vein endothelial cells (HUVECs). Studies were also performed using growth factor supplemented or growth factor depleted medium. Since previous studies revealed a distinct effect of INDO on HMECs, the 1H MR spectra of HUVECs treated with INDO were determined. NMR spectroscopy has been previously used to study the energy metabolism and phospholipid metabolism of endothelial cells [8]–[11]. Here, for the first time, we have also used NMR spectroscopy to demonstrate that cancer cells secrete factors that directly affect the choline phospholipid metabolites of endothelial cells. These studies provide further understanding of the total choline signal detected in solid tumors in vivo, and demonstrate that the endothelial cell component can contribute to changes in the choline phospholipid signal in tumors during growth and following therapy.
Materials and Methods
Cell Culture
HUVECs were obtained from Clonetics (San Diego, CA) and maintained in endothelial cell growth medium-2 (EGM-2, Clonetics), which contained endothelial cell basal medium (EBM-2), human recombinant epidermal growth factor (hEGF), human recombinant fibroblast growth factor, basic (hFGF-B), ascorbic acid, vascular endothelial growth factor (VEGF), hydrocortisone, human recombinant insulin-like growth factor (R3IGF-1), heparin, gentamicin, amphotercin, and 2% fetal bovine serum (FBS). Cells were cultured at 37°C in 5% CO2 under a humidified atmosphere. HUVECs used in all the experiments were grown to less than seven passages.
The human breast cancer cell line, MDA-MB-231, kindly donated by Dr. R. J. Gillies, was cultured in Dulbecco's modified Eagle's medium (DMEM) supplemented with 10% FBS, 100 units/ml penicillin, and 100 μg/ml streptomycin (Life Technologies, Grand Island, NY).
CM Preparation
A total of 2 × 10⁶ MDA-MB-231 cells were seeded in culture medium in T175 flask. Fresh DMEM medium supplemented with 10% FBS, 100 units/ml penicillin and 100 μg/ml streptomycin, was added the following day and cells were cultured for a further 48 hr. CM was collected from these cells, and cell debris was removed by centrifugation. The pH of CM was adjusted to 7.3–7.5 if required, following which the medium was filtered through a 0.22-μm filter.
Cell Extraction and NMR Spectroscopy
HUVECs were grown up to 70–80% confluency in EGM-2. Once confluent, cells were maintained in the following media for 18 hr: (i) 50 μM INDO in EGM-2, (ii) EBM-2 with 2% FBS but without other supplements (No supplement medium), (iii) CM, and (iv) 20 ng/ml VEGF in DMEM with 10% FBS, 100 units/ml penicillin, and 100 μg/ml streptomycin. Untreated cells used as controls were either cultured in fresh EGM-2 medium, or DMEM with 10% FBS and 100 units/ml penicillin and 100 μg/ml streptomycin, over the same time period. Adherent cells were collected by trypsinization, and counted using a hemacytometer after staining with trypan blue.
To determine the choline phospholipid metabolite content, perchloric acid (PCA) cell extracts were obtained after collecting approximately 1–3 × 10⁷ cells by trypsinization as previously described [6]. Briefly, cells were washed twice with cold 0.9% NaCl solution and extracted in cold 8% (v/v) PCA by homogenization. The homogenates were centrifuged (15,000 rpm for 15 min) and supernatants were neutralized with 3 M K2CO3/1 M KOH buffer to pH 7.0. The samples were again clarified by centrifugation, treated with ˜50 mg chelex (Sigma, St. Louis, MO) to remove divalent ions, lyophilized, and resuspended in 0.6 ml D2O for NMR analysis. Five microliters of 0.75% (w/w) 3-(trimethylsilyl) propionic 2,2,3,3-d4 acid sodium salt (TMSP) in D2O was added as an internal standard. Fully relaxed water suppressed 1H-NMR spectra of the extracts were obtained on a Bruker 500 MHz NMR spectrometer with a 5-mm probe using the following acquisition parameters: 30° flip angle, 6000 Hz sweep width, 4.7 sec repetition time, 32 K block size, and 128–512 scans. Data were analyzed using in-house software, CSX (P. Barker, The Johns Hopkins University). PC, GPC, and total choline containing metabolite (PC + GPC + CHO) levels were determined and normalized to total cell volume. Cell size was determined by trypsinizing the cells and measuring the diameter of 100 randomly selected cells using an optical microscope. Between three and four independent extracts were analyzed per sample.
To determine concentrations, peak amplitudes (I) for PC, GPC, and CHO and total choline-containing metabolites (PC + GPC + CHO) were compared to that of the internal standard TMSP according to the equation:
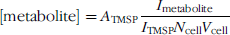
where [metabolite] is the molar concentration of the metabolite expressed as mM, A TMSP is> the number of moles of TMSP in the sample, Ncell is the cell number, and Vcell is cell volume (L) calculated from the radius (r) of the cell according to the equation, Vcell = 4/3 × π × r3. Since the number of protons contributing to the signal of all the choline metabolites at 3.21–3.23 ppm and to the TMSP peak at 0 ppm was the same, correction for differences in the number of protons was not required. For Equation 1 to be valid, it is necessary that spectra are fully relaxed, as in this study, or to correct for saturation. The resulting metabolite concentrations were averaged for three or four independent cell culture experiments.
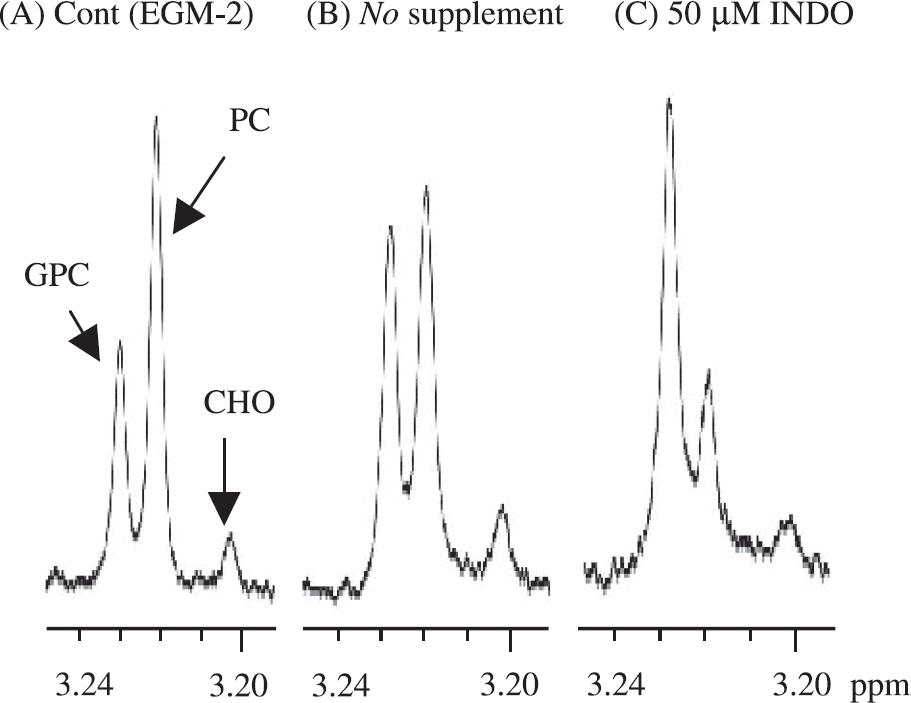
Representative 1H-NMR spectra from the choline phospholipid metabolite region of PCA extracts of HUVEC cultured for 18 hr with (A) control (EGM-2), (B) No supplement, and (C) 50 μm INDO. Spectra were acquired with 30° flip angle, 6000 Hz sweep width, 4.7 sec repetition time, 32 K block size, and 128–512 scans. Spectra are expanded to display signals from PC, GPC, and CHO regions only.
Apoptosis Assay
HUVECs were grown on four chambered slides (Nalge Nunc International, Rochester, NY) in growth medium (EGM-2). At 80% confluency, cells were cultured with EGM-2, No supplement medium, or 20 μM C6-Ceramide as a positive control in EGM-2 for 18 hr. An apoptosis assay was performed using the ApoAlert DNA fragmentation assay kit (Clontech Laboratories, Palo Alto, CA) following the manufacturer's instructions. The assay is based on terminal deoxynucleotidyl transferase (TdT)-mediated dUTP nick-end-labeling (TUNEL [12]). Cells containing DNA strand breaks were stained with fluorescein-dUTP and detected by fluorescence microscopy (Nikon, Tokyo, Japan). Cells that detached during treatment were washed with phosphate-buffered saline (PBS) [137 mM NaCl, 2.68 mM KCl, 8.1 mM Na2HPO4·7H2O] and only adherent cells were used to determine the apoptotic index. The apoptotic index was evaluated by the percentage of apoptotic cells [(apoptotic cells/total cell number) × 100] in sample fields using more than 200 cells, and from the average of three independent experiments.
Western Blot Analysis of COX-1 and COX-2
HUVECs were plated onto 100-mm dishes and grown until subconfluent. Cells were fed with fresh EGM-2 or EBM-2 supplemented with 2% FBS and cultured for 18 hr. Cells were rinsed with cold PBS and then scraped with lysis buffer containing 100 mM Tris pH 8.0, 150 mM NaCl, 1 mM EDTA, 1% Tween-20 and protease inhibitors (Boehringer Mannheim, Indianapolis, IN). Cell lysates were homogenized for 20 sec on ice. Lysates were centrifuged at 14,000 rpm to sediment particulate material. Protein concentrations were estimated using the Bio-Rad DC assay (Bio-Rad, Melville, NY), which is based on the method of Lowry et al. [13]. Equal amounts of proteins (20–40 μg/lane) were loaded and resolved on a 10% reducing SDS-PAGE as described by Laemmli [14]. Proteins were then transferred to an Immobilon-P membranes (Millipore, Bedford, MA) according to Towbin et al. [15]. After blocking in 5% milk, the membrane was separately probed with antibodies to COX-1 (rabbit polyclonal) and COX-2 (rabbit polyclonal, PG-27b). These antibodies are specific for COX-1 or COX-2 and do not cross react with each other (Oxford Biomedical Research, Oxford, MI). The membrane was then incubated with a horseradish peroxidase conjugated anti-rabbit antibody (from donkey) and the blots were developed using an enhanced chemiluminescence (ECL) system (Amersham Pharmacia Biotech, Piscataway, NJ) and exposed to Kodak Biomax film. Ovine COX-1 and COX-2 were used as standards (Oxford Biomedical Research). The bands were quantified using NIH-Image 1.61 by comparison with a calibration curve of COX-1 and COX-2 standards loaded on the same gel as samples.
Statistical Analysis
Data were expressed as mean ± SE. The statistical significance of differences in metabolite levels between control and treatment group was determined using the unpaired t test (two-tailed). A p value of ≤ .05 was considered to be significant.
Results
Effect of INDO and No Supplement Medium on the Phospholipid Metabolite Profiles of HUVECs
Representative 1H-NMR spectra from the choline phospholipid metabolite region of cell extracts obtained from cells cultured in EGM-2, or treated with No supplement medium or INDO, are shown in Figure 1A–C. HUVECs cultured in EGM-2 showed higher amounts of PC relative to GPC (Figure 1A). In contrast, when HUVECs were cultured in No supplement medium, GPC levels were almost comparable to PC levels (Figure 1B). Following treatment with 50 μM INDO, the levels of GPC were higher than PC levels (Figure 1C). Phospholipid metabolite data from NMR spectra averaged over several independent extract measurements are summarized in Table 1 and Figure 3. A significant decrease of PC/GPC in both No supplement medium, and following treatment with 50 μM INDO, was observed, with the effect more pronounced in cells treated with INDO (Figure 3). GPC levels increased significantly in cells cultured in No supplement medium or treated with INDO (Table 1). PC levels only decreased significantly in cells treated with INDO (Table 1). Total choline did not change significantly for cells cultured in EGM-2, treated with No supplement medium or INDO.
Concentration (mM) of PC, GPC, and Total Choline in PCA Extracts of HUVECs

Cell extracts were obtained from HUVECs cultured under the different conditions described in the text, n represents the number of independent extracts used to determine the values.
Values are mean ± SEM.
Significantly different compared to EGM-2 (p < .01).
Significantly different compared to EGM-2 (p < .05).
Significantly different compared to DMEM (p < .05).
Effect of CM and VEGF on the Phospholipid Metabolite Profiles of HUVECs
Representative 1H-NMR spectra from the choline phospholipid metabolite region of control (DMEM with 10% FBS), CM, and VEGF-treated cell extracts are displayed in Figure 2A–C. Choline phospholipid metabolite data from NMR spectra averaged over several independent extract measurements for cells cultured under these conditions are also summarized in Table 1 and Figure 3-Levels of PC and GPC were comparable when HUVECs were cultured in DMEM with 10% FBS (Figures 2A and 3). Culturing cells in CM significantly decreased the GPC level, resulting in an increase of the PC/GPC ratio (Figures 2B and 3). When 20 ng/ml VEGF was added to DMEM supplemented with 10% FBS, the choline phospholipid metabolite profile did not change significantly (Figures 2C and 3). Our rationale for using a concentration of 20 ng/ml VEGF was that MDA-MB-231 cells, at the cell number used to collect CM, typically secrete about 5 ng/ml of VEGF into the medium [16]. HUVECs cultured in 20 ng/ml VEGF supplemented DMEM displayed a higher cell density (1.18 ± 0.20 × 10⁷ cells for DMEM, 1.86 ± 0.13 × 10⁷ cells for VEGF, n = 3). Once again, total choline levels remained unaltered for cells cultured in DMEM with 10% FBS, or CM, or 20 ng/ml VEGF in DMEM with 10% FBS (Table 1).

Representative 1H-NMR spectra from the choline phospholipid metabolite region of PCA extracts of HUVEC cultured for 18 hr with (A) control (DMEM), (B) CM, (C) 20 ng/ml VEGF. Spectra were acquired with 30° flip angle, 6000 Hz sweep width, 4.7 sec repetition time, 32 K block size, and 128–512 scans. Spectra are expanded to display signals from PC, GPC, and CHO regions only.

PC/GPC ratios (mean ± SEM) in HUVECs cultured with various media. Significant differences compared to EGM-2 are marked by** (p < .01), and compared to DMEM are marked by++ (p < .01).
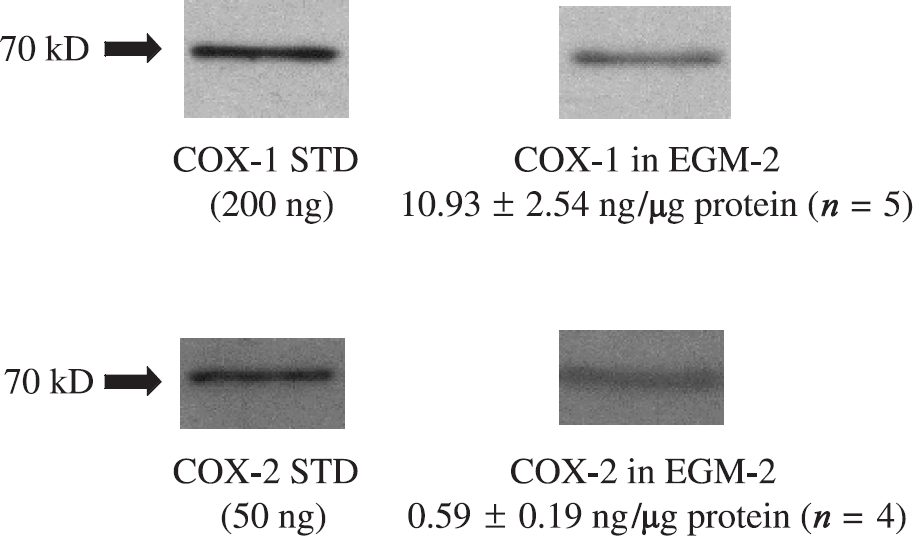
Basal expression levels of COX-1 and COX-2 in HUVECs. STD: standard protein of COX-1 (200 ng) and COX-2 (50 ng). Twenty micrograms protein for COX-1 and 40 μg protein for COX-2 from HUVEC cell lysates cultured with EGM-2 were loaded on 10% reducing SDS-PAGE.
Apoptosis Assay
To understand the role of apoptosis in the changes observed in the 1H-NMR spectra, the assay was performed using adherent cells, since the extract studies were performed using adherent cells. Cells cultured in No supplement medium did not exhibit a significant increase of apoptotic cells compared to the cells cultured in EGM-2 medium (mean ± SE are 3.56 ± 1.30% for EGM-2, 5.11 ± 2.34% for No supplement medium). In contrast, treatment of cells with 20 μM (C6-Ceramide in EGM-2 medium for 18 hr, which was used as a positive control for detecting apoptosis in adherent cells, showed a significant increase of apoptosis (56.48 ± 0.89%, p < .001).
COX-1 and COX-2 Expression of HUVECs
Western blots of COX-1 and COX-2 protein expression are shown in Figure 4. Basal levels of COX-1 expression (10.93 ± 2.54 ng/μg protein, n = 5) were significantly higher than COX-2 basal levels (0.59 ± 0.19 ng/μg protein, n = 4) in the HUVECs. Neither COX-1 nor COX-2 levels were altered significantly, following treatment with 50 μM INDO, No supplement, CM, and VEGF (data not shown).
Discussion
COX inhibition with INDO, or culturing HUVECs in medium without growth supplements, resulted in a significant reduction of the PC/GPC ratio and a significant increase of GPC, compared to cells cultured in EGM-2 control medium. The effect was more pronounced for INDO treatment where GPC increased and PC decreased. These results are consistent with our previous observation that INDO altered PC/GPC levels to higher GPC and lower PC levels in malignant and nonmalignant HMECs [7]. Previous studies have shown that one of the key features of apoptosis is an alteration in choline phospholipid metabolism [17,18]. However, the changes in choline phospholipid metabolites in our study were not accompanied by increased apoptosis, and treatment with INDO did not alter cell number or cell viability compared to EGM-2 control cells.
Since DMEM was used to derive CM, a comparison of the effects of CM on HUVECs required that the control experiments were performed with DMEM. However, cells cultured in DMEM supplemented with 10% FBS exhibited significantly different levels of PC, GPC, and total choline compared to cells cultured in EGM-2 medium. The role of various cytokines and growth factors in causing these alterations was difficult to ascertain, because the concentration of components of EGM-2 was not disclosed by the manufacturer.
In contrast to the effects of No supplement and INDO, culturing HUVECs in CM obtained from breast cancer cells significantly decreased GPC levels and increased the PC/GPC ratio compared to HUVECs cultured in supplemented DMEM medium. These data suggest that breast cancer cells secreted paracrine factors, which significantly altered choline phospholipid metabolite levels. These observations also raise the possibility that the altered choline phospholipids detected in cancer cells may also be a result of autocrine factors secreted by the cancer cells.
Previous studies with HMECs have shown that progression from a normal to malignant, invasive/metastatic phenotype is associated with increased PC relative to GPC and increased total choline [6]. The choline phospholipid metabolite pattern in terms of the PC/GPC of HUVECs cultured in EGM-2 and CM matched the choline phospholipid metabolite pattern of malignant HMECs. In contrast, HUVECs cultured in No supplement, or DMEM, or treated with INDO, displayed a choline phospholipid metabolite pattern typical of a nonmalignant phenotype. These data suggest that cancer cells may increase the “aggressiveness” of HUVECs, which may be reduced by treatment with anti-inflammatory agents. HUVECs maintained in CM exhibited total choline levels comparable to cancer cells. Since at least 10–20% of a tumor comprises of endothelial cells, these data suggest that, in vivo, signal from endothelial cells will contribute to the choline phospholipid signal detected in tumors during growth as well as after therapy.
Treatment of HUVECs with 20 ng/ml VEGF in DMEM with 10% FBS for 18 hr did not result in significant changes in the choline phospholipid metabolite levels, although a significant growth advantage in the VEGF-treated cells was detected. It has been postulated that the high choline phospholipid metabolite levels in rapidly proliferating tissues such as cancer cells are due to intensified membrane/fatty acid requirements [19]. However, our data showed no significant change in choline phospholipid metabolite levels in HUVECs treated with VEGF, despite increased proliferation. These results are consistent with previous studies, demonstrating a lack of correlation between doubling time and choline phospholipid metabolite levels in HMECs and human prostate cells [6,20].
A recent study has shown that untreated HUVECs expressed only COX-1, and the predominant COX-1-derived product was thromboxane A2 (TXA2) [21]. These results are consistent with the data obtained in this study where we detected high levels of COX-1 but low levels of COX-2 in the HUVECs.
Possible mechanisms underlying the alteration in choline phospholipid metabolism of HUVECs under the various conditions used in this study include changes in choline kinase activity, choline transport, and phos-pholipase activity. Previous studies have shown that various growth factors [22], chemical carcinogens [23], and oncogenes [24,25] enhanced the activity/expression of choline kinase in mammalian cells. Thus, intracellular PC may have an important role as a regulator of cell growth [26]. The relations between these activities and the COX pathway also require investigation.
In conclusion, we have reported that growth factor depletion or treatment with INDO induced similar changes in the choline phospholipid metabolite profile of HUVECs, while treatment with CM obtained from MDA-MB-231 breast cancer cells induced changes similar to the presence of growth factor supplements. These results suggested that tumor cells secrete growth factors and/or other molecules that influence the choline phospholipid metabolism of HUVECs. Since the addition of 20 ng/ml VEGF to the medium did not result in a significant effect on the phospholipid metabolite profile, paracrine effectors, other than VEGF, secreted by cancer cells should be investigated. The ability of the anti-inflammatory agent INDO to alter the phospholipid profile in the presence of growth factor supplements suggests that the inflammatory response pathways of HUVECs, especially the COX pathway, may play a role in cancer cell-HUVEC interaction and in the response of HUVECs to growth factors.
Footnotes
Acknowledgments
This work was supported by NIH Grant IRO1 CA82337. We thank the NCI BRB Preclinical Repository for supplying VEGF.