
Abstract
Reporter genes can monitor the status and activity of recombinant genomes in a diverse array of organisms, from bacteria and yeast to plants and animals. We have combined luciferase reporter genes with a conditional gene expression system based on regulatory elements from the lac Operon of Escherichia coli to visualize the dynamics of gene expression in realtime in the living mouse. Using this technology, we have determined the rate of gene induction and repression, the level of target gene activity in response to different doses of inducer, and the schedule of induction during early embryogenesis of both the endogenous and the experimentally manipulated programs of mammalian gene expression associated with the HD/Hdh locus. The combination of in vivo imaging and lac regulation is a powerful tool for generating conditional transgenic mice that can be screened rapidly for optimal regulation and expression patterns, and for monitoring the induction and repression of regulated genes noninvasively in the living animal.
Introduction
Conditional systems that confer the ability to control when and for how long genes are expressed in a living organism are valuable tools for elucidating gene function. Conditional gene expression makes it possible to study even those genes with essential functions and genes whose expression has deleterious consequences. The lac operator-repressor system for conditional gene expression is based on the lac operon of Escherichia coli, which was first elucidated by Jacob and Monod in 1961 [1]. This system has two genetic components: lacI, which codes for the lac repressor protein, and lacO, the operator sequence by which the lac repressor is bound to DNA. When bound to the operator, repressor inhibits gene expression by physically blocking transcription initiation. Inhibition is relieved by the addition of lactose or lactose analogs, such as isopropyl-β-
Early studies demonstrated that the lac operator-repressor system could be used to control the expression of episomally derived [2] or integrated [3] sequences in mammalian cells in culture or in grafts of stably transfected cells in mice [4,5]. Using a lac-modified tyrosinase transgene together with a mammalianized version of lacI, we demonstrated that the lac system could be transferred into the mouse to regulate a program of gene expression and control phenotype at the whole animal level [6]. However, a number of crucial questions pertaining to the use of the lac regulatory system in vivo remained unanswered at the end of that study. The first of these concerned the response time in the animal both of induction of expression of a repressed gene and of re-repression of that gene once it had been induced. Pigmentation had been used as an end point in our previous study to demonstrate that tyrosinase expression had been induced or repressed. However, because the RNA or protein products of the tyrosinase transgene differ by only one base or one amino acid, respectively, from those produced by the mutant endogenous tyrosinase gene, molecular assays to determine how fast the regulated transgene products appeared (or disappeared) could not be performed. Furthermore, the extremely long half-life of the melanin pigment and the weak activity of the tyrosinase promoter after about 2 weeks of age in mice contribute to the relative stability of pigmentation in adult animals. This phenotypic stability limited the range of ages during which we could demonstrate reversibility of the regulated tyrosinase transgene by visible changes in the color of coat or eyes. It was also not possible to quantitate the relative levels of induction or repression of gene expression with an assay that only measured the end point of promoter activity (pigmentation). For these reasons, we have generated a line of transgenic mice in which a reporter gene (luciferase) is driven by a lac-modified promoter derived from the human Huntington's disease (HD) locus [7]. Using luciferase imaging in living animals, we address questions regarding the temporal response lac-modified promoters to chronic and acute IPTG administration; the ability of IPTG to regulate gene expression across the blood-brain barrier, during early embryonic development, and after a prolonged period of gene silencing; the optimal dose of IPTG to relieve lac repression in vivo; and, the effects of inserting lac operators on the ability of a promoter to follow its endogenous program of gene expression. The resolution of these issues is crucial for future use of the lac regulatory system in animals. In addition, we show that luciferase is a very sensitive reporter gene that can be used to monitor lac regulation noninvasively and in living animals when placed downstream of a lac-modified promoter, and to visualize expression of genes as their promoters become active in both the brain and the periphery.
Materials and Methods
Animals
All animal experiments were conducted in accordance with the ethical guidelines described in Guide for the Care and Use of Laboratory Animals by the National Research Council. Protocol 2552 was reviewed and approved by the Animal Care and Use Committee of the University of Virginia.
Construction of a Regulatable lac-modified HD-Luciferase Construct
A human HD promoter fragment was obtained by digesting the qp25 construct (huntingtin promoter and exon 1 with a nonpathogenic polyglutamine stretch fused to EGFP, a gift of David Housman through the HDF CHDI Reagent Resource Bank) with NcoI to yield a ˜800 bp fragment. The 800-bp promoter fragment was cloned into the NcoI site of the pGL3-Basic vector (Promega, Madison, WI), yielding pHDluc, and orientation was verified by analytical restriction enzyme digestion. Two synthetic lac operators (ATTGTGAGCGCTCACAAT) were inserted into the promoter region of pHDluc using splice overlap extension by PCR [8] and a unique BlpI site in the HD promoter, yielding pHDOSluc.
Regulation in vitro of the pHDOSluc construct was tested by transient transfection into mouse R cells, which stably express lacI. Cells were also transfected with the pRL-TK vector (Promega) to correct for transfection efficiency. Twenty-four hours following transfection, cells were treated with medium containing 5 mM IPTG for 24 hr, after which cells were lysed and assayed for luciferase activity using the Dual-Luciferase Reporter Assay System protocol (Promega). The pHDluc construct (HD promoter without lac operators) was used as a control.
Transplantation and Imaging of Transfected Cells
Luciferase reporter genes driven by the modified and unmodified HD promoter (HDlacO and HD, respectively) were transiently transfected into R cells and harvested 48 hr later. A cell suspension of 100,000 cells/μL was prepared in serum-free cell culture medium (DMEM) and 10 μL (106) cells transfected with either the HDlacO or HD reporter gene were injected directly into the brain parenchyma of mice. To do this, two adult female mice were anesthetized with a mixture of chloral hydrate (35 mg/mL stock) and xylazine (1 mg/mL stock) at a concentration of 10 and 5 μL per gram body weight, respectively. Following sedation, their heads were immobilized using a Kopf 900 small animal stereotaxic frame and a small hole was drilled in the skull at coordinates 2 mm posterior to the bregma and 2 mm right of the sagittal suture until the dura mater was reached. A Hamilton syringe with a 2-in. 22-gauge needle was lowered into the hole, penetratingthe brain to a depth of 3 mm, corresponding to the posterior thalamic nuclear group area of the brain. The cells were injected slowly by hand, the needle removed, and the injection site filled with bone wax. The animals were sutured closed and allowed to recover for approximately 36 hr before proceeding. To image luciferase activity in vivo, we used the IVIS system from Xenogen (Alameda, CA), which consists of a scientific grade, cooled, back-thinned, back-illuminated large-format CCD camera (Spectral Instruments) with an auto focusing lens system mounted on a darkbox with an internal heated, motor controlled stage. The camera is capable of detecting light (signal-to-noise ratio » 1) to a depth of approximately 2 cm beneath the surface (skin and skull) of the animal. Animals to be imaged were anesthetized via inhalation of 4% isofluorane, positioned on the heated stage, and injected intraperitoneally with 0.1 cc of 28.6 mg/mL luciferin.
At time zero, both animals were injected with a single dose of IPTG (0.1 cc, 1 M IPTG per 10 g body weight) followed by luciferin. Image data were collected every 5 min for 30–60 min; peak luciferase activity was detected between 10 and 35 min after injection of the substrate. We analyzed luciferase activity at 40 min, 1 hr 40 min, 4 hr 10 min, 7 hr 25 min, 25 hr, and 6 days after the single injection of IPTG to induce reporter gene activity.
Generation of Transgenic Mice
A line of mice carrying the HDlacO-luciferase transgene was generated by microinjection into the FVB/N line of mice (Harlan, Indianapolis, IN) using standard microinjection procedures. One founder was generated, and it exhibited the ubiquitous expression pattern typical of the HD gene [9]. This founder was crossed to mice that are transgenic for the repressor lacI (described in Ref. [6]), generating a line of mice that are double-transgenic for HDlacO-luciferase and the lac repressor.
Determination of Optimal IPTG Dose In Vivo
Luciferase expression was de-repressed in regulatable HDlacO-luciferase animals by replacing the animal's drinking water with 1, 5, 10, or 20 mM IPTG for 11 days. Due to the instability of IPTG, water was dispensed from light-insensitive bottles, and was changed every 3 to 4 days. Images were acquired daily after intraperitoneal injection of 123 mg/kg luciferin, as described above, except images were captured every minute over a 30 min time period. The magnitude of luciferase activity in a region-of-interest was determined by image analysis with Living Image software (Xenogen, Alameda, CA). An unregulated animal transgenic for only HDlacO-luciferase was used as a positive control, while a nontransgenic FVB/N animal was used as a negative control. After imaging was completed on Day 11, IPTG administration was stopped and images captured and analyzed as above for the following 7 days.
Temporal Response to IPTG
Luciferase expression was de-repressed in a regulatable HDlacO-luciferase animal by replacing the animal's drinking water with 10 mM IPTG for 11 days. Images were acquired once a day for 11 days, as described above, and then IPTG administration was stopped. Images continued to be captured and analyzed an additional 7 days. To determine temporal induction of luciferase protein, regulatable HDlacO-luciferase mice were administered 10 mM IPTG in their drinking water for 0 hr, 8 hr, 16 hr, 1 day, 2 days, 5 days, or 9 days, after which the mice were killed by cervical dislocation, and their brains were frozen in liquid nitrogen. One nontransgenic mouse (used as a negative control) and one unregulated mouse transgenic for only HDlacO-luciferase (used as a positive control) were also sacrificed. Protein was extracted from the frozen tissues in RIPA buffer supplemented with protease inhibitors, and the protein concentration of each sample was determined by a detergent-compatible protein assay (Bio-Rad, Hercules, CA). Western blots were generated using standard procedures. Monoclonal anti-luciferase antibody (Sigma-Aldrich, St. Louis, MO) was used at a 1:1000 dilution and monoclonal anti-GAPDH antibody (Ambion, Austin, TX) was used at a 1:3000 dilution. Antigen-antibody complexes were further reacted with HRP-conjugated goat anti-mouse secondary antibody (Jackson Immuno Research Laboratories, West Grove, PA) and detected by chemiluminescence (SuperSignal pico reagent, Pierce, Rockford, IL).
Analysis of Luciferase and lac Repressor Proteins in Brain and Peripheral Tissues
To determine the ratio of luciferase protein and lac repressor protein in various tissues following 24 hr of induction, a regulatable HDlacO-luciferase mouse was administered 10 mM IPTG for 24 hr, after which the mouse was killed by cervical dislocation, and its tissues frozen in liquid nitrogen. Protein was extracted from the frozen tissues in RIPA buffer supplemented with protease inhibitors, and the protein concentration of each sample was determined by a detergent-compatible protein assay (Bio-Rad). Western blots were generated using standard procedures. Monoclonal anti-luciferase antibody (Sigma-Aldrich) was used at a 1:1000 dilution against luciferase protein, and 6 μg of biotinylated lac repressor antibody 9A5 (Upstate Biotechnology, Charlottesville, VA) was used to detect the lac repressor protein. Antigen-antibody complexes were further reacted with HRP-conjugated goat anti-mouse secondary antibody (Jackson Immuno Research Laboratories) or with VectastainABC Kit (Vector Laboratories, Burlin-game, CA) and detected by chemiluminescence (SuperSignal pico reagent, Pierce). The ratio of luciferase protein to lac repressor protein was determined using ImageQuant software (Molecular Dynamics, Amersham Biosciences, Piscataway, NJ).
Induction by IPTG during Early Embryogenesis
A nontransgenic female and two females homozygous for the lac repressor were mated to males homozygous for HDlacO-luciferase. Pregnancy was determined by vaginal plug, and E0.5 was marked by the day that the plug was observed. Pregnant females were imaged as described above, except 2 mg of luciferin was injected intraperitoneally, and six images were acquired for 5 min each over the 30-min session. The induced female was administered 10 mM IPTG in her drinking water after images were captured on E9.5.
Induction by IPTG across the Blood-Brain Barrier
Regulatable HDlacO-luciferase mice were administered 10 mM IPTG in their drinking water for 0 hr, 8 hr, 16 hr, 1 day, 2 days, 5 days, or 9 days, after which the mice were killed by cervical dislocation, and their brains frozen in liquid nitrogen. One nontransgenic mouse (used as a negative control), and one unregulated mouse transgenic for only HDlacO-luciferase (used as a positive control) were also sacrificed. Protein was extracted from the frozen tissues in RIPA buffer supplemented with protease inhibitors, and the protein concentration of each sample was determined by a detergent-compatible protein assay (Bio-Rad). Western blots were generated using standard procedures. Monoclonal anti-luciferase antibody (Sigma-Aldrich) was used at a 1:1000 dilution and monoclonal anti-GAPDH antibody (Ambion) was used at a 1:3000 dilution. Antigen-antibody complexes were further reacted with HRP-conjugated goat anti-mouse secondary antibody (Jackson Immuno Research Laboratories) and detected by chemiluminescence (SuperSignal pico reagent, Pierce).
Analysis of lac-modified Promoter Expression
Nontransgenic females impregnated by HDlacO-luciferase homozygous males were sacrificed at E6.5, E7.5, or E8.5, and their embryos were removed. Embryos were homogenized and protein extracted in 1% NP40 lysis buffer supplemented with protease inhibitors. Luciferase levels were determined using the Luciferase Assay System (Promega) and a TD-20/20 Luminometer (Turner Designs, Sunnyvale, CA).
Results
Generation of a Regulatable HD Promoter Using the lac Operator-Repressor System
To construct a conditional version of the HD promoter using the lac operator-repressor system, we introduced lac operators so that they flank the transcription start site (Figure 1B), mimicking the spacing found in the lac operon of E. coli (Figure 1A). Because huntingtin, the product of the HD gene, is expressed ubiquitously and throughout life, using a regulatable HDlacO promoter to drive reporter gene expression allowed us to study regulatability in most tissues and at any period during the life time of the animal, beginning early in embryogenesis. We cloned the modified HDlacO promoter upstream of a sequence encoding the enzyme luciferase (Figure 1C) and assayed luciferase activity in vitro. When transfected into cells that constitutively express lacI, reporter gene activity was repressed to 12.7% of baseline and induced to 103% of baseline upon addition of IPTG to the culture medium (Figure 1D). Baseline was defined as the luciferase activity from a nonregulatable, unmodified HD-luciferase construct under the same assay conditions. As this level of control is what we obtain with the best of our lac-modified promoters, we concluded that regulation was sufficiently tight to be used in whole animal experiments.

Construction of a regulatable lac-modified HDlacO−luciferase construct (A) Promoter of the bacterial lac operon. The lac operon of E. coli has three lac operator sequences. The primary operator (O) is just downstream of the RNA polymerase binding site. Additional pseudo-operator sequences (Oi and Oz) with lower affinity for the lac repressor protein are found 92 bp upstream and 401 bp downstream. (B) Modified HD promoter with two lac operator sequences (HDlacO). Two synthetic lac operator sequences were inserted into an 800-bp fragment of the HD promoter to flank the transcription start site. (C) Regulatable HDlacO−luciferase. The construct was generated by cloning the HDlacO promoter upstream of a sequence encoding the enzyme luciferase. (D) Luciferase activity in repressed and induced states. The regulatable HDlacO-luciferase reporter construct ( HDlacO) and an unmodified, nonregulatable huntingtin promoter driving luciferase that is unaffected by the repressor ( HD) were used to transiently transfect mouse embryonic fibroblasts (MEFs) that stably expressed lacI. Graphed is the luciferase activity in Relative Light Units (RLU) from the HDlacO and HD constructs in the presence (dark bars) or absence (white bars) of IPTG. Constructs were also transfected into HEK293 cells without repressor in the presence of IPTG, and IPTG alone was not found to cause a significant difference in luciferase activity (data not shown). Individual groups compared by two-way ANOVA; * Statistically significant at p < .001.
Time Course of Induction by a Single Dose of IPTG
To visualize induction of gene expression after exposure to a single dose of IPTG, we injected cells that had been transfected with the regulatable HDlacO-luciferase reporter gene or the nonregulatable HD-luciferase reporter gene into the brains of nontransgenic mice. Because the transfected cells also expressed the lac repressor, at time zero, cells carrying the regulatable HDlacO-luciferase construct (Figure 1C) should not express luciferase, whereas cells carrying the nonregulatable HD-luciferase construct would be unaffected by the presence of repressor and would express luciferase. Both groups of mice were injected with a single dose of IPTG, as well as the luciferase substrate, luciferin, and imaged using the IVIS imaging system from Xenogen. Luciferase activity was minimal in the animal injected with cells containing the regulatable luciferase reporter at time zero and after 30 min of IPTG administration, demonstrating that baseline activity in the repressed state is low. Induction by IPTG occurred over an 8-hr time period, as can be seen from the gradual accumulation of signal over the head region in the mouse shown in Figure 2A. In contrast, there was no change in the signal intensity over the head region in the mouse shown in Figure 2B, in which the nonregulatable HD-luciferase reporter construct maintained high luciferase expression from the earliest time points. Residual luciferase activity was still apparent 6 days after the single IPTG injection in both mice. A graph depicting the level of luciferase activity over time in the cells carrying the regulatable or nonregulatable luciferase reporters after a single injection of IPTG is presented in Figure 2C. Despite some day-to-day variability, luciferase activity in the animal transplanted with nonregulatable cells (blue curve) did not change significantly over the course of the experiment. In contrast, luciferase activity in the animals transplanted with regulatable cells (red curve) went from being significantly lower than nonregulatable at 30 min after the injection of IPTG to the same as nonregulatable at 24 hr post-IPTG, and then fell back to being significantly lower than nonregulatable again at 6 days after IPTG injection. These results indicate that the kinetics of gene induction in cells grafted into an animal are similar to those observed in cells in culture [4].
Determination of Optimal Dose of IPTG In Vivo
Mice transgenic for the regulatable HDlacO-luciferase reporter were generated, and the optimal dose of IPTG for induction of expression of the integrated reporter transgene was determined (Figure 3). To induce luciferase in the whole animal, IPTG was administered chronically in the drinking water. After 11 days of IPTG administration, the level of luciferase activity in animals with regulatable reporter transgenes (labeled with the dose of IPTG administered in Figure 3A) was compared by in vivo imaging to the level in animals with luciferase reporter transgenes that are not regulatable by the lac repressor and IPTG (labeled “U” in Figure 3A). When measuring luciferase in the whole animal, we found that areas covered by very little tissue, including the ears, nose, tail, and footpads, consistently emitted a higher level of luminescence than denser tissues. Similar findings have been reported for other transgenic luciferase animals [15]. Although the distribution of the luminescence suggested that luciferase activity might be temperature sensitive, with the cooler extremities exhibiting higher activity, this is unlikely, as images were acquired in a closed chamber maintained at a constant 37°C.

Transplantation and imaging of transfected cells. (A) Regulatable luciferase in grafted cells. Nontransgenic mouse injected with cells that express the regulatable HD lacO -luciferase reporter gene and the lac repressor. A single dose of IPTG was administered at time zero, and the luciferase substrate, luciferin, was administered before each imaging session; h = hours, d = days. (B) Nonregulatable luciferase in grafted cells. Nontransgenic mouse injected with cells that express the unmodified, nonregulatable HD-luciferase reporter gene and the lac repressor. A single dose of IPTG was administered at time zero, and the luciferase substrate, luciferin, was administered before each imaging session; h = hours, d = days. (C) Time course of the short-term induction of luciferase in vivo. The luciferase activity in images A (red bar) and B (blue bar) was quantified. RLU = relative light units. Individual groups analyzed by Student's t test; *Statistically significant at p < .01.

Determination of optimal IPTG dose in vivo. (A) Induction of HDlacO−luciferase after various doses of IPTG. Doses of 1, 5, 10, and 20 mM IPTG were administered chronically in the water of animals transgenic for both HDlacO−luciferase and the lac repressor. After 11 days, the level of luciferase activity was determined by imaging. NT = nontransgenic mouse, U = unregulatable mouse that expresses HDlacO -luciferase but not the lac repressor. (B) Re-repression of HDlacO−luciferase following IPTG withdrawal. Doses of 1, 5, 10, and 20 mM IPTG were administered for 11 days in the water of animals transgenic for both HDlacO−luciferase and the lac repressor. Seven days after IPTG removal, the level of luciferase activity was determined. NT = nontransgenic mouse, U = unregulatable mouse that expresses HDlacO -luciferase but not the lac repressor. (C) Dose response of IPTG on HDlacO-luciferase activity. Induced images in A (black bars) and re-repressed images in B (gray bars) were quantified, and relative light units graphed. Shown is a representative example at each dose of IPTG. NT = nontransgenic mouse, U = unregulatable mouse that expresses HDlacO-luciferase but not the lac repressor.
Doses of 1, 5, and 20 mM IPTG induced reporter activity to 35%, 46%, and 34% of the level of U, respectively, while the 10 mM IPTG dose resulted in 125% induction (Figure 3C, black bars). These results demonstrated that the optimal dose of IPTG in vivo to achieve chronic transgene induction is 10 mM. Lower induction by 20 mM IPTG is most likely due to the aversive taste or smell of IPTG at higher concentrations in the drinking water. To determine how well luciferase activity was re-repressed following IPTG withdrawal, images were taken over the course of 7 days after switching the animals to plain drinking water (Figure 3B). Luciferase expression returned to within one standard deviation of baseline levels in all animals evaluated (Figure 3C).
Time Course of Induction and Repression In Vivo
The time course of promoter induction and repression in vivo was then determined at a dose of 10 mM IPTG both in the brain, where we had to contend with the blood-brain barrier (Figure 4), and in the whole animal (Figure 5). Reporter gene expression in the brain increased 10-fold after 11 days of 10 mM IPTG administration (Figure 4A), and expression was repressed to 19% of peak activity (defined as luciferase activity on the final day of IPTG administration) after IPTG had been removed for 7 days (Figure 4B). In the whole body, reporter gene expression was increased by 5-fold after 3 days of 10 mM IPTG administration (Figure 5A), and expression was repressed to 34% of peak activity (defined as luciferase activity on the final day of IPTG administration) after IPTG had been removed for 2 days (Figure 5B). Luciferase protein levels determined by Western blot (Figures 4C and 5C) reflected induction kinetics similar to those visualized by in vivo luciferase imaging. The only exceptions were on Days 5 and 9 when the protein samples were obtained from animals with two copies of lacI. We have found that two doses of the lac repressor can lead to enhanced repression of the HDlacO promoter (data not shown), and may prolong the time course of promoter induction. These results demonstrate that the kinetics of regulated gene expression in the mouse are slower in the brain than the periphery. Although maximal induction in the rest of the body is achieved in 3 days, it takes 7 days to achieve similar results in the brain. We think that this difference is largely attributable to the blood-brain barrier, as the kinetics of induction in the brain when the blood-brain barrier was breached, as in the transplantation experiment shown in Figure 2A, follow the rapid course observed in the periphery of the animal rather than the slower course observed in the intact brain.

Time course of in vivo induction across the blood-brain barrier. (A) Sequential in vivo images of luciferase activity in the brain. HDlacO-luciferase activity in the brain of one animal transgenic for both HDlacO-luciferase and the lac repressor. The red bar indicates the days on which IPTG was administered. The square overlayed on the mouse in Day 0 depicts the area of interest (ROI) from which RLU values were determined; d = day. (B) Time course of long-term luciferase induction in the brain. The luciferase activity in the transgenic mouse pictured in (A) was quantified. The red bar indicates IPTG administration. RLU = relative light units. (C) luciferase protein level in the brain. Western blot of brain lysate from HDlacO-luciferase animals administered IPTG for the times indicated. GAPDH was used as a reference protein. NT = nontransgenic, U = unregulatable mouse that expresses HD lacO−luciferase but not the lac repressor; h = hours; d = day.
Comparison of Luciferase and lac Repressor Protein Levels in Brain and Peripheral Tissues
To determine how much of this difference might be due to differences in the level of the lac repressor or the activity of the HD promoter in brain and peripheral tissues, we performed Western blot analysis of tissue lysates from a male animal expressing HDlacO-luciferase and the lac repressor 24 hr after induction by IPTG (Figure 6A). Laser densitometry was used to determine the volumes of the chemiluminescence associated with either the luciferase or repressor protein bands. The volume of luciferase protein was divided by the volume of lac repressor protein to yield a ratio of luciferase units per one unit of lac repressor in each tissue examined (Figure 6B). The resulting value reflects the variation in HDlacO promoter activity and IPTG accessibility characteristic for each individual tissue. In the majority of peripheral tissues studied, this ratio is less then one. In these tissues, Hdh gene activity is normally low [16], and the HDlacO promoter is too weak to overcome the repressive effects of lacI within 24 hr of IPTG induction, even though IPTG accessibility would not be a problem. In the testis and brain, however, Hdh expression is high [9,16], and thus the ratios of luciferase units per one unit of lac repressor are greater than one. Because the blood-brain barrier hinders the accessibility of IPTG to the brain but not the testis, the amount of HDlacO-luciferase activity is lower in the brain than in the testis after 24 hours of induction. These results demonstrate that luciferase expression in lac-regulated systems is sensitive both to the levels of lac repressor and IPTG, and to inherent tissue-specific differences in Hdh expression.

Time course of in vivo induction in the periphery. (A) Sequential in vivo images of luciferase activity in the periphery. HDlacO-luciferase activity in the body of one animal transgenic for both HDlacO-luciferase and the lac repressor. The red bar indicates the days on which IPTG was administered. The rectangle overlayed on the mouse in Day 0 depicts the area of interest (ROI) from which RLU values were determined; d = day. (B) Time course of long-term luciferase induction in the periphery. The luciferase activity in the transgenic mouse pictured in (A) was quantified. The red bar indicates IPTG administration. RLU = relative light units. (C) Luciferase protein level in the liver. Western blot of liver lysate from HDlacO-luciferase animals administered IPTG for the times indicated. GAPDH was used as a reference protein. NT = ontransgenic, U = unregulatable mouse that expresses HDlacO−luciferase but not the lac repressor; h = hours; d = day.
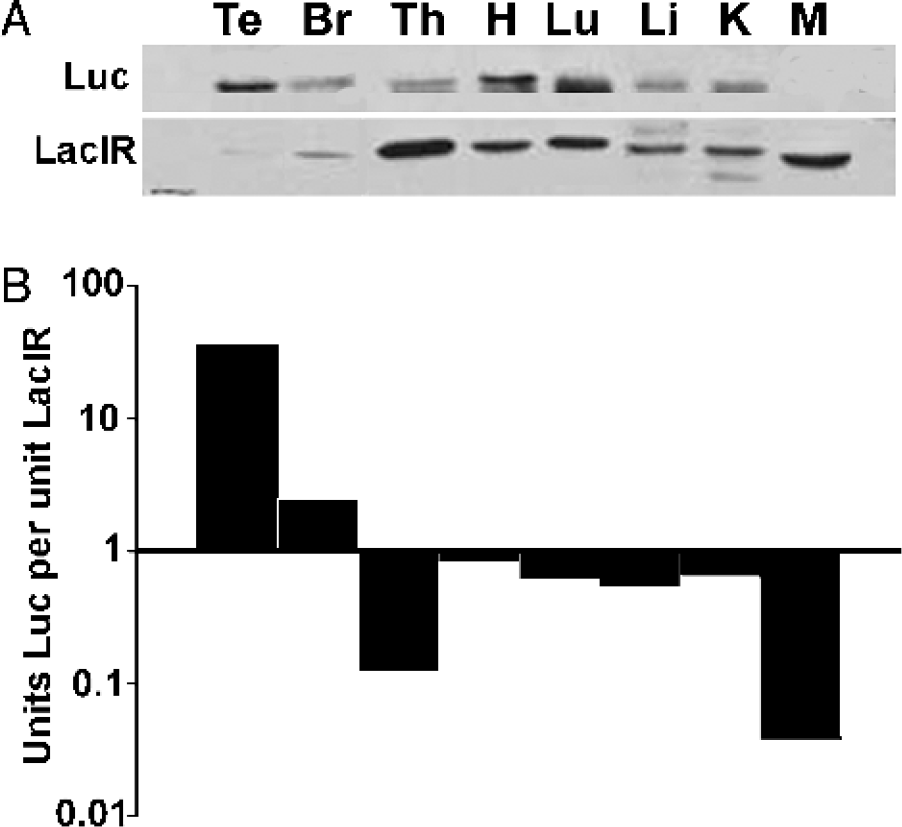
Levels of luciferase and lac repressor protein in brain and peripheral tissues. (A) Analysis of luciferase and LacI protein levels. Western blot of brain and peripheral tissue lysates from an HDlacO-luciferase animal administered LPTG for 24 hr Th = thymus; H = heart; Lu = lung; Li = liver; K = kidney; T = testis; M = muscle; Br = brain. (B) Ratio of luciferase to LacIR proteins. For each tissue in (A), the volume of the luciferase band was divided by the volume of the LacIR band to determine the units of luciferase protein per one unit of LacIR protein. Ratios are graphed on a log scale.
Induction of a lac-modified Transgene during Early Embryogenesis
To determine how well reporter gene activity could be regulated during early embryogenesis, we mated nontransgenic females or females transgenic only for the lac repressor to males transgenic for HDlacO-luciferase. Because neither female had a luciferase transgene, any embryos that received an HDlacO-luciferase transgene from their father could be visualized within the two uterine horns that enlarge longitudinally in the abdominal cavity of the pregnant female as the embryos develop. In the absence of the lac repressor (Figure 7C), reporter gene activity was detected at E8.5, which is also the earliest stage at which Hdh expression has been found in the mouse [10–12]. In the presence of lac repressor and the absence of IPTG (Figure 7A), reporter gene activity was repressed to a level approximately 10-fold lower than that of the embryos shown in Figure 7C. In the presence of lac repressor and IPTG (Figure 7B), reporter gene activity was induced from repressed levels to a level equivalent to that of the embryos shown in Figure 7C. Thus, even during very early embryogenesis, the lac operator-repressor system can specify when gene expression begins and ends, even in the presence of endogenous signals that would otherwise be capable of directing promoter activity in a developmental stage-specific manner.
To verify that induction of the modified HD promoter (HDlacO) was unaffected by lac operator insertion and could be regulated in the same way as the endogenous Hdh promoter when lac elements were not being used, ex vivo assays of luciferase activity in embryos were performed. In embryos carrying the HDlacO-luciferase transgene in the absence of the repressor transgene, the regulation of the HDlacO and Hdh promoters should be the same. As Figure 8 illustrates, activity of the transgene promoter was first detected by ex vivo assays at E8.5, the same day that luciferase activity was detected by whole-body luciferase imaging of pregnant females (Figure 7C). These data demonstrate that the HDlacO luciferase transgene in the absence of lac regulation begins to be expressed at the precise developmental time point when the endogenous Hdh gene begins to be expressed [10–12]. Virtually no luciferase activity was detected prior to the appropriate developmental time point. Collectively, these experiments with regulatable HD transgenes demonstrate that modified promoters follow the same signals controlling their endogenous counterparts in the absence of the lac repressor, but come under the control of IPTG when lac regulation is in place. Signals directing endogenous Hdh expression, which potentially might have simultaneously directed the activity of the HD promoter in the transgene, were overridden by the lac repressor, and exogenously supplied IPTG that crossed the placenta was required before induction of embryonic transgene expression could take place.
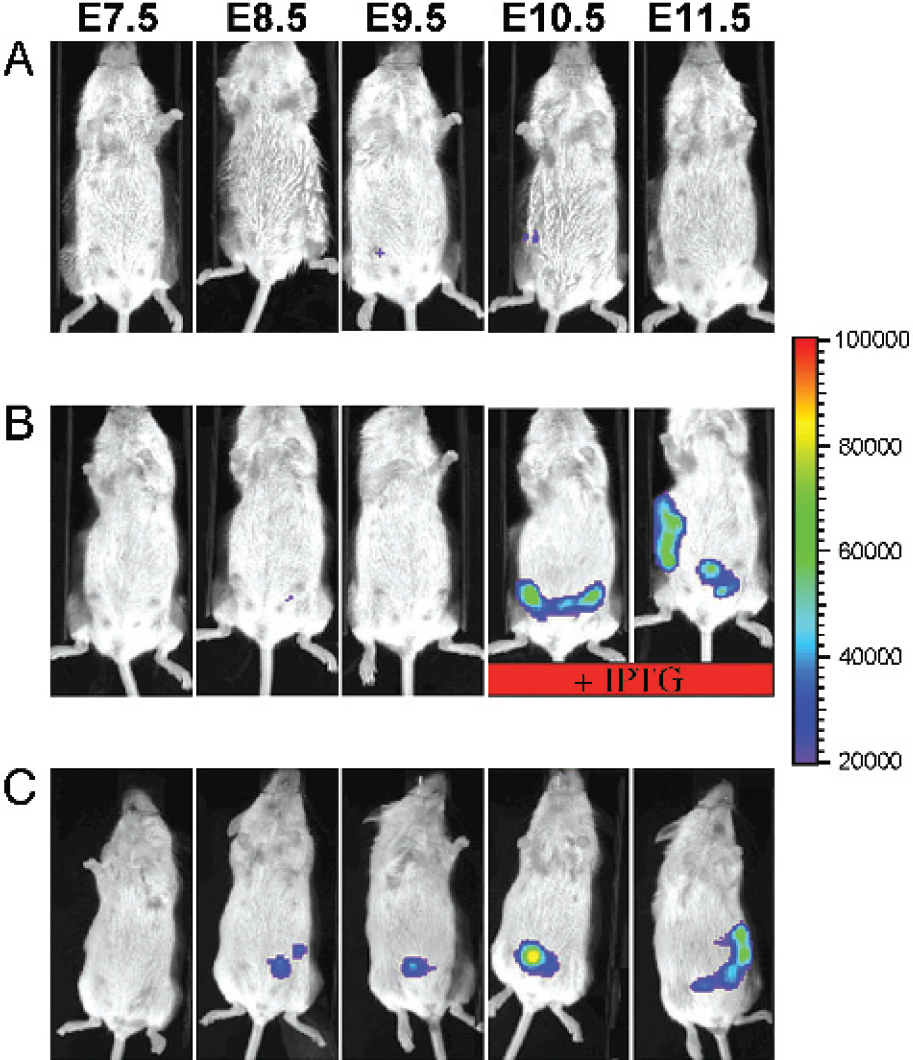
Induction across the placenta during early embryogenesis. (A) Repression. Embryos are transgenic for both HDlacO-luciferase and the lac repressor. In the absence of IPTG, the DlacO-luciferase activity is repressed in the embryos. (B) Induction. Embryos are transgenic for both HDlacO-luciferase and the lac repressor. Ln the absence of LPTG (E7.5-E9.5) HDlacO-luciferase activity is repressed in the embryos. Upon administration of 10 mM LPTG to the mother (E10.5 and E11.5), HDlacO-luciferase activity is induced in the embryos. (C) Unregulated expression. Embryos are transgenic for only HDlacO-luciferase, and therefore have unrepressed HDlacO-luciferase activity, even in the absence of IPTG. A red bar indicates administration of 10 mM IPTG in the drinking water of the animal. Images were captured when embryos were E7.5-E11.5 as indicated above. Pregnancy was determined by vaginal plug, and E0.5 was marked by the day a plug was observed.

Induction of a lac-modified promoter by endogenous program. Ex vivo assay of luciferase activity in unrepressed embryos at E6.5, E7.5, and E8.5. Filled circles represent individual embryos. The images below are from a nontransgenic female carrying unrepressed HDlacO-luciferase transgenic embryos on daysE6.5, E7.5, and E8.5 of embryonic development. RLU = relative light units; Days p.c. = days post coitum, n = number of embryos harvested and assayed.
Discussion
Conditional regulation of target genes within the whole animal is an important tool for elucidating the function of a gene, as well as circumventing the issues of chronic toxicity or embryonic lethality. We used a combination of reporter genes and in vivo imaging to determine the intrinsic kinetics of conditionally regulated target genes in the mouse by the lac operator-repressor system. Although the degree of repression and de-repression might vary, the kinetics of induction and repression described here for the HDlacO promoter should be applicable to other lac-modified promoters, and thus will be of great benefit in the future.
Using in vivo imaging, differences in the kinetics of regulated gene expression in the brain and the rest of the body were easily revealed. The rates of induction and repression were slower and the degree of repression was lower in the brain compared to the periphery. Part of the reason for reduced repression is undoubtedly that the β-actin promoter is less active in the brain, which results in lower lac repressor levels in brain regions than in other tissues (see Figure 6). The slower rates of both induction and repression in the brain, on the other hand, can be attributed at least in part to the chemical nature of the inducer, IPTG. Both the isopropyl group and the thiol moiety of this sugar derivative may contribute partially hydrophobic effects and steric hindrance to the molecule, which would make it more difficult for it to cross the blood–brain barrier and more likely to stay in the lipid-rich environment of the brain once there. A less hydrophobic lac inducer might shorten the time over which IPTG exerts its effect to yield a more rapid rate of response to both induction and re-repression. In fact, an analogue of IPTG that lacks the thiol group has recently been described that is more stable, less toxic, and capable of greater induction over extended periods of time [14]. Past studies suggest that maximal uptake of IPTG into animal tissue is achieved within 4 hr [13]. Of the six tissues analyzed in that study, however, brain and adipose tissue took up the least amount of IPTG in that time. The slower kinetics of re-repression in the brain might also reflect the fact that in the brain most cells are postmitotic. This might have the effect of slowing down the rate of IPTG metabolism and sustaining repression for a significantly longer time than in more metabolically active tissues.
Noninvasive imaging of genes regulated by a second conditional system (tet) using methods similar to those described here has been reported [15]. The kinetics of tet-regulated expression were similar to those of lac-regulated expression, with brain regions demonstrating longer induction and clearance rates than those of the whole body. The correlation between in vivo luciferase readings and levels of luciferase protein within individual tissues was also similar to the lac system. Taken together, these results demonstrate the feasibility of regulatable gene expression using bacterial regulatory elements in the mouse. The advantage that either of these systems offers over one utilizing mammalian elements borrowed from hormone inducible or heavy metal inducible gene regulatory regions is the precision with which the target gene can be controlled. Beyond this, there are advantages to using lac- rather than tet-based technology. The lac system is not dependent on viral elements, and utilizes mammalian promoters that confer spatial and temporal specificity on genes transcribed from them. The expression profile of a lac-modified promoter mirrors that of its unmodified, endogenous counterpart. Most importantly, the expression of lac-modified transgenes remains stable across the lifespan of an animal.
Knowing the full capabilities of a regulatable system and characterizing the kinetics of such regulation should allow even more accurate control of gene expression than that achieved up to now. The combination of in vivo imaging and lac regulation is a powerful tool for generating conditional transgenic mice that can be screened rapidly for optimal regulation and expression patterns, and for monitoring the induction and repression of regulated genes noninvasively.
Footnotes
Acknowledgments
We thank Dr. David Housman and the HDF CHDI Reagent Resource Bank for the gift of DNA encoding the human huntingtin promoter (plasmid qp25). We thank Dr. Stuart Berr and the Small Animal Multi-Modality Imaging Core at the University of Virginia for assistance with imaging. We are grateful to Dr. John Belletire (NORAC Pharma, Azusa, CA) for organic insights into the complex chemistry of galactosides. We also thank Drs. Kevin Lee and Tarkan Calisanellar (Department of Neuroscience, University of Virginia) for injection of luciferase-expressing cells into mouse brains for the experiment shown in ![]() . We thank W. Gluba and B. Bernier for excellent technical support. This work was supported by the National Center for Research Resources and National Institutes of Health (NIH) Grant RR11102 (H.S.), the Hereditary Disease Foundation (H.S.), and National Research Service Award predoctoral fellowship NS046197 (A.B.R.).
. We thank W. Gluba and B. Bernier for excellent technical support. This work was supported by the National Center for Research Resources and National Institutes of Health (NIH) Grant RR11102 (H.S.), the Hereditary Disease Foundation (H.S.), and National Research Service Award predoctoral fellowship NS046197 (A.B.R.).