
Abstract
Solid tumors containing more hypoxic regions show a more malignant phenotype by increasing the expression of genes encoding angiogenic and metastatic factors. Hypoxia-inducible factor-1 (HIF-1) is a master transcriptional activator of such genes, and thus, imaging and targeting hypoxic tumor cells where HIF-1 is active are important in cancer therapy. In the present study, HIF-1 activity was monitored via an optical in vivo imaging system by using a luciferase reporter gene under the regulation of an artificial HIF-1-dependent promoter, 5HRE. To monitor tumor hypoxia, we isolated a stable reporter-transfectant, HeLa/5HRE-Luc, which expressed more than 100-fold luciferase in response to hypoxic stress, and observed bioluminescence from its xenografts. Immunohistochemical analysis of the xenografts with a hypoxia marker, pimonidazole, confirmed that the luciferase-expressing cells were hypoxic. Evaluation of the efficacy of a hypoxia-targeting prodrug, TOP3, using this optical imaging system revealed that hypoxic cells were significantly diminished by TOP3 treatment. Immunohistochemical analysis of the TOP3-treated xenografts confirmed that hypoxic cells underwent apoptosis and were removed after TOP3 treatment. These results demonstrate that this model system using the 5HRE-luciferase reporter construct provides qualitative information (hypoxic status) of solid tumors and enables one to conveniently evaluate the efficacy of cancer therapy on hypoxia in malignant solid tumors.
Keywords
Introduction
An insufficient blood supply to a rapidly growing tumor leads to the presence of hypoxia, which is a well-known feature of solid tumors [1]. It is clinically important that insufficient tumor oxygenation affects the efficiency of chemotherapy and radiotherapy [2–4]. Moreover, hypoxic conditions increase the aggressiveness of tumor cells by inducing the expression of several genes related to proliferation, angiogenesis, invasion, and metastasis to aid survival in the severe tumor microenvironment [5–7]. Most of such genes contain a hypoxia responsive element (HRE), which is the binding site of hypoxia inducible factor-1 (HIF-1) [8], the master transcriptional regulator of cellular adaptive responses to hypoxic stress [5,9]. HIF-1 is a heterodimer that consists of an alpha subunit (HIF-1α) and the constitutively expressed beta subunit (HIF-1β). HIF-1α expression is regulated in an oxygen-dependent manner at the posttranslational level and is responsible for the regulation of HIF-1 activity [9]. In normoxia, HIF-1α is hydroxylated on the proline residues in the oxygen-dependent degradation domain (ODD) by prolyl hydroxylases [10,11]. The hydroxylated proline residues accelerate the interaction of HIF-1α protein with von Hippel–Lindau tumor suppressor protein, resulting in the rapid ubiquitination and subsequent degradation of HIF-1α [5,12–15].
HIF-1 as well as tumor hypoxia have been recognized as a crucial target for cancer therapy, therefore, strategies detecting and evaluating them are desired [5,16]. Recently, hypoxia-responsive promoters have been applied to develop hypoxia imaging and targeting strategies. HRE derived from vascular endothelial cell growth factor (VFGF) promoter [8] has been employed to establish the artificial hypoxia-responsive promoter. The promoters containing HRE in tandem significantly increase the gene expressions in response to hypoxic stress and successfully induce anti-tumor effects in vivo [17–22]. Above all, 5HRE promoter, which consists of five copies of HRE and human cytomegalovirus minimal promoter, enhances more than 500-fold transcription under the hypoxic conditions than under the aerobic conditions [19]. Green fluorescent protein [20,21] and a prodrug-activating enzyme [22] under the regulation of 5HRE promoter show the potential for tumor hypoxia-specific imaging and targeting, respectively. We have developed a protein prodrug, TOP3 [23,24], which is composed of the protein transduction domain derived from human immunodeficiency virus-1 tat protein (HIV tat-PTD), a part of HIF-1α ODD domain and the dormant form of caspase-3, procaspase-3. HIV tat-PTD fusion proteins can be delivered to many different cells in the whole body in a concentration-dependent manner [25,26] and ODD fusion proteins can be specifically stabilized under hypoxic conditions [23]. Therefore, hypoxia-specific targeting of tumor cells has been accomplished by TOP3 in hypoxic ascites as well as in vitro [23,27].
In this report, we demonstrate that the imaging system using a 5HRE-luciferase reporter gene can efficiently detect and monitor tumor hypoxia where HIF-1 is active in living mice. By using this system, we successfully demonstrate that TOP3 certainly targets hypoxic tumor cells in solid tumors, indicating that this model system allows sensitive, real-time, and spatio-temporal analyses of tumor hypoxia in solid tumors and provides a useful method to evaluate the efficacy of a cancer therapy on hypoxia in malignant solid tumors.
Materials and Methods
Cell Cultures, Reagents, and Hypoxic Treatment
The human cervical epithelial adenocarcinoma cell line, HeLa, and the human pancreatic cancer cell line, CFPAC-1, were purchased from the American Type Culture Collection (#CCL-2 and #CRL-1918, respectively). HeLa cells were maintained in 5% FBS-Dulbecco's modified Eagle's medium, and CFPAC-1 cells were maintained in 10% FBS–Iscove's modified Dulbecco's medium (Nacalai Tesque, Kyoto, Japan). Both of the mediums were supplemented with penicillin (100 units/mL) and streptomycin (100 μg/mL). To create a hypoxic condition of <0.02% of oxygen tension, the cells were treated in a Bactron Anaerobic Chamber, BACLITE-1 (Sheldon Manufacturing, Cornelius, OR).
Preparation of Protein Prodrug
TOP3 was overexpressed in Escherichia coli and purified as described previously [23]. Purified TOP3 was dissolved in Tris–HCl buffer (pH 8.0) at a concentration of 1 mg/mL.
Plasmid DNA
To construct the pEF/Luc plasmid, which constitutively expresses luciferase under the control of EF-1α promoter [28], luciferase cDNA was amplified from pGL3 promoter vector (Promega, Madison, WI) by PCR using Luc-Bam-sense primer; AAGGATCCACCATGGAAGACGCCAAA and Luc-RV-anti primer; TTGATATCTTACACGGCGATCTTTCC. The PCR product was then digested with BamHI and EcoRV and inserted between BamHI and EcoRV recognition sites of pEF6/Myc-His B plasmid (Invitrogen, Carlsbad, CA). To construct the pEF/5HRE-Luc plasmid, the DNA fragment, which consists of 5HRE promoter and luciferase gene, was obtained by KpnI and XbaI digestion of 5HRE-hCMVmp-Luc plasmid [19] and inserted between KpnI and XbaI recognition sites of pEF/myc/cyto plasmid (Invitrogen).
Isolation of HeLa/EF-Luc and HeLa/5HRE-Luc Cells
To establish HeLa/EF-Luc and HeLa/5HRE-Luc cell clones, HeLa cells were transfected with pEF/Luc plasmid and pEF/5HRE-Luc plasmid, respectively, by calcium phosphate method using the Mammalian Transfection Kit (Stratagene, La Jolla, CA) and were selected by culturing for an additional 10 days in the culture medium containing 5 μg/mL of blasticidine S (Invitrogen) for HeLa/EF-Luc or 400 μg/mL of G418 (Nacalai Tesque) for HeLa/5HRE-Luc. Antibiotics-resistant colonies were isolated and established as clones. Representative clones were used here.
Luciferase Assay in vitro and Western Blot Analysis
HeLa/5HRE-Luc cells were seeded onto a 24-well dish (1 × 10⁴ cells/well) and cultured under aerobic or hypoxic conditions for 0, 1, 2, 4, 8, and 16 hr. The cells were then washed with PBS and lyzed with 100 μL Passive Lysis Buffer (Promega) and 10 μL of the lysates were applied for the luciferase assay (Promega). For Western blot analysis, the cells were directly harvested in the 100 μL of 1× loading buffer [29] after the same hypoxic treatment as above, and 20 μL of them were electrophoresed on a 7.5% SDS–Polyacrylamide gel and transferred onto PVDF membrane (Amersham Biosciences, Piscataway, NJ). HIF-1α protein was detected with monoclonal anti-HIF-1α antibody (BD Bioscience Pharmingen, San Diego, CA) and anti-mouse IgG horseradish peroxidase linked whole antibody (Amersham Bioscience) using the ECL-PLUS system (Amersham Bioscience) according to the manufacturer's instruction.
Real-time Monitoring of Luciferase Activity in vivo
Cell suspensions of HeLa/EF-Luc cells and HeLa/5HRE-LUC cells (1 × 10⁶ cells/100 μL of PBS) were subcutaneously inoculated into the left and right hind legs of 6-week-old female nude mice (BALB/c nu/nu; Japan SLC, Hamamatsu, Japan), respectively. The mice were used for each experiment 10 days after the implantation. For the in vivo imaging of bioluminescence, the tumor-bearing mice were intravenously injected with 100 μL of
Growth Delay Assay
The tumor mass of CFPAC-1 xenografts was measured with a caliper, and the tumor mass was calculated as 0.5 × L × W2. The tumor mass of HeLa/EF-Luc xenografts was measured as the externally detected photon counts. The tumor mass on each day was compared with the one on Day 0, to calculate the relative tumor mass.
Immunohistochemical Analysis
Pimonidazole hydrochloride (Natural Pharmacia International, Belmont, MA) was intraperitoneally injected into tumor-bearing mice (60 mg/kg) at 90 min before surgical excision of solid tumor in each experiment. The excised solid tumors were fixed in 10% formalin neutral buffer solution (pH = 7.4; Wako Pure Chemical Industries, Osaka, Japan) and embedded in paraffin.
To detect pimonidazole-binding and luciferase proteins, paraffin-embedded sections were treated with anti-pimonidazole (Natural Pharmacia International) and anti-luciferase (Promega) antibodies, respectively, and stained by indirect immunoperoxidase detection method (DakoCytomation, Carpinteria, CA). Counter-staining with hematoxylin was also conducted. Paraffin-embedded serial sections were also stained with hematoxylin–eosin (HE). To calculate the percentage of hypoxic regions, pimonidazole-positive areas were quantified using NIH Image 1.63 software (NIH, Bethesda, MD) and compared with the one of whole tumor. This analysis was conducted in a double-blind fashion.
For the detection of apoptotic cells, the paraffin-embedded sections were stained with ApopTag Fluorescein In Situ Apoptosis Detection Kit (Chemicon International, Temecula, CA), according to the manufacturer's instruction.
Statistical Analysis
Data are expressed as means ± SD. Statistical significance of differences was determined by the paired two-tailed Student's t test. Differences were considered statistically significant for p < .05.
Results
HIF-1–dependent Luciferase Activity in HeLa/5HRE-Luc Cells
To assess the HIF-1 activity in solid tumors, we took advantage of the HIF-1-mediated gene expression. We isolated a stable HeLa clone (HeLa/5HRE-Luc) after transfection with 5HRE-hCMVmp-Luciferase reporter gene [19], which was reported to induce luciferase expression in response to hypoxic stress. When HeLa/5HRE-Luc cells were cultured under hypoxic conditions, their luciferase activity was increased 100-fold more than the one cultured under aerobic conditions (Figure 1A). HIF-1α proteins were gradually stabilized over the hypoxic treatment periods (Figure 1B). These data indicate that the HeLa/5HRE-Luc cells can be employed to monitor the oxygen-dependent HIF-1 activity.

HIF-1-dependent luciferase activity in HeLa/5HRE-Luc cells. (A) HeLa/5HRE-Luc cells were treated under aerobic or hypoxic conditions for the indicated time and their luciferase activities were measured and luminescence (RLU) is shown in the figure. The results are the mean ± SD, n = 3. (B) HeLa/5HRE-Luc cells were treated under hypoxic conditions for the indicated time and HIF-1α protein expression was analyzed by Western blotting.
Optical Imaging of HIF-1 Activity in Tumor Xenograft
Optical in vivo imaging systems enable us to detect tumor cells in the same animals repeatedly [30], and thus, we can monitor the change of luciferase activity in the same tumor xenografts by measuring bioluminescence throughout the experiment period. We first examined HeLa/5HRE-Luc xenografts by immunohistochemical analysis if luciferase expression was corresponding with hypoxic microenvironment in them. The presence of hypoxic cells in solid tumors was assessed by using a bioreductive hypoxia marker, pimonidazole hydrochloride [31]. The regions detected with anti-luciferase antibody (Figure 2Aa; dark brown) were almost identical to the pimonidazole-positive regions (Figure 2Ab; dark brown), and both were located at the boundary areas between viable (Figure 2Ac; V) and necrotic regions (Figure 2Ac; N), indicating that the cells expressing luciferase were certainly hypoxic. The bioluminescence from the HeLa/5HRE-Luc tumor xenografts was externally monitored by optical in vivo imaging system (Figure 2Ba; right hind leg).
To confirm that the intensity of bioluminescence from HeLa/5HRE-Luc xenografts reflects hypoxic status in the xenografts, we reduced the blood flow to the HeLa/5HRE-Luc xenografts by ligaturing the tumor-bearing right legs and examined the xenografts via an optical in vivo imaging system at the indicated time (Figure 2Ba–Bd). HeLa/EF-Luc tumor xenografts, in which luciferase was constitutively expressed, were set in the left hind legs and were untreated during the experiment as an internal control for the imaging procedure. The bioluminescence from the ligatured HeLa/5HRE-Luc xenografts increased over time (Figure 2Ba–Bd), whereas changes in bioluminescent intensity were hardly observed without ligature (Figure 2Be–Bh). To examine whether the increase in bioluminescence was dependent on the 5HRE promoter, we conducted same experiments using the mice with HeLa/EF-Luc xenografts in both legs. The bioluminescence intensity from the HeLa/EF-Luc xenografts was not influenced by the ligaturing (data not shown). Each experiment was conducted by using 5 independent tumor-bearing mice to confirm reproducibility, and representative images are shown in the figure. These results indicate that the increase of bioluminescence from ligatured HeLa/5HRE-Luc xenograft reflected the increase of hypoxic regions because of poor blood supply and suggest that the 5HRE-luciferase reporter system can be used to monitor tumor hypoxia in solid tumors via in vivo imaging system.
Evaluation of Hypoxia-targeting Efficacy of TOP3 with the Optical Imaging Method
We recently developed an anti-tumor protein prodrug, TOP3, which is composed of HIV-1 tat-PTD, a part of HIF-1α ODD domain and procaspase-3 (Figure 3). Because Tat-PTD ensures the in vivo delivery of fusion protein into a variety of different cells in a rapid and concentration-dependent manner [25,26], and the ODD domain facilitates the specific stabilization of fusion protein under hypoxic conditions [23], tat-ODD fusion protein, whose stability is regulated through the same ODD-dependent mechanism as HIF-1α protein, is accumulated in the hypoxic tumor cells in vivo [23,27]. Accumulated TOP3 is subsequently cleaved by endogenous caspases, which are activated to some extent by hypoxic stress, and increases active caspase-3, resulting in hypoxia-specific cell death in hypoxic ascites as well as in vitro [23,27]. Although TOP3 did reduce the volume of solid tumors, it was not clear if TOP3 targeted hypoxic tumor cells in solid tumors. By using this imaging method, we can monitor hypoxic tumor cells over TOP3 treatment period, and thus, we can clarify the TOP3 effect on solid tumors.
TOP3 was intraperitoneally injected into nude mice (n = 5) with a HeLa/5HRE-Luc xenograft in the right hind leg and with a HeLa/EF-Luc xenograft in the left hind leg three times in 5-day intervals. The bioluminescent signals from both xenografts were monitored via the in vivo imaging system and relative photon counts and representative images are shown (Figure 4A–C). Because the photon count corresponds to tumor mass when the luciferase is constitutively expressed in the tumor cells [30], the effect of TOP3 on whole tumor mass was measured as the bioluminescence from the HeLa/EF-Luc xenograft in the left hind leg. On the other hand, the effect of TOP3 on hypoxic tumor cells was assessed as the bioluminescence from the HeLa/5HRE-Luc xenograft in the right hind leg. The bioluminescent signals from both HeLa/EF-Luc and HeLa/5HRE-Luc xenografts of buffer-treated mice increased over the observation periods (Figure 4A, B, and Ca–Cc). In the buffer-treated mice, the increase in the bioluminescence from hypoxic regions was more than 22–fold (Figure 4B) during the period, in which the whole tumor mass increased about 16–fold (Figure 4A), indicating that hypoxic regions gradually increased as the tumor volume increased. On the other hand, the bioluminescence from hypoxic regions of the TOP3–treated mice was minimized on Day 3 after the first administration and was continuously suppressed during the treatment period (Figure 4B and Cd–Cf: right legs), in which whole tumor mass increased about 9-fold (Figure 4A). These data clearly demonstrate the hypoxia-targeting effect of TOP3 in solid tumors.

Optical imaging of HIF-1 activity in HeLa/5HRE-Luc tumor xenografts. (A) Serial sections of HeLa/5HRE-Luc xenograft were subjected to immunohistochemical analysis with anti-luciferase antibody (a) and anti-pimonidazole antibody (b), and to HE staining (c). N = necrotic tumor tissue; V = well-oxygenated viable tumor tissue. (B) HeLa/EF-Luc cells and HeLa/5HRE-Luc cells were subcutaneously inoculated into the left and right hind legs, respectively (a–h). Blood flow to the HeLa/5HRE-Luc xenograft was decreased by ligaturing the right hind leg (a–d). During the ligaturing treatment, change in bioluminescence was sequentially monitored in the same mouse just after (a), 2 hours after (b), 4 hours after (c), and 8 hours after (d) the beginning of ligaturing. As a control, the bioluminescence was sequentially monitored without the ligature at the same time course (e–h). HeLa/EF-Luc xenograft in the left leg was left untreated as an internal control. During the experiment, mice were kept exposed to anesthesia with 2.5% of isoflurane gas in oxygen flow (1.5 L/min) and put on the imaging stage.

Oxygen-dependent degradation and hypoxia-specific activation of TOP3. In well-oxygenated cells, TOP3 will be degraded through the same ubiquitin–proteasome system as HIF-1α protein (for details, see Ref. [16]). In hypoxic tumor cells, TOP3 are stabilized, and upstream caspases are activated to some extent by hypoxic stress, and therefore, TOP3 will be cleaved to generate an active caspase-3, inducing apoptotic cell death.
Specific Targeting of Hypoxic Tumor Cells by TOP3 in vivo
To investigate whether the suppressed bioluminescence in TOP3-treated xenografts were the consequence of the reduction of hypoxic/HIF-1-activating cells in solid tumors, we investigated the sections of TOP3-treated xenografts by immunohistochemical analysis. To avoid the influence of luciferase expression, CFPAC-1 xenografts were examined with the same experimental time frame as HeLa/5HRE-Luc xenografts. First of all, we confirmed that the growth of CFPAC-1 xenografts was comparatively suppressed during TOP3 treatment (Figure 5A). The growth of TOP3-treated tumors was suppressed during the sequential TOP3 treatment, but accelerated thereafter (>Day 15); the slope of the growth curve of buffer-treated tumors was 0.211. The slope of the TOP3-treated tumor (from Day 0 to Day 15) was 0.087, but it reverted to a similar slope to that of the untreated tumor after Day 15 (0.225). Tumor growth doubling time (TGDT) clearly shows a growth delay of TOP3-treated tumors (Table 1; p < .05). TOP3 treatment decreased the growing speed of the CFPAC-1 tumor to almost one-third of the untreated ones.
The tumors were surgically excised 5, 24, and 48 hr after TOP3 administration, and were embedded in paraffin for HE staining and for immunohistochemical analysis with anti-pimonidazole antibody. We repeated the above staining with three to four independent tumors for each group. The percentage of pimonidazole-positive cells (dark brown) in a whole solid tumor represents the percentage of hypoxic regions (Figure 5B). Hypoxic regions in the 48-hr samples from TOP3-treated xenografts were significantly reduced compared with the ones in buffer-treated xenografts (p < .01). The staining pattern of serial sections from the 5-hr samples was basically the same between TOP3-treated and buffer-treated xenografts, whereas the patterns of 24- and 48-hr samples from TOP3-treated xenografts were totally different from those of buffer-treated ones (Figure 5C). The pimonidazole-positive cells were gradually decreased in the TOP3-treated sections (Figure 5Cg, Cj, and Cm). Higher magnified images clearly show that the boundary areas between viable regions and necrotic regions, which corresponded to pimonidazole-positive cells in buffer-treated xenografts, were empty spaces in the TOP3-treated samples (Figure 6D–F). To investigate the status of the hypoxic tumor cells between 5 and 24 hr after TOP3 treatment, we examined xenografts with TαT-mediated αUTP nick end labelling (TUNEL) at 12 hr after TOP3 treatment. Much more TUNEL-positive green fluorescence was detected around the boundary area between viable and necrotic cells in the TOP3-treated xenograft than in the buffer-treated xenograft (compare Figure 7A with Figure 7D). These data indicate that TOP3 induces apoptosis in hypoxic tumor cells of the boundary regions and efficiently eliminates these cells.
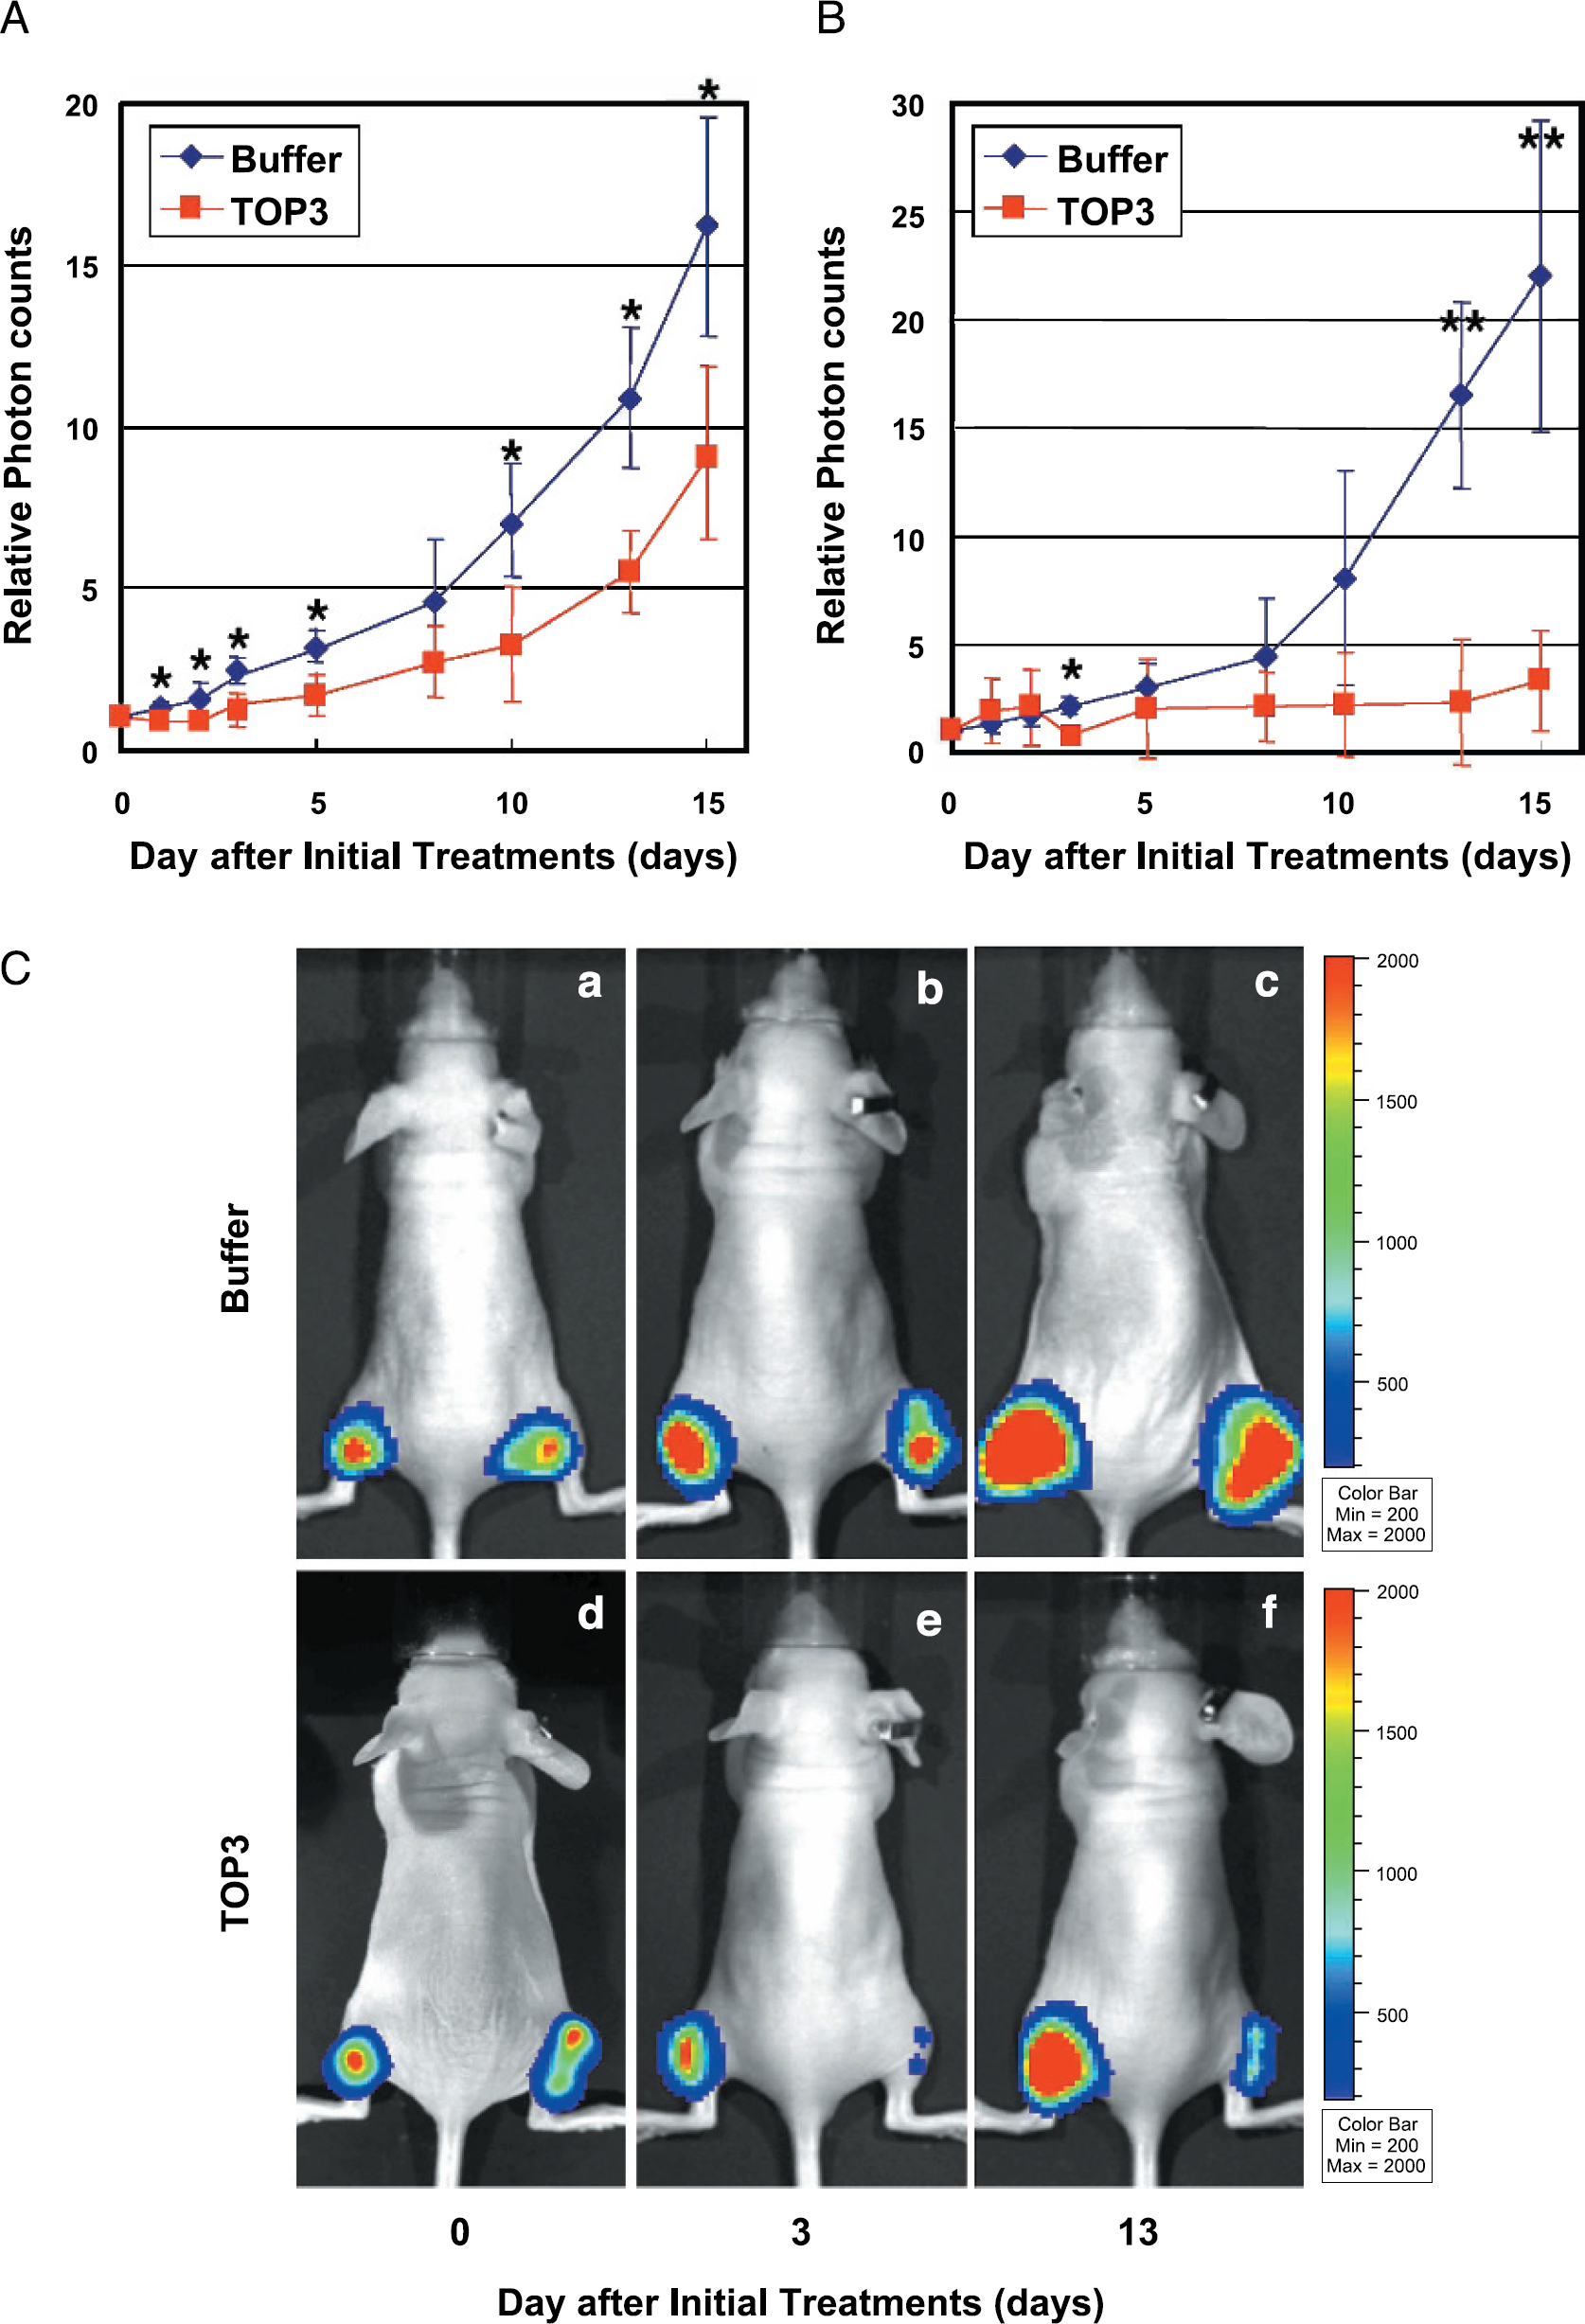
Evaluation of the efficacy of TOPS via an optical in vivo imaging system. Tumor-bearing mice with HeLa/EF-Luc cells (left hind leg) and HeLa/5HRE-Luc cells (right hind leg) were intraperitoneally injected with Tris–HCl buffer (pH 8.0) or TOP3 (20 mg/kg) on Days 0, 5, and 10. (A) To calculate the relative tumor mass during the buffer or TOPS treatments, the bioluminescence (photons/sec/ROI) from ReLa/EF-Luc tumor xenograft in the left hind leg on each day was divided by the one on Day 0 and shown as relative photon counts. The results are the mean of 5 independent tumor-bearing mice ± SD for each group. *p < . 05. (B) To calculate the relative hypoxic regions during the buffer or TOP3 treatments, the bioluminescence (photons/sec/ROI) from HeLa/5HRE-Luc tumor xenograft in the right leg on each day was divided by the one on Day 0 and shown as relative photon counts. The results are the mean of 5 independent tumor-bearing mice ± SD for each group. *p < .05. **p < .01. (C) The bioluminescence was externally monitored by IVIS imaging system to analyze the effects of the TOPS treatments on the whole tumor mass (see left hind leg) and on the hypoxic regions (see right hind leg). Representative images just after (a and d), 3 days after (b and e), and 13 days after (c and f) initial TOP3 injection are shown.

Decrease in hypoxic/HIF-1-expressing cells in the TOP3-treated tumor xenografts. (A) CFPAC-1 tumor-bearing mice were intraperitoneally injected with buffer or TOPS on Days 0, 5, and 10. To calculate the relative tumor mass, the tumor mass measured with caliper on each day was divided by the one on Day 0. Results are the mean of 6 independent tumor-bearing mice ± SD for each group. (B) Tumor xenografts of CFPAC-1 cells were surgically excised 5, 24, or 48 hr after buffer or TOP3 injection, and stained with anti-pimonidazole antibody. To calculate the percentage of hypoxic regions, the percentage of pimonidazole-positive cells to a whole solid tumor was quantified with NIH Image 1.63 software. Results are the mean of three to four tumors from independent tumor-bearing mice ± SD for each group. *p < .01. (C) Buffer-treated (a–f) and TOP3-treated (g–o) CFPAC-1 xenografts were surgically excised at the indicated times after the treatments, and serial sections were stained with anti-pimonidazole antibody (a, d, g, j, and m), HE (c, f, i, l, and o), or secondary antibody only as a negative control (NC; b, e, h, k, and n). Three to four tumors from independent tumor-bearing mice were examined for each treatment group and representative tumor sections are shown. Bar = 1 mm. The areas squared in f and o are applied to Figure 6A–C and Figure 6D–6F, respectively.
Discussion
Recent progress in optical imaging in vivo provides us with various information such as neoplastic cell growth [30], molecular localization [32], enzymatic reaction [33], and protein–protein interactions [34] in living animals. It also contributes towards collecting internal information without the sacrifice of animals. All of the results presented here demonstrate that the optical imaging method using 5HRE-luciferase reporter gene enables us to efficiently and easily monitor tumor hypoxia, where HIF-1 is active in living animals, and precisely evaluate the efficacy of anti-cancer therapies on tumor hypoxia.
HIF-1-dependent promoter has been used to monitor hypoxic status in tumors [20,21,35]. Their reporters were fluorescent proteins. Because permeability of bioluminescence in living animals is much better than fluorescence, a luciferase reporter system allowed sensitive, quantitative, real-time spatio-temporal analyses of the dynamics of neoplastic cell growth [30]. Because the quantitation of total photons from xenografts, in which tumor cells express luciferase gene under a constitutively active promoter, is an indicator of tumor burden [30], progressive tumor growth or regression could be monitored by repeated analyses of HeLa/EF-Luc xenografts at serial time points (Figure 4A and C, tumors in left legs). On the other hand, because the quantitation of total photons from HeLa/5HRE-Luc xenografts is an indicator of tumor hypoxia, qualitative information (hypoxic status) of solid tumors could be obtained by this model system (Figure 4B and C, tumors in right legs). When the growths of HeLa/EF-Luc and HeLa/5HRE-Luc xenografts were assessed with caliper, they were equally suppressed with TOP3 treatment in vivo (data not shown), indicating that both xenografts showed equal sensitivity to TOP3 treatment. These results further strengthen the argument that the decrease in photon counts from TOP3-treated HeLa/5HRE-Luc would reflect the decrease of tumor hypoxia in the xenografts (Figure 4B and C).
Statistical Analysis of TGDT

TGDT was calculated as the mean of the days on which relative tumor mass of each tumor reached to two fold of the one on Day 0. Data were based on the results obtained by using HeLa/5HRE-Luc cells (n = 5) and CFPAC-1 cells (n = 6) in Figures 4A and 5A, respectively.
p < .05 (vs. buffer).
According to the previous report, the HIF-1 a small interfering (si) RNA, but not the HIF-2α siRNA, sup-presses hypoxia-dependent VEGF promoter activity in HeLa cells [36]. This suggests that the HRE from the VEGF promoter is exclusively dependent on HIF-1 activity in HeLa cells. Moreover, Western blot analysis confirmed that the up-regulation of luciferase activity was accompanied with the stabilization of HIF-1α protein in HeLa/5HRE-Luc cells (Figure 1). Because HIF-1 activity is closely associated with tumor hypoxia [37] and the HIF-1–induced expression of luciferase corresponds with hypoxic region in HeLa/5HRE-Luc xenografts (Figure 2A), bioluminescence from the xenografts should reflect the existence of tumor hypoxia where HIF-1 is active.

Effect of TOP3 on hypoxic/HIF-1–expressing cells in xenograft. The areas squared in Figure 5Cf and Co are magnified and shown in A–C and D–F, respectively. Buffer-treated (A–C) and TOP3-treated (D–H) CFPAC-1 xenografts were stained with RE (C and F), anti-pimonidazole antibody (A and D) and without primary antibody as a negative control (NC; B and E). Bar = 100 μm. Arrow = empty spaces between viable region and necrotic region.
The immunohistochemical analysis using anti-luciferase antibody and anti-pimonidazole antibody indicated that the locations of the luciferase-expressing cells and the pimonidazole-positive cells were very similar. Both of them were located at the boundary areas between viable cells and necrotic regions (Figure 2A). However, their content and intensity were slightly different. The areas where luciferase was expressed were significantly wider than the ones where pimonidazole-positive cells were located. Because the oxygen concentration decreases as the distance from the blood vessels increases, HIF-1α stabilization may have occurred under milder hypoxic conditions than the binding of pimonidazole compounds with thiol groups in proteins, which occurs in less than 10 mmHg [38] (www.radonc.unc.edu/pimo/main.htm). Although oxygen-dependent regulation is the major regulation for HIF-1α expression, we must consider that HIF-1 expression is also affected by oxygen-independent regulation [39,40], and pimonidazole reactivity is absolutely oxygen-dependent [31,38]. Because HIF-1 activity is closely associated with malignant progression [5,16], monitoring HIF-1 activity in solid tumors is crucial for cancer therapy.
Because TOP3 stability is regulated by the same oxygen-dependent mechanism as HIF-1α protein through common ODD domain, both TOP3 and HIF-1α must be stabilized in the same hypoxic tumor cells in vivo as well as in vitro. Therefore, TOP3 is expected to target HIF-1α-expressing hypoxic tumor cells, leading to shutting off the HIF-1-induced gene expression. In accordance with this expectation, the disappearance of pimonidazole-positive cells from TOP3–treated tumor sections (Figures 5B,C, 6D, and 7E) and the existence of empty spaces between viable and necrotic regions in the TOP3-treated tumor sections (Figure 6D–F) strongly suggests the elimination of hypoxic/HIF-1-expressing cells after TOP3 treatment. Although the disappearance of these areas may be a consequence of the removal of fragile apoptotic cells from the section during the staining process, TOP3-targeted cells must be removed in vivo because the total tumor mass and the photon counts of HeLa/5HRE-Luc xenografts were significantly reduced after TOP3 administration (Figure 4B and C). Although the precise mechanism underlying the removal of hypoxic tumor cells by TOP3 in vivo has not been investigated, it is likely that such cells initially undergo apoptosis, as shown in vitro [23] and in vivo (Figure 7), and that they might be removed by macrophages attracted by the caspase-3-induced “eat-me signal” [41].

Apoptosis of hypoxic/HIF-1-expressing cells in TOP3-treated tumor xenograft. CFPAC-1 xenografts excised at 12 hr after either buffer (A–C) or TOP3 (D–F) administration were stained for TUNEL (A and D). Serial tumor sections were stained with anti-pimonidazole antibody (B and E) and RE (C and F). Three tumors were examined for each treatment group and representative tumor sections are shown. Bar = 1 mm.
TOP3 did not influence luciferase–luciferin reaction in vitro (data not shown). The bioluminescent signals from HeLa/EF-Luc were not so significantly decreased as the one from the HeLa/5HRE-Luc xenografts of TOP3-treated mice (Figure 4C). These results indicate that the significant decrease of the bioluminescent signals from HeLa/5HRE-Luc xenografts of TOP3-treated mice was not simply due to interference of TOP3 in luciferase–luciferin reaction in vivo. Low oxygen concentration influences the luciferin reaction, and thus, we cannot simply compare the bioluminescent signals from HeLa/EF-Luc xenografts with the one from HeLa/5HRE-Luc xenografts. However, as long as monitoring the same HeLa/5HRE-Luc xenografts, the change in the bioluminescent intensity should reflect the amount of hypoxic tumor cells.
The first TOP3 administration caused the most significant reduction in HIF-1 activity on Day 3 (Figure 4B and C). Because HeLa/5HRE-Luc cells had little luciferase activity under aerobic conditions in vitro (Figure 1A), the photon counts detected in the TOP3-treated xenografts on Day 3 may have been background (Figure 4B and Ce). If so, almost all HIF-1-expressing cells were removed as the results of the first administration. The sequential administration with TOP3 in 5-day intervals resulted in remarkable suppression of the increase in the bioluminescence from HeLa/5HRE-Luc xenografts. The relative photon counts from buffer-treated HeLa/5HRE-Luc tumors reached 22-fold, whereas the ones from TOP3-treated tumors were still suppressed on Day 15 (Figure 4B and C). All of these results strongly suggest that the optical imaging of HIF-1 activity by a luciferase reporter system can contribute to the screening and the development of HIF-1-targeting drugs and the convenient evaluation of the efficacy of anti-cancer therapy on tumor hypoxia.
In optical imaging, there was a time lag between the decrease in the photon counts and the elimination of the pimonidazole-positive cells after TOP3 treatment (Figures 4A–C, 5B and C). Concretely, after the first TOP3 administration on Day 0, the tumor became the smallest on Day 2 (Figure 4A) and the pimonidazole-positive cells decreased within 2 days (48 hr; Figure 5B and C), whereas relative photon counts became the lowest on Day 3 (Figure 4B and C). Although luciferase expression is initiated by a hypoxic stimulus, luciferase activity remains even after the surrounding conditions change to aerobic until the protein is degraded. Hence, monitoring the HIF-1 activity as a luciferase activity may not be always punctual. Therefore, it is necessary to further improve the reporter system to realize real-time imaging.
Footnotes
Acknowledgments
We thank Dr. S. Kimura (Kyoto University, Kyoto, Japan) and S. Watanabe (SC BioScience) for IVIS technical support; N. Murakami-Harada, E. Nishimoto, and A. Morinibu for skilled technical assistance. This work was supported by research grants from the Ministry of Education, Science, Sports, and Culture of Japan and Kyoto City Collaboration of Regional Entities for the Advancement of Technological Excellence, JST.