
Abstract
Bioluminescence imaging (BLI) is a highly sensitive tool for visualizing tumors, neoplastic development, metastatic spread, and response to therapy. Although BLI has engendered much excitement due to its apparent simplicity and ease of implementation, few rigorous studies have been presented to validate the measurements. Here, we characterize the nature of bioluminescence output from mice bearing subcutaneous luciferase-expressing tumors over a 4-week period. Following intraperitoneal or direct intratumoral administration of luciferin substrate, there was a highly dynamic kinetic profile of light emission. Although bioluminescence was subject to variability, strong correlations (r > .8, p < .001) between caliper measured tumor volumes and peak light signal, area under light signal curve and light emission at specific time points were determined. Moreover, the profile of tumor growth, as monitored with bioluminescence, closely resembled that for caliper measurements. The study shows that despite the dynamic and variable nature of bioluminescence, where appropriate experimental precautions are taken, single time point BLI may be useful for noninvasive, high-throughput, quantitative assessment of tumor burden.
Introduction
Bioluminescence imaging (BLI) is being rapidly adopted in cancer research [1]. The high sensitivity of bioluminescence technology permits the study of subtle biological events, particularly those related to oncology such as early tumor development, metastases, residual disease, and tumor recurrence [2–5]. Moreover, minimal invasiveness allows repeated visualization of intrinsic tumor development.
Typically, tumor cells expressing luciferase from Photinus pyralis (firefly) are implanted subcutaneously in mice and subsequent growth is assessed over a period of days to weeks using BLI. Tumor burden is assessed by systemic administration of luciferin and a single bioluminescence image is acquired either at a stated time or within a range of times. As image acquisition times are short, such procedures can be completed in a high-throughput manner; however, little has been reported about the temporal nature of bioluminescence, the relationship between bioluminescence and tumor development, and the validity of bioluminescence as a high-throughput modality. Several investigations report a strong relationship between number of cells and bioluminescent intensity in culture [3,6,7]. Some investigations have examined increase in signal with tumor growth following implantation, but only few reports have provided independent measures of developing tumor volume [4,8]. Two recent reports have described the temporal dynamics in bioluminescence from tumors following luciferin infusion [6,9]. However, use of BLI as a quantitative tool remains to be thoroughly tested [1,10,11].
Here, we characterize the nature of bioluminescence from luciferase expressing tumors and evaluate the efficacy of the technology as a quantitative means for assessing tumor burden. Our findings establish that appropriate experimental design permits BLI to be used for high-throughput, quantitative assessment of tumor progression.
Materials and Methods
Cell Line
A luciferase expressing human cervical carcinoma cell line HeLa X1/5 was obtained from the European Collection of Cell Cultures (95051229). The cell line (HeLa-Luc) is stably transfected with a P. pyralis luciferase gene controlled by a tetracycline-off dependent-cytomegalovirus promoter [12]. In these studies, no tetracycline was applied and thus the gene was expressed constitutively. Cells were propagated and maintained in Dulbeco's Modified Eagle Medium (DMEM) containing 4 g/L glucose, 10% fetal bovine serum (Atlanta Biologicals, Norcross, GA), 4 mM
Murine Xenografts
All animal procedures were performed in accordance with the University of Texas Southwestern Medical Center Institutional Animal Care and Use Committee. Athymic nu/nu mice (~25 g) were obtained from Harlan (Indianapolis, IN). Mice were caged in groups of five in pathogen-free facilities. Subcutaneous tumors were established to study the relationship between bioluminescence and physical measures of tumors. Cells were harvested and washed twice with PBS, counted and resuspended in PBS at a concentration of 2 × 10⁷/mL. Mice were anesthetized with Avertin 240 mg/kg, ip (Sigma) and subcutaneous injections of either 50 or 100 μL (1 or 2 × 10 cells) were administered over the left flank to allow study of tumors across a range of sizes. Tumor axes were measured with digital calipers and volume calculated as (a2b)/2, where a < b [13]. BLI was performed on 10 mice at various times from Day 4 to Day 31 postimplantation, at which time animals were euthanized with CO2 overdose.
Bioluminescence Imaging
A solution was prepared of

Bioluminescence from mice bearing HeLa-Luc xenograft tumors is highly dynamic following intraperitoneal administration of luciferin. A baseline light photograph was taken under illumination, after which the chamber was closed. Externally monitored bioluminescence light signal is depicted as pseudocolor images overlaying the light photograph of the animal. Panels represent an experiment of serial 2-min images collected at 3-min intervals over a 1-hr period beginning 4 min after luciferin administration (alternate pictures are shown). Relative photon counts per pixel are depicted on the scale to the right.
Imaging followed a single injection of luciferin on each occasion. Immediately following administration of luciferin, animals were placed on a warming pad in the imaging box and sedated with a veterinary anesthesia system providing 3% isoflurane (induction dose; IsoFlo, Abbott Laboratories) with 1 L/min oxygen to a nose cone placed over the face and oriented so that the tumor located on the flank was well within the image area. Animals were maintained under anesthesia at 1.5% isoflurane and 1 L/mm oxygen. A 0.5-sec light image of the animal was taken and stored for future image overlay. The light-tight box was then closed, and a series of 2-min exposure images were collected at 3-min intervals beginning 4 min following substrate administration. Throughout this work, imaging times refer to the time at which integration of bioluminescence was initiated. For the primary investigations, a single dose of luciferin was administered intraperitoneally (68 investigations on 10 mice over 31 days with up to 9 repeat measurements). For statistical analysis, tumor measurements were divided into two groups based on median volume: Small tumors <212 mm3 and large tumors >212 mm3. In some cases, additional subsequent doses were administered after completion of the first dynamic curve and on occasion the subsequent doses were increased (450 mg/kg using a solution of 51 mg/mL to maintain constant injection volume). Tests were also performed with direct intratumoral injection of luciferin solution (40 μL, 17 mg/mL). The imaging system was built by the Advanced Radiological Sciences Division of the Department of Radiology at the University of Texas Southwestern. The image sensor, a black and white frame transfer charge-coupled device (CCD; Texas Instruments TC245, Dallas, TX) with an image area of 786 (H) by 488 (V) pixels, produced an internally binned image of 252 (H) by 242 (V) pixels. An external cooling system provided 0°C coolant and a two-stage Peltier element maintained the CCD at approximately −20°C to minimize the dark current. The images were captured on a personal computer for further image processing. Images were processed using the IGOR Pro, V 4.0.6.1 (Wavemetrics, Lake Oswego, OR) data analysis program utilizing custom generated procedures, macros and functions to allow semiautomatic generation of images and integration of light image signals. Photon emission was normalized to relative light units per min (rlu/min). Regression analysis and calculation of area under the curve (AUC) were performed with Sigma Plot 6.00 (SPSS, Chicago, IL).
Results
Temporal Dynamics of Light Emission
Serial imaging of subcutaneous HeLa-Luc xenograft tumors revealed a highly dynamic signal over time following luciferin administration (Figure 1). A rapid increase in photon counts to a peak signal was generally observed with a slower decay of light emission (Figure 2). The average time-to-peak signal was 12.7 ± 0.6 (SEM) min (n = 68). The median time to peak was 10 min with a range from 7 to 31 min. Time to peak was not dependent on tumor size.
To determine the reproducibility of output, tumor-bearing mice were given consecutive luciferin injections at 0, 60, and 120 min. Variability in the profile and magnitude of light emission was observed (Figure 3). To determine if this variability was due to the duration of anesthesia and/or the persistence of residual levels of substrate in the animals prior to subsequent administrations, mice were subsequently imaged for 1-hr periods on each of three consecutive days. Variability in light emission was also observed in these experiments (Figure 3). Although small changes in tumor volume occurred over this time, the variance in output profile and magnitude was independent of such changes. Thus, the magnitude of bioluminescence varied with consecutive substrate treatment on the same day and with single treatments over consecutive days.

Timecourse of BLI signal intensity from mice bearing HeLa-Luc xenograft tumors. Left: Graphical representation of mean light signal over imaging time for animals bearing small tumors [<212 mm3 (white circles; n = 34)] and large tumors [>212 mm3 (dark circles; n = 34)]. 212 mm3 was the median tumor size over the whole study. Luciferin was administered at time 0 and light signal was integrated over 2-min periods at 3-min intervals for 1 hr. The difference in magnitude of bioluminescence between tumors of varying size is time dependent, as depicted by the shaded area between curves on the left and separately on the plot to the right.
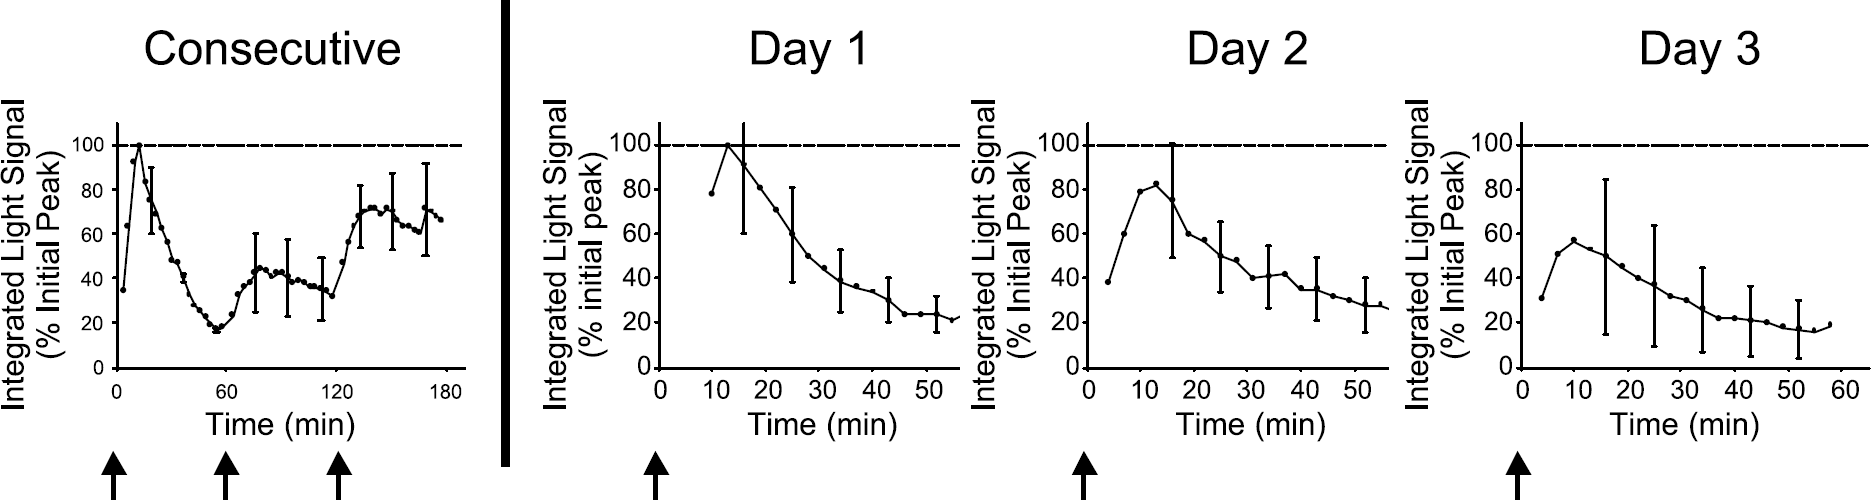
Average integrated light signal collected over 2-min periods at 3-min intervals from four independent experiments. Data presented to the left of the division are from experiments involving consecutive administration of substrate on the same day at 0, 60, and 120 min and are expressed relative to the initial peak light signal. Arrows represent times at which luciferin was injected. Data to the right represent experiments performed on animals over three consecutive days of imaging, where luciferin was administered at time 0 on each day. Mean values with error bars (SEM) are expressed relative to the peak signal observed on the first of the three days.
Subsaturating Delivery of Substrate
Published reports indicate that substrate dosages in the range used here represent excess relative to enzymatic activity [10,14,15]. The observed variability in light emission following repeated injections of luciferin prompted attempts to ascertain what biological information was reflected in the bioluminescence signal. After acquiring light signal for 1 hr following the standard intraperitoneal procedure, a solution of luciferin was injected directly into the tumors. These experiments revealed that light emission with intratumoral delivery of luciferin was substantially higher than that following intraperitoneal administration (Figure 4) indicating that tumor cells are not saturated with substrate following systemic treatment. Although volume limitations permitted direct injection doses of only 15–20% of systemic treatment, light emission following intratumoral injection was at least twofold greater than that following systemic delivery.
Tumor-bearing mice were tested with both the standard 150 mg/kg dose or with a higher 450 mg/kg dose of luciferin administered intraperitoneally on consecutive days. Consistent with results from the above studies, high-dose luciferin treatment resulted in a greater magnitude of light emission than that of the standard protocol (Figure 5).
Relationship Between Tumor Size and Bioluminescence
In order to study the relationship between tumor volume and bioluminescence, subcutaneous tumors were established to allow caliper measures to be obtained. Use of BLI as a quantitative tool for assessing tumor burden requires a reliable association between tumor size and light signal. Reliability was tested using multiple regression analyses between tumor volume and peak light emission, area under the light signal curve and light signal at selected time points (Figure 6 and Table 1). Peak signal and area under the light emission curve yielded strong associations with caliper-assessed tumor volumes. Further, the profile of tumor growth over time as assessed by bioluminescence closely resembled that as assessed by caliper measurement (Figure 7). In a subset of the tumors (n = 5), we verified a relationship between tumor mass and caliper-assessed tumor volume at time of sacrifice (r2 > .97).

Systemic administration of luciferin results in submaximal light signal. Light emission following intraperitoneal injection of substrate at time 0 (single arrow) followed by intratumoral injection of luciferin at 60 min (double arrow). Data are means of four individual experiments with representative error bars (SEM).

Systemic administration of luciferin results in a dose-dependent magnitude of light emission. Luciferin was given at the standard dose of 150 mg/kg, ip (open circles). The following day a dose of 450 mg/kg, ip (closed circles), was administered. Data were normalized to relative light units per minute and are expressed as percent of the peak observed for standard dose (baseline) experiments. Data are means of three independent experiments with representative error bars (SEM).

Relationship between bioluminescence output and caliper measured tumor volumes. Regression analyses were performed between caliper-measured tumor volume and peak light signal, AUC, and light signal 10 min following luciferin treatment. Sixty-eight individual experiments are shown. Dotted lines indicate 95% confidence intervals. All regression analyses were statistically significant at the level of p < .0001.
Relationship between Tumor Volume and BLI Output

AUC denotes area under the light signal curve. “< Median” refers to data collected for tumors less than the median tumor size in the present study (212 mm3) and “> Median” refers to those greater than the median tumor size. All correlations are at the level p < .0001.
Figure 2 compares the mean kinetic bioluminescent profiles of tumors less than (small) or greater than (large) the median tumor size of 212 mm3. The shaded area between these curves, also plotted on the graph to the right, represents the difference in magnitude of light emission, which was found to be greatest close to the time of peak light emission (12.7 min), indicating that this is the most suitable time to make measurements. This observation is confirmed by Table 1, where the strongest correlation between tumor volume and signal intensity occurred for the images acquired 10–13 min after administration of luciferin.
Discussion
Although BLI is currently a 2-D representation of a 3-D tumor, and the signal intensity shows variations following administration of luciferin, we have found strong correlations between the measures of bioluminescent parameters and tumor volume. Specifically, the area under the bioluminescent light curve, the maximum intensity across the curve, or the intensity measured at various times between 10 and 20 min show correlations in excess of .8 with tumor size. Further, each of the bioluminescent parameters was very strongly correlated with the others (r > .9).
Others previously investigated correlations between bioluminescent parameters and numbers of cells in cell culture, and found very strong correlations [3,6,7]. In some cases, correlations have also been determined in vivo [4,8]. This was particularly important in a study comparing MRI measurements with light emission from an orthotopic brain tumor, where traditional caliper access is not feasible [8]. Another study showed a strong correlation between excised tumor weight and bioluminescent intensity [4]. Other reports have shown increases in light intensity accompanying putative tumor growth, for tumors stably transfected to express luciferase [1,3,5,10,15,16].
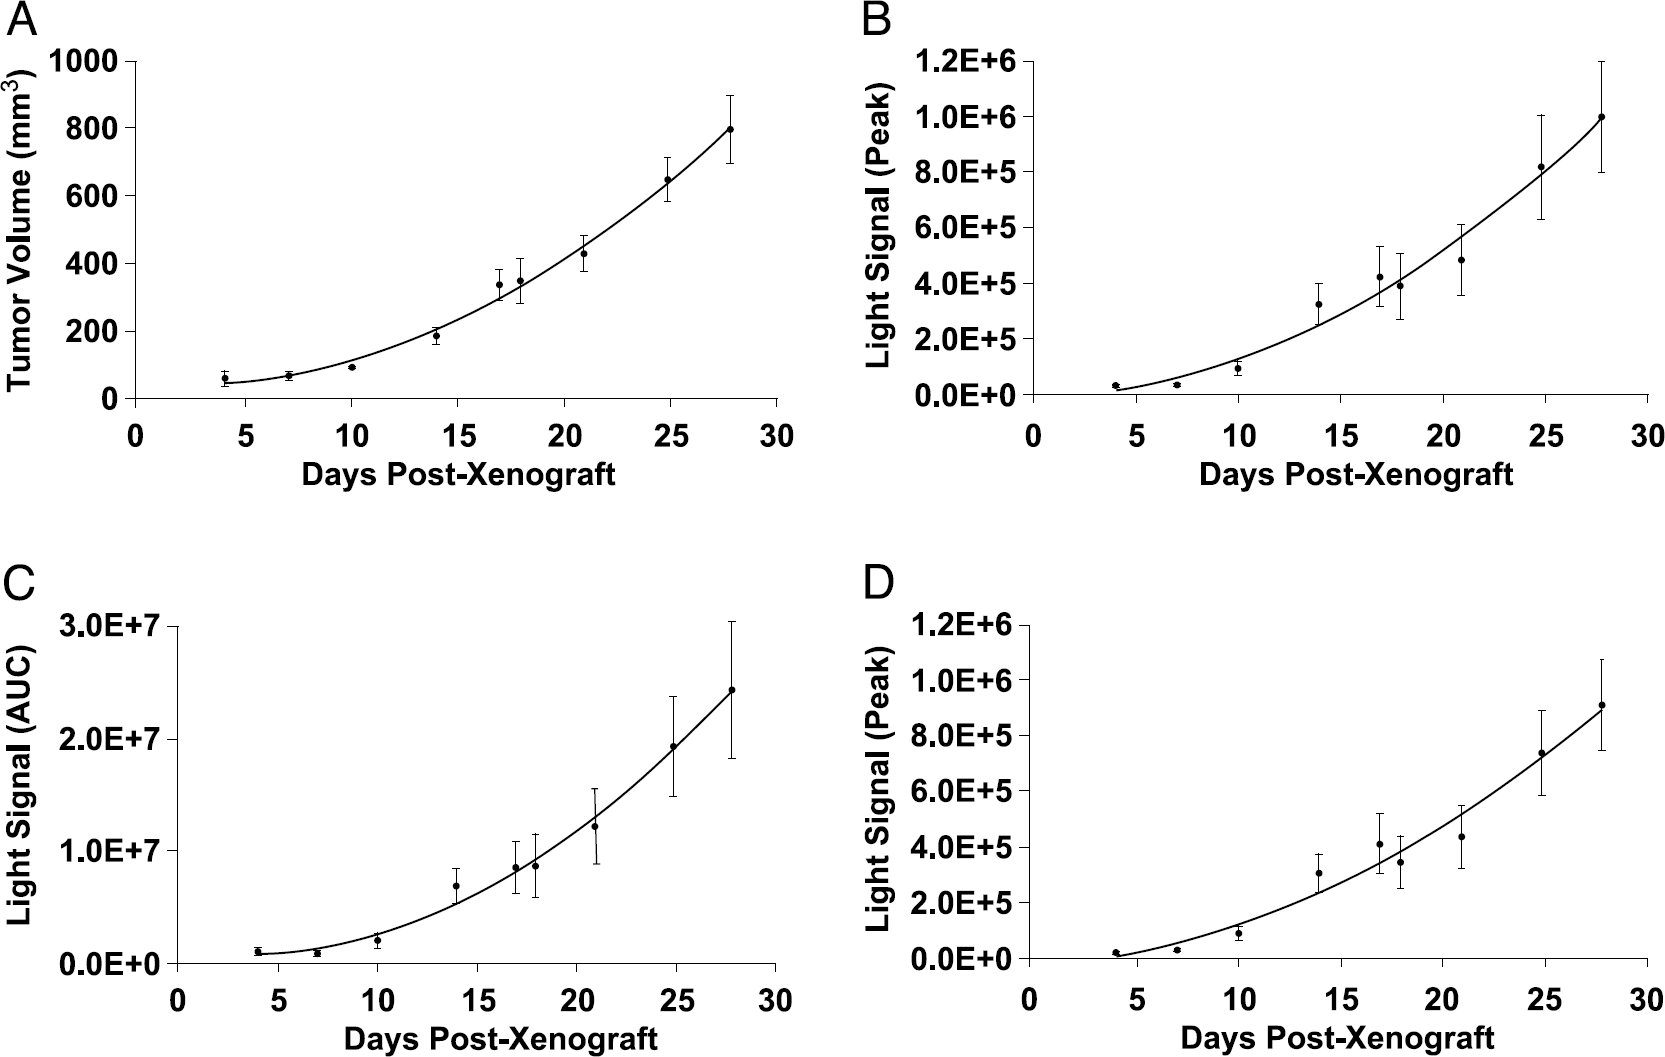
Relative tumor growth can be monitored by BLI. Comparison of caliper assessed (a) tumor volume, (b) peak light signal, (c) area under the light signal curve (AUC), and (d) light signal 10 min after luciferin administration with respect to tumor growth. Data are means ± SE from the group of tumors that were imaged on the same days over the duration of the study.
However, to date, there have been relatively few studies comparing the time-dependent kinetics of light intensity following luciferin administration or the variations with tumor growth [6,9]. The investigations here show that peak light intensity is achieved 10 to 12 min after intraperitoneal infusion of luciferin. Light intensity increases very rapidly during the first 10 min, but is still detectable after 1 hr. We selected a standard concentration of 150 mg/kg of luciferin based on literature reports that typically use a range of 100 to 150 mg/kg. However, Figure 5 clearly shows that the administration of higher doses of luciferin could give significantly higher light intensity. Even 450 mg/kg likely does not result in saturating levels of luciferin in the tumor. However, we found that a threefold increase in concentration was the maximum at which luciferin readily dissolved (i.e., 51 mg/mL). Here, we maintained a constant volume of injection, but a higher dose could be administered by simply increasing volume of injection. Although higher doses approaching saturating levels of substrate may increase light output further, the intensity profile will continue to exhibit dynamic variations due to the pharmacokinetics of delivery, unless a continuous infusion protocol is applied. Because luciferin appears to have minimal toxicity, higher doses could be appropriate, although they are substantially more expensive and may require larger volumes of administration. The relative optimal dose may depend on the site of implantation, since a recent study suggests significantly different accumulation and wash out of radiolabeled luciferin from various organs following intraperitoneal or intravenous administration [17].
An alternate approach would be direct injection into the tumors; again, intratumoral administration of luciferin in this study showed substantially higher signal intensity. However, the light intensities appeared less consistent, and the technique becomes invasive. Others have suggested that intravenous administration of luciferin can give elevated light intensity [6]. However, the strong correlations between light intensity and tumor volume detected in these studies based on intraperitoneal administration suggest that this is already a robust technique. Intratumoral administration of luciferin may come closer to achieving maximal light output, but the intratumoral approach lessens one of the greatest strengths of BLI, that of being noninvasive. Tumor size would also restrict injection volume. Most previous BLI studies of tumors have used only a small time window for data acquisition. This is important to facilitate high-throughput analysis of tumors; however, given the dynamic variation in the light intensity curve, there is a danger that the apparent signal may misrepresent the complete curve. However, our studies show that the association between tumor volume and area under a 1 hr light signal curve was comparable to that for maximum light intensity or single integration periods, indicating that abbreviated data acquisition can be used for reliable high-throughput analysis of tumor burden. It appears that data in the first 10 min would be less appropriate because of variable kinetics of onset of light emission, and images obtained much later have diminished light intensity.
The 95% confidence intervals (Figure 6) suggest that tumor volume may be estimated within 20% error, once the tumor volume exceeds ~100 mm3. However, it is clear that individual measurements may deviate form the curves by a factor of two. Indeed, Figure 3 shows 60% variability for consecutive measurements and 40% variation over 3 days. This emphasizes the importance of large cohorts of tumors to provide effective statistics. In this regard, the observation that 2-min images obtained 10 min after luciferin administration provide equivalent quality of data to the full curves (AUC) obtained over 60 min is very important. On rare occasions (<1 in 10), no light was detected following intraperitoneal luciferin administration. Such data are included in Figures 6 and 7, because removing them had negligible influence on the overall statistics, but would have introduced operator bias. In ongoing studies, we find that a repeat administration of luciferin following an unexpectedly low signal almost always produces a more reasonable signal, suggesting the deficiency may be due to failure of the intraperitoneal administration.
This study shows a correlation between BLI and tumor volume. It does of course, remain to be determined whether the light intensity remains proportional to tumor volume during therapy (e.g., a vascular targeting therapy could inhibit access to tumor regions). Further, with increasing tumor size, necrosis, hemorrhage, as well as a decrease in surface area to volume may result in a less predictable relationship between tumor volume and bioluminescence. In this study, we found minimal necrosis or hemorrhage. The HeLa-Luc cells incorporate a promoter, which may be turned off by tetracycline. This property was not used in this study, but may be useful in the future for exploring kinetics associated with promoter induction in vivo. Others have placed luciferase expression under control of many diverse elements [18] including response to p53 [6] and hypoxia [19].
In conclusion, we believe this study provides further evidence validating the use of BLI to investigate tumor growth. This will be particularly important for tumors that are less readily accessible to measurement by calipers, for example, orthotopic tumors in the brain or mediastinum. Despite the dynamic nature of bioluminescence, single time point BLI may be used for noninvasive, high-throughput, quantitative assessment of tumor burden.
Footnotes
Acknowledgments
We thank Trung Nguyen, Billy Smith, and Drs. Shreefal Mehta and Matthew Lewis for support with development of the CCD camera and related technical issues. We thank Dr. Anca Constantinescu for providing assistance with tumor xenografts. This research was supported by NIH grants to DRC (GM-60624, CA-85363) and RPM (P20 CA-86345).