
Abstract
We have designed, constructed, and tested a thermoacoustic computed tomography (TCT) scanner for imaging optical absorption in small animals in three dimensions. The device utilizes pulsed laser irradiation (680–1064 nm) and a unique, 128-element transducer array. We quantified the isotropic spatial resolution of this scanner to be 0.35 mm. We describe a dual-wavelength subtraction technique for isolating optical dyes with TCT. Phantom experiments demonstrate that we can detect 5 fmol of a near-infrared dye (indocyanine green, ICG) in a 1-ML volume using dual-wavelength subtraction. Initial TCT imaging in phantoms and in two sacrificed mice suggests that three-dimensional, optical absorption patterns in small animals can be detected with an order of magnitude better spatial resolution and an order of magnitude better low-contrast detectability in small animals when compared to fluorescence imaging or diffusion optical tomography.
Introduction
Over the past decade, there has been a growing interest in small animal imaging in medical research. In 1999, over 90% of research into mammalian models of human disease involved small animals, especially mice [1]. Nuclear medicine techniques have played a preeminent role in small animal imaging, but optical imaging techniques are increasingly being used to track the distribution of molecular probes engineered to accumulate in targeted tissues [2]. In this regard, fluorescence techniques are most commonly used [3,4]. Multispectral, optical imaging techniques have also been proposed for characterizing endogenous tissues on the basis of their spectral absorption properties [5,6].
There are two predominant optical imaging techniques in use today for imaging mice—fluorescence imaging and diffusion optical tomography (DOT). Fluorescence imaging is performed in conjunction with intravenous administration of a molecular probe, which is “tagged” with a fluorescing dye. Fluorescence emission from the dye is stimulated by irradiating the mouse with laser light at a wavelength that stimulates maximum broadband fluorescence, which occurs at longer wavelengths than the stimulating light. Optical filters are used to isolate the fluorescing light from the stimulating laser light. Fluorescence images are usually acquired using a CCD camera focused on the skin surface of the animal. Figure 1 plots the absorption and fluorescence emission spectra for Cy7, a typical near-infrared dye (Amersham Biosciences, Piscataway, NJ).
Fluorescence imaging performed in this way has been shown to detect 250 pmol (5.0 μM × 50 μL) of Cy5.5 dye in mouse imaging experiments [7]. Such detection sensitivity, however, is confined to tissue that lies close to the skin surface. The fluorescence from deeper lying tissue is rapidly attenuated through absorption and scattering of the fluorescing light. More importantly, optical scatter rapidly degrades the spatial resolution as the depth of the tissue increases. For these reasons, conventional fluorescence imaging techniques are limited to imaging tissue near the skin surface and are not suitable for accessing information from tissues or organs within the body.
DOT techniques have been developed over the past decade for extracting three-dimensional maps of optical absorption and scatter [8]–[11]. In its most common implementation, an array of frequency-modulated light sources and detectors are placed around the periphery of the object being imaged. Transmitted light signals are detected and processed using a variety of iterative techniques to reconstruct the underlying absorption and scattering properties of the tissue on a point-by-point basis. The spatial resolution that can be achieved is limited by light scatter to approximately 10% of the diameter of the object being imaged, and the accuracy of the technique is further limited by the accuracy of the a priori assumptions that are often incorporated into the reconstruction processes. Recently, a hybrid magnetic resonance imaging (MRI)/DOT technique has been described for imaging the brain of a Sprague-Dawley rat [12].

Absorbance (left) and fluorescence emission spectra (right) of unconjugated Cy7 dye in phosphate-buffered saline.
Other researchers have developed fluorescence-mediated tomography (FMT), which combines DOT and fluorescence imaging techniques to extract three-dimensional maps of fluorescence emission [13]. The data collection is performed in a manner analogous to DOT, except that the wavelength of the laser light is chosen to cause maximal fluorescence from a dye-labeled molecular probe that has previously been injected into the animal. Light transmission and emission measurements are then captured at both the stimulating and fluorescence emission wavelengths. The ratios of fluorescence emission to stimulating light transmission are computed at each detector location, which are then used to reconstruct a map of the dye concentration on a point-by-point basis. The spatial resolution and the sensitivity of the technique to Cy5.5 dye have been reported to be 2 mm and 100 fmol (1 nM × 100 μL), respectively, in tissue-mimicking phantoms. More recently, FMT has been used successfully to image an implanted tumor in a nude mouse [14].
The foregoing optical imaging methodologies share one commonality: Optical scatter degrades their spatial resolution significantly as the penetration depth increases. The scatter-induced limitations to spatial resolution that plague all purely optical imaging approaches can be mitigated in large part by resorting to thermoacoustic signal creation and analytic image reconstruction. Bowen et al. [15,16] first recognized the potential of inducing thermoacoustic signals in soft tissue. Such acoustic signals are produced whenever time-varying, electromagnetic energy is absorbed within the body. The energy itself can take many forms, for example, optical, infrared, radio waves, microwaves, or ionizing radiation. Over a decade later, Kruger et al. [17] and Oraevsky, et al. [18] confirmed the findings of Bowen et al. using optical radiation as the thermoacoustic source.
We reported a methodology for forming thermoacoustic computed tomography (TCT) images of tissue-mimicking phantoms using a Neodymium (3+)-doped Yttrium Aluminum Garnet (Nd:YAG) laser in 1995 [19]. In that work, we demonstrated that 2D “slice” images of optically absorbing objects embedded in turbid media could be formed using a Nd:YAG laser and a single focused transducer that was scanned in a circular arc. Oraevsky et al. [20]–[22] explored the use of small linear transducer arrays for making 2-D optoacoustic images of mammary tissue using a Nd:YAG laser. In 1999, we extended our methodology to three dimensions and introduced an efficient, filtered backprojection algorithm for reconstructing fully three-dimensional images, based on an approximate solution to the Radon transform [23]. Our subsequent work has focused on using these imaging principles to image radio wave absorption in vivo in the breast, where we have achieved 1–2 mm spatial resolution through as much as 10 cm of soft tissue [24]–[29].
In this article, we report the design and performance evaluation of a prototype TCT scanner specifically designed for performing optical imaging in small animals. We will describe details of the scanner design, data collection, and reconstruction algorithms. We will present estimates of the low-contrast sensitivity and spatial resolution that we can achieve in tissue-mimicking phantoms, and we will report the results of our first experience with imaging mice.
Materials and Methods
Theory
Consider a mass of soft tissue irradiated with a short pulse of radiation. Thermoacoustic waves are induced within the tissue wherever optical absorption takes place, the strength of which depends on the local absorbed energy within the tissue volume. Assume these waves are detected by an array of sonic detectors placed outside the body following some time delay. The excess pressure p

where A(
The object of TCT is to estimate the fractional optical absorption distribution A(
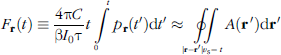
Under the condition that |
taking the second spatial derivative of each “projection,” F
backprojecting it; and
integrating over all projection directions.
Taking the second derivative of F

where
Scanner Design
A drawing of the prototype TCT small animal scanner is shown in Figure 2. The phantom or mouse is placed inside a thin-walled plastic tube (T), which is affixed to a computer-controlled rotary stage (R), and is immersed in the scan tank for imaging. Pulsed light (<10 ns, ˜ 25 mJ/pulse) from a Nd:YAG or a tunable OPO laser is delivered to the scan tank through a set of four fiber optic bundles (L1-L4), which are positioned around the outside of the scan tank as indicated. Their axial positioning is indicated in the “Top View” inset in Figure 2. The vertical positioning of the phantom/mouse was controlled by a linear stage (LS). Following each pulse of light, time-dependent thermoacoustic signals are detected by a 128-element transducer array (D), each signal of which is amplified and digitized at a rate of 20 MHz for a duration of 51.2 μs. These 128 time-dependent signals are stored in a data acquisition system, where multiple time traces can be averaged prior to being downloaded to the host PC via an IEEE 1394 interface.
The design of the transducer array is critical to the proper operation of the TCT scanner. The array, illustrated in Figure 3A, consists of 128 elements (1.8 × 2.0 mm) laid out on a cylindrical surface with a 40-mm radius of curvature. Each element has a peak response at 2.5 MHz. Note that there are a greater number of elements across the width of the array near its midpoint than there are as one proceeds from the midpoint to the ends of the array. This array pattern is designed so that the locus of detector locations approximates a uniform distribution over the surface of a sphere after the array has been rotated to 64 discrete positions, spanning 360° about the vertical axis. This pattern is illustrated in Figure 3B. Ideally, we need to fill in the entire spherical surface to properly reconstruct the three-dimensional distribution of optical absorbers within. The loss of detectors at either pole, which allows us to position the object to be imaged within the array, is expected to result in only a small loss of image quality compared to the ideal.

Drawing of prototype TCT small animal scanner showing water-filled scan tank, acoustic detector array (D), rotary stage (R), linear stage (LS) for vertical positioning, and a phantom/mouse constraining plastic tube (T). Light is delivered to the imaging tank via an array of four light guides as shown in the “Top View” inset. A heater element (H) is provided to heat the water in the tank to 38 °C.
Data Collection and Image Reconstruction
The following protocol was used for data collection. The laser was pulsed at a rate of 10 Hz. At each angle, thermoacoustic data were acquired for each of the 128 detector elements for a total of 16 consecutive pulses. These data were averaged to give 128 discrete time traces, which were then downloaded to the host PC. During the data-download period, the rotary stage was rotated to the next angle, and this data acquisition process was repeated for a total of 64 angles spanning 360° about the vertical axis. At the conclusion of data acquisition, which required 2 min, we had captured 8192 time-dependent pressure signals p
In practice, we do not measure p

where i

where I
Phantom Imaging Experiments
Spatial resolution. We measured the spatial resolution of the TCT small animal scanner by imaging an array of three human hairs (diameter = 25 μm), which we suspended within the thin-walled plastic tube. One hair lay approximately along the vertical axis of the scanner, and the other two were placed 6.25 mm to either side. Because the diameters of the hairs are significantly less than the expected spatial resolution of the scanner, the apparent diameters of the hairs in the TCT image give an accurate indication of the line spread function (LSF) of the imaging system at three spatial locations within the imaging volume.
Dual-wavelength imaging. We fabricated a tissue-mimicking, optically scattering phantom by molding a 25-mm-diameter cylinder consisting of 4% Agar and 6% Liposyn-20%™, which provided an effective scattering coefficient μs′ ≈ 8–10 cm−1. We then bored five, cylindrical, 3-mm-diameter channels parallel to the vertical axis, which we filled with materials with known absorption properties. One channel was placed near the center of the cylinder, and the other four were placed symmetrically about the central channel.

(A) Illustration of TCT detector and the pattern of the 128-element array. (B) Locus of detector locations after rotating the array to 64 discrete angles, spanning 360°. Angular coverage of the detector locations is approximately uniform over 3π steradians after scanning.
In one experiment, we wanted to demonstrate our ability to isolate an optical dye from absorption due to other absorbers in the phantom using a dual-wavelength subtraction technique. We first measured the spectral absorption of a 1.3-μM concentration of ADS 780 in methanol and a 0.005% solution of India ink in water using a Shimadzu UV-mini-1240 spectrophotometer. ADS 780 is a NIR dye, manufactured by American Dye Source (Quebec, Canada), with a peak molar extinction coefficient of ˜ 150,000 M−1 cm−1, and India ink consists of spectrally diffuse, absorbing particles suspended in solution. Their corresponding spectral absorption properties are plotted in Figure 4.
The idea behind dual-wavelength subtraction is to form two TCT images, one using an optical wavelength near peak absorption of the dye (775 nm) and a second image at a slightly higher wavelength where the dye contrast is low (825 nm). Because the spectral absorption of the dye varies so rapidly over this small change in wavelength, a subtraction image is expected to be most sensitive to the presence of the dye. The image contrast from other chromophores (like India ink), whose absorption varies slowly over this range, is expected to be suppressed significantly in the subtraction image.

Absorption spectra for 1.3 μM of ADS 780 dye (peaked curve) and 0.005% India ink.

Axial image of the three-hair phantom. Field of view is 25.6 mm.
We filled the central cylinder with a 1.3-μM solution of ADS 780 dye and the outer four cylinders with 0.005% India ink. Two TCT images were formed at 775 and 825 nm, respectively. A subtraction image was then formed to test the hypothesis that dual-wavelength subtraction could isolate dye contrast in the TCT difference image.
TCT response to indocyanine green (ICG). In a separate set of experiments, we wanted to measure the response of our imaging system to varying concentrations of ICG (Sigma Chemical, St. Louis, MO). For these experiments, we fabricated a second phantom consisting of the same scattering phantom, but with four 18-guage (1.14-mm ID) polyethylene tubes arrayed about the central axis on a diameter of 12.5 mm. In one experiment, we filled the four tubes with four concentrations of ICG dissolved in methanol: 5, 10, 20, and 40 nM. In a second experiment, we filled the four tubes with 80, 160, 320, and 640 nM. We formed dual-wavelength images for both experiments using 783 and 833 nm. The lower wavelength corresponded to the peak Molar extinction coefficient of ICG (˜ 250,000 M−1 cm−1). At each concentration, we recorded the differential TCT contrast and plotted the result as a function of ICG concentration.
Mouse Imaging
We next wanted to determine what qualitative image quality we could achieve in a mouse. To this end, we obtained two freshly sacrificed athymic nude mice on two different days. These mice were acquired from Indiana University Medical Center. The mice were sacrificed in accordance with procedures established by their Laboratory Animal Research Center and approved by the National Institutes of Health. We placed each mouse in the plastic imaging tube, in which it fit snugly, and immersed it in the TCT imaging tank for imaging. We imaged one mouse at 1064 nm and the other at 800 nm.
Results
Spatial Resolution
An axial image of the three-hair phantom is shown in Figure 5. We interpreted the cross-sectional image of each hair as the LSF of the TCT scanner at three spatial locations. A plot through the center of the three-hair phantom (Figure 6) shows the x component of the shapes of the three LSFs. We fit a two-dimensional Gaussian function to each of the three profiles, from which we estimated the spatial resolution from the standard deviations. We interpreted twice the standard deviations of these three Gaussians as estimates of our spatial resolution in the x and y directions at three locations in the imaging volume. The Gaussian fitting yielded 0.34 × 0.30, 0.30 × 0.30, and 0.34 × 0.30 mm for each of the three hairs, proceeding from left to right. The central LSF was symmetric, while those to either side displayed some asymmetry.
Dual-Wavelength Imaging
A cross-sectional image of the five-cylinder phantom taken at 775 nm is shown in Figure 7A. Note that the central cylinder, which contains the ADS 780 dye, displays similar contrast to the other four cylinders, which contained India ink. The image taken at 825 nm (Figure 7B) shows diminished contrast only in the cylinder containing the dye. The difference image (Figure 7C) only displays contrast within the dye-filled cylinder.

Plot of the profiles across the center of Figure 5 showing the x component of the LSF of the three hairs.

Three, cross-sectional TCT images of five 3-mm cylinders. The center cylinder has been filled with 1.3 μM of ADS 780 dye, while the other four cylinders have been filled with 0.005% India ink: (A) image at 775 nm; (B) image at 825 nm; and (C) difference image (A-B).
ICG Response
Axial images of the two ICG phantoms are shown in Figure 8. Images were reconstructed using 0. 1-mm voxels, and 11 contiguous slice images were averaged together to produce the final images. Figure 8A shows the appearance of 5-, 10-, 20-, and 40-nM concentrations of ICG. Figure 8B shows the appearance of 80, 160, 320 and 640 nM ICG. Each of the images has been normalized individually for display purposes. All eight concentrations of ICG can be visualized.
The mean TCT signals corresponding to 10 different 1-μL volumes, sampled at 10 different locations in the background of Figure 8A, were calculated. The mean and standard deviation of these measurements were 40 ± 10. The mean contrast of the 5-nM concentration of ICG was 107, which indicates that the SNR for the image of the 5-nM disc was ˜6 [(107–40)/10], consistent with its being barely perceptible.
The mean TCT contrast within each of the eight discs displayed in Figure 8A,B were plotted as a function of ICG concentration. Linear regression was then used to fit these data to a straight line. The result is shown in plotted in Figure 9. The linearity of the data is excellent over more than two orders of magnitude.

Axial images of ICG phantom using dual-wavelength subtraction (783–833 nm) at various concentrations: (A) 5, 10, 20, and 40 nM; (B) 80, 160, 320, and 640 nM.

Differential TCT contrast as a function of ICG concentration.

Four TCT “slice” images from a 3-D image of a sacrificed mouse at 1064 nm: (A) axial image through the brain; (B) sagittal image through the trachea (T); (C) axial image through the scapulae (S); (D) axial image through the upper thorax showing the heart (H) and an outline of the lungs (L).

Four TCT “slice” images from a 3-D image of a sacrificed mouse at 800 nm: (A) axial image through the brain showing the venous circulation; (B) sagittal image through the jugular vein (J) showing the jugular and branching veins that feed it; (C) coronal slice through the two kidneys (K) and liver (L); (D) coronal slice through the abdominal aorta (A).
Mouse Imaging
Four slices from the 3-D TCT image of the mouse that we made at 1064 nm are shown in Figure 10. In all cases, the field of view is 25.6 mm (0. 1-mm pixels). The brain (B) of the mouse is visualized in Figure 10A, while the trachea (T) is clearly identified in the sagittal slice shown in Figure 10B. At a lower level, the scapulae are clearly visualized (Figure 10C), and the heart (H) and the outline of the lungs (L) can be identified in Figure 10D.
Four slices from the 3-D TCT image of the second mouse made at 800 nm are shown in Figure 11. Again, the field of view is 25.6 mm (0.1-mm pixels). The first image shows the venous circulation in the head of the mouse (Figure 11A). The jugular (J) vein can be seen in cross-section (Figure 11A), and the sagittal slice (Figure 11B) shows a clearer view of the jugular and some of the branching veins that feed it. Two coronal slices reveal the two kidneys (K) and the liver (L) in Figure 11C, while the abdominal aorta (A) can be appreciated in Figure 11D.
Discussion
We have demonstrated that TCT can be used successfully to image optical absorption in a mouse using near-infrared radiation. The imaging strategy we have applied is identical to the one that we have used successfully in the past to image radio wave absorption in the human breast. Our motivation for using TCT to image optical absorption in small animals is to overcome the limitations to spatial resolution that optical scattering imposes on other optical imaging approaches for tissue located beneath the skin surface. This strategy appears to work.
The TCT scanner that we report here is capable of achieving spatial resolution of < 350 μm, which is to be compared with the 2-mm spatial resolution reported with other optical imaging approaches used in mice. This spatial resolution approaches the theoretical limit of 300 μm one would predict based on the spatial resolution limitation imposed by our 2.5-MHz acoustic detectors. The spatial resolution can be improved by going to a higher frequency detector array.
We have demonstrated that we can use a dual-wavelength strategy to isolate dye-labeled molecular probes in phantom experiments. We believe that this dual-wavelength approach can be applied in vivo in lieu of fluorescence techniques, which isolate fluorescing dyes by virtue of their Stokes' shift. An advantage our strategy offers over fluorescence detection is that while the quantum yield (QY) for fluorescence emission in the infrared tends to be low (<0.25), the efficiency of thermoacoustic signal production (1 – QY) tends to be high.
Our phantom studies suggest that we can detect ICG, an infrared dye with an extinction coefficient of 250,000 M−1 cm−1at 783 nm, at a concentration of 5 nM within a 1-μL volume [(1.14-mm-diameter tube) × (1.1-mm-thick slice)]. This corresponds to a limiting sensitivity of 5 fmol of dye, which is more than an order of magnitude lower than that reported for FMT [13]. Even higher sensitivity can be achieved through the use of more efficient acoustic detectors, higher power lasers, dyes with higher extinction coefficients, longer image acquisition times, or a combination thereof.
The images of the mice that we have made display excellent spatial and contrast resolution. It is especially interesting to note the drastic difference in the appearance of the mouse anatomy when imaged at 1064 nm compared to 800 nm. At 1064 nm, optical absorption is dominated by the presence of water; at 800 nm, water absorption is virtually nil, and hemoglobin in the blood dominates optical absorption [6]. If you compare Figures 10 and 11, you can readily appreciate this difference. For a more dramatic view of the mouse's vascular anatomy (Figure 11), visit www.optosonics.com/mousemip.mpg to view a 3-D, maximum intensity projection rendering of the data set from which Figure 11A,B was taken.
One final observation is that useful optical image information can be acquired with TCT even without the use of a molecular probe as is demonstrated by these preliminary mouse images. It is especially noteworthy that vascular anatomy can be isolated from nonvascular anatomy without the use of cardiovascular contrast agents as are used routinely in X-ray CT and MRI.
Footnotes
Acknowledgments
This work was supported in part by HHS grant CA65744.