
Abstract
Atypical nevi are the precursors and risk markers of melanoma. Apart from persistently monitoring these nevocytic lesions and resecting them at the earliest signs of clinical changes, there is as yet no systemic clinical treatment available to interfere with their progression to melanoma. To explore clinical treatments that might interfere with and possibly prevent atypical nevus progression, a previous study documented that 3 months systemic low-dose interferon-α (IFN-α) treatment of patients with a clinical history of melanoma and numerous atypical nevi, led to inactivation of the STAT1 and STAT3 transcription factors in atypical nevi. Based upon this finding, we initiated a second study to determine whether systemic low-dose IFN-α treatment also impairs the expression of upstream regulators and downstream targets of STAT1 and STAT3 in atypical nevi. Using cyanine dye-conjugated antibodies, fluorescence imaging analysis revealed expression of JAK2, JNK1, AKT1, NF-κB, and IFN-αβ receptor in benign and atypical nevi, and early- and advanced-stage melanomas. To determine possible changes in the level of expression of these molecules in atypical nevi, excised before and after 3 months of systemic low-dose IFN-α treatment, newly designed optical imaging software was used to quantitate the captured fluorescent hybridization signals on a cell-by-cell basis and across an entire nevus section. The results of this analysis did not provide evidence that systemic low-dose IFN-α treatment alters the level of expression of upstream regulators or downstream targets of STAT1 and STAT3.
Introduction
In approximately 40–60% of all cases, the sporadic and familial forms of melanoma develop in a stepwise fashion. To gain insights into molecular events that govern the progression of atypical nevi to melanoma, it is important to first determine which genes are expressed in the different cellular compartments comprising atypical nevi. A previous study [1] demonstrated that some of the genes, which are expressed at high levels in primary melanomas in the vertical growth phase (VGP melanoma) and in melanomas in the metastatic growth phase (MGP melanoma), are also expressed in atypical nevi. However, strongest expression of these genes, which include growth factors, growth factor receptors, and cell adhesion molecules, was not detected in cells comprising the epidermal-dermal junction where melanoma is thought to evolve [2], but in epidermal keratinocytes and dermal melanocytes [1].
We previously documented that the transcription factors STAT1 and STAT3 are constitutively activated in atypical nevi [3]. In the context of the same study, we also provided evidence that in atypical nevi, obtained from patients who underwent 3 months of systemic low-dose interferon-α (IFN-α) treatment, STAT1 and STAT3 had lost their ability to bind DNA, and as shown in the case of STAT3, that the protein had become dephosphorylated [3].
Upon association with a receptor, STATs become phosphorylated, either by an activated receptor or a receptor-associated Janus kinase (JAK) [4,5]. In addition to STAT tyrosine phosphorylation, serine phosphorylation through serine/threonine kinases, such as the mitogen activated protein kinase, c-Jun N-terminal kinase (JNK), affects STAT transcriptional activity [6]. Thus, we postulated that JAK2 and JNK might be two additional genes that, like STAT1/STAT3, may be impacted by systemic low-dose IFN-α treatment. In vitro, IFN-α/β, in addition to inducing STAT1 and STAT3, activates the nuclear transcription factor, NF-κB, a member of the Rel/NF-κB family of transcription factors [7]. IFN-α-mediated NF-κB activation has been shown to promote cell survival via STAT3 association with the IFN-α/β receptor (IFN-α/β-R), and subsequent activation of the phosphatidylinositol-3 kinase (PI-3K)/AKT pathway [8]. A recent report [9] provided evidence that the PI-3K/AKT signaling pathway can down-regulate STAT3 and c-Jun-dependent transcription, leading to increased cell surface expression of Fas receptor and Fas ligand (FasL)-mediated apoptosis. NF-κB activity also contributes to overexpression of the cytokine, interleukin-8 (IL-8) [10], and in MGP melanoma cells, down-regulation of constitutive NF-κB activation leads to inhibition of IL-8 production [11]. Given the interaction between IFN-α/β signaling and these molecules/pathways, we initiated a second study, asking whether systemic low-dose IFN-α treatment might also alter the expression of genes that are known upstream regulators and potential downstream targets of STAT1 and STAT3.
Using fluorochrome-conjugated antibodies to JAK2, JNK1, AKT1, IFN-α/β-R, NF-κB, IκB-α, phosphorylated-IαB-α, and IL-8, we present data obtained by fluorescence imaging analysis, which reveal strong expression of JAK2, JNK1, AKT1, IFN-α/β-R, and NF-κB in benign and atypical nevi, and early- and advanced-stage melanomas. To determine whether 3 months of systemic low-dose IFN-α treatment would alter expression of any of these proteins in melanoma precursor lesions, an optical imaging software program was designed to quantitate the level of protein expression in individual cells and entire tissue sections of atypical nevi, obtained from patients before and after IFN-α treatment. Unlike those previously documented in the case of STAT3 [3], the qualitative and quantitative fluorescence imaging analyses presented in this study did not provide evidence that systemic low-dose IFN-α treatment altered the level of expression of NF-αB or the other molecules that were found to be expressed in atypical nevi.
Materials and Methods
Tissue Collection and Histologic Analysis
Formalin-fixed/paraffin-embedded and snap-frozen specimens, representing benign and atypical nevi, and early- and advanced-stage melanomas, were obtained in compliance with approved clinical protocols (University of Pittsburgh Cancer Institute [UPCI] protocols 91-010 and 96-039; Institutional Review Board [IRB] protocols 950642 and 950497; and IRB protocol 020184).
Atypical nevi surgically resected from patients before and after 3 months of systemic low-dose IFN-α2a treatment, were obtained in compliance with UPCI protocol 96-043, IRB protocol 960915 as previously described [3]. The degree of architectural and cytologic atypia of each nevus [12] was determined by analysis of its formalin-fixed and paraffin-embedded parts. The snap-frozen part of each nevus specimen was labeled with a randomly selected numeral by an individual not involved in the research analyses. The research study was conducted in a blinded fashion until the qualitative and quantitative fluorescence imaging analyses were complete.
Atypical nevi and melanomas resected from patients, pre- and post-high-dose IFN-α2b treatment, were obtained in compliance with UPCI protocol 95-071, IRB protocol 960852. MGP melanoma-positive lymph nodes, excised from patients before and after 4 weeks of high-dose IFN-α2b treatment, were collected in compliance with UPCI protocol 00-008, IRB protocol 000759. Eight atypical nevi from two patients, obtained in compliance with UPCI protocol 95-071, IRB protocol 960852, and six MGP melanoma-positive lymph nodes, resected from three patients in compliance with UPCI protocol 00-008, IRB protocol 000759, were analyzed by fluorochrome antibody-based fluorescence imaging.
Fluorochrome Antibody Conjugation and Immunohistochemistry
Cyanine dye-based labeling kits (Amersham Pharmacia Biotech, Piscataway, NJ, USA) were used for antibody conjugation, and 5 μm snap-frozen nevus, melanoma, and lymph node tissue sections were probed with fluorochrome-conjugated antibodies as described [13]. To visualize nuclei, tissue sections were counterstained with fluorescent 4′,6-diamidino-2-phenylindole (DAPI) (Molecular Probes, Eugene, OR, USA). In the case of each nevus, melanoma, and MGP melanoma-positive lymph node, an adjacent tissue section was probed with the same primary antibody, using standard immunohistochemistry as previously described [1].
The primary antibodies (Santa Cruz Biotechnology, Santa Cruz, CA, USA) were rabbit anti-mouse JAK2, mouse anti-human JNK1, goat anti-human AKT1, rabbit anti-human IFN-α/β-R, rabbit anti-human NF-κB, rabbit anti-human IK,B-α, mouse anti-human phosphorylated IκB-α, and mouse anti-human IL-8.
Fluorescence Image Acquisition and Quantitative Image Analysis
Multicolor fluorescence images were acquired with a Nikon Eclipse TE300 inverted microscope, a 20 × Nikon S. Fluor 0.75 NA objective, a Hamamatsu CCD camera (ORCA-I), DAPI and Cy3, Cy5, or Cy7 excitation filters, and multidichroic and multi-emission filters suitable for the emission spectra of DAPI and the respective fluorochrome(s). An XY scanning stage (Prior Scientific, Rockland, MA, USA) and a Nikon RFA focus motor were used to log in the outer edges of each tissue section. A specially designed optical imaging software program (QED Imaging, Pittsburgh, PA) was used to acquire mosaic collage images of 3 × 3 to 10 × 10 adjacent dual or multicolor image tiles. Focus was computed throughout the collages by recording the logged-in edges of the tissue sections, and by interpolating for the other fields by fitting a three-dimensional (3-D) plane through the known focus positions. At each stage location, a dual- or multicolor fluorescence image was acquired by changing the excitation filter via a motorized filter slider. Using a “checker board” grid that captures rectangular tiles, user-defined areas in the fluorescent antibody-stained tissue sections, spanning the entire epidermis, epidermal-dermal junction, and part of the dermis, were imaged and recorded. To minimize potential variations with respect to background, detector noise, and/or uneven illumination, tissue sections obtained from the same patient were probed with a same batch of fluorochrome-conjugated antibody and imaged on the same day. Furthermore, serving as a control for possible autofluorescence, an adjacent tissue section of every nevus, melanoma, and MGP melanoma-positive lymph node specimen was incubated in phosphate-buffered saline (PBS) not containing fluorochrome-conjugated antibody(s), which showed little or no cell-based autofluorescence in the individual channels (data not shown).
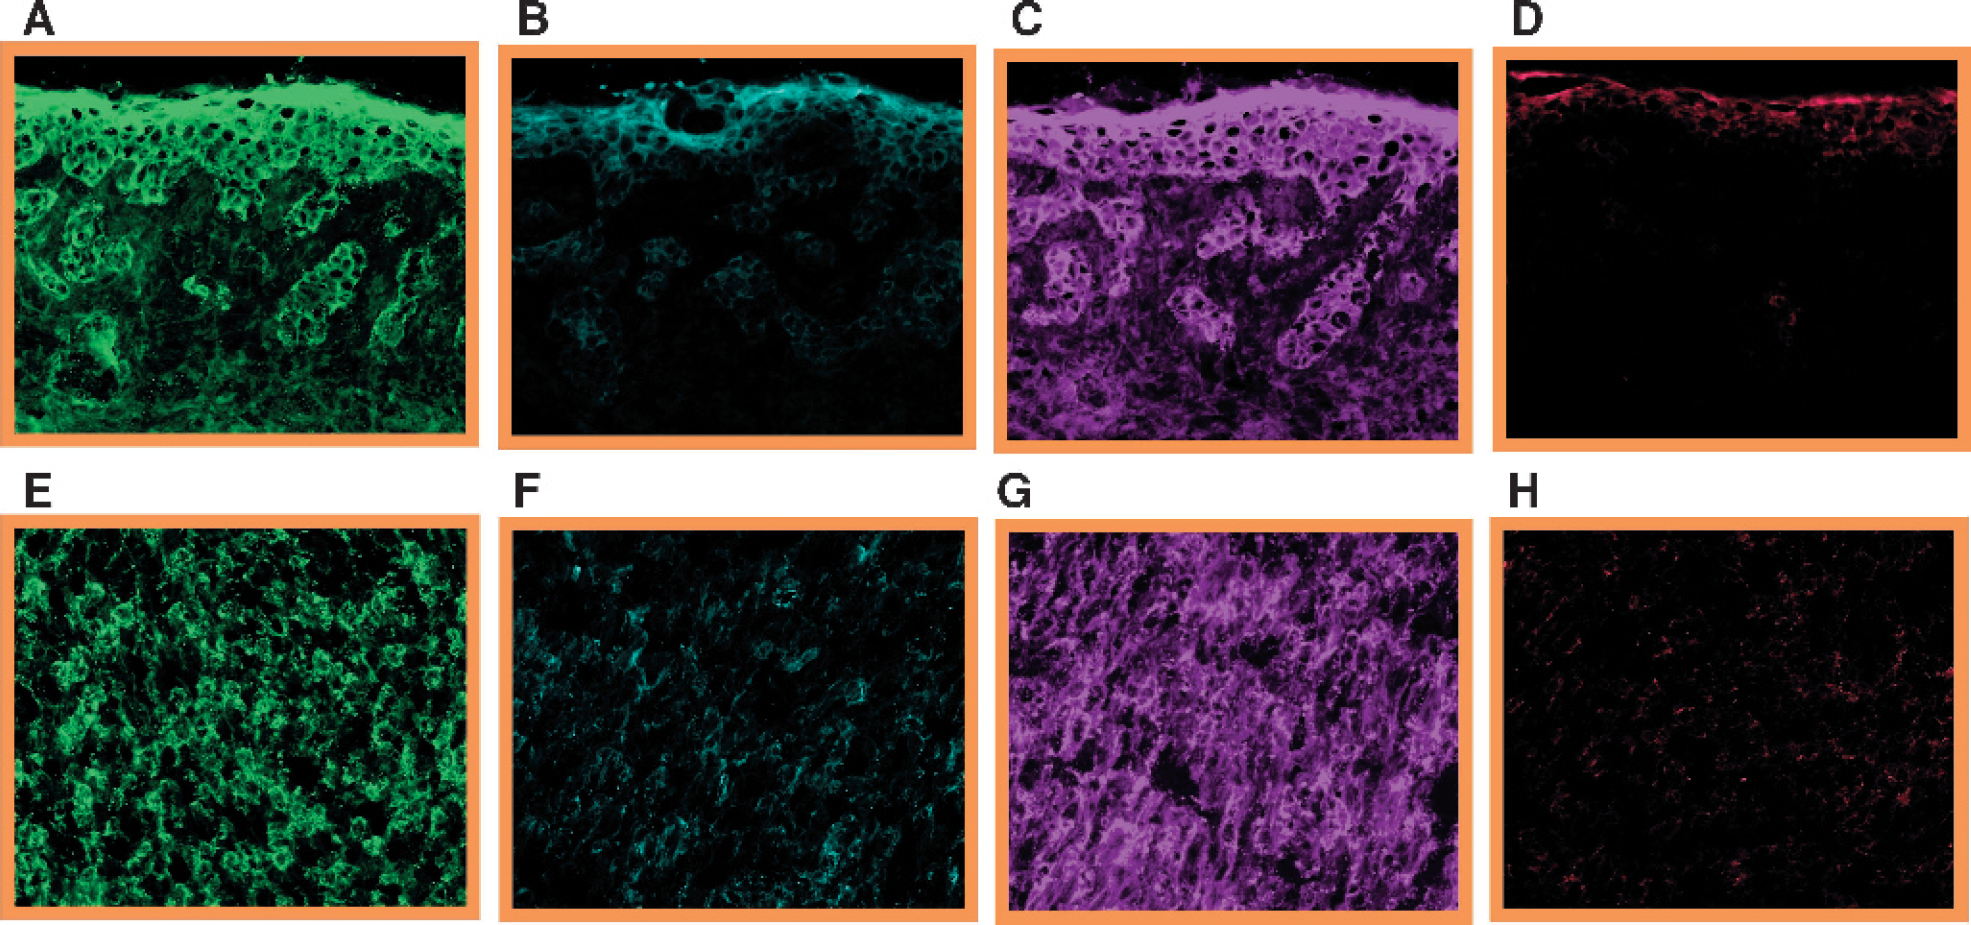
Expression of JAK2, JNK1, AKT1, and IL-8 in an atypical nevus and MGP melanoma. Five micrometer tissue sections, prepared from an atypical nevus (A-D) and MGP melanoma (E-H), were probed with a Cy3-conjugated anti-mouse JAK2 antibody (A and E) (pseudocolored green), a Cy5-conjugated anti-human JNK1 antibody (B and F) (pseudocolored turquoise), a Cy3-conjugated anti-human AKT1 antibody (C and G) (pseudocolored purple), and a Cy5-conjugated anti-human IL-8 antibody (D and H) (pseudocolored red).
Fluorescence images, “flat-field” corrected to avoid artifacts of uneven illumination, were rotated a few degrees to correct for a slight rotation in the mounting of the camera to the microscope and stage motion axis. In addition, the tiles of the collages were overlapped by about 30 pixels in the X and Y direction to adjust for the “seam and edge” effects caused by the rotation. These adjustments generated correctly collaged images from multicolor tiles with 1280 by 1024 pixel resolution and 12-bit dynamic range. Background intensity, calculated as the average of the fluorescence hybridization signals detected outside the user-defined cellular compartments and the areas beyond the edges of the tissue sections, was subtracted from the average fluorescence hybridization signal intensity. Defined as “net average hybridization signal strength,” this calculation generated quantitative data that were proportional to the degree of fluorescence hybridization signal(s) present in the cells of the user-defined cellular compartments of the tissue sections. In addition to generating quantitative protein expression data by applying this “field-based” approach, the same custom-designed imaging software was used to generate quantitative data via a “cell-based” approach. For the single “cell-based” analysis, input from DAPI nuclear fluorescence allowed the program to locate the position of each nucleus, estimate the boundary of the cell, and quantitate the fluorescence-based intensity within the “doughnut-shaped” area between the nucleus and the cell boundary. This background-subtracted fluorescence hybridization signal was determined for each cell and the intensities were averaged, yielding a single “cell-based” intensity value per tissue section.

NF-κB expression in the progression pathway of melanoma. Tissue sections prepared from a benign nevus (A), and atypical nevus (B), a melanoma in situ (C), a VGP melanoma (D), and an MGP melanoma (E) were probed with a Cy5-conjugated anti-human NF-κB antibody (pseudocolored yellow) and counterstained with the nuclear stain, DAPI (pseudocolored blue).
Results
Expression of Upstream Regulators and Downstream Targets of STAT3 in Nevus and Melanoma Specimens
To determine expression, or absence thereof, of JAK2, JNK1, AKT1, IFN-α/β-R, NF-κB, IκB-α, phosphorylated IκB-α, and IL-8 in the different stages of the melanoma progression pathway, tissue sections, prepared from benign and atypical nevi and melanomas in situ, none of which can be cultured and propagated in vitro, and VGP and MGP melanomas, were probed with cyanine dye-conjugated antibodies specific for each of the molecules. Depicted in Figure 1 are fluorescence images of tissue sections of an atypical nevus (Figure 1, panels A-D) and MGP melanoma (Figure 1, panels E-H), stained for JAK2 (Figure 1, A and E), JNK1 (Figure 1, B and F), AKT1 (Figure 1, C and G), and IL-8 (Figure 1, D and H). Figure 2 displays NF-κB antibody-probed tissue sections of a benign (Figure 2A), and an atypical nevus (Figure 2B), a melanoma in situ (Figure 2C), and a VGP (Figure 2D) and MGP melanoma (Figure 2E). Unlike JAK2, AKT1, NF-κB, and IFN-α/β-R (fluorescence images not shown), which were strongly expressed in almost all nevi and melanomas, JNK1 was expressed at significantly lower levels, and not in every specimen. In contrast, IkB-α, phosphorylated IκB-α, and IL-8 were not found to be expressed in keratinocytes, nevocytes (which are clusters of melanocytes), or in melanoma cells. However, the fluorochrome-conjugated IL-8 antibody did stain vascular endothelial cells in the individual tissue sections. A summary of the data of these fluorescence imaging analyses is presented in Table 1.
With respect to cellular location and expression level in benign and atypical nevi, JAK2, AKT1, and in particular, NF-κB, revealed the most prominent expression in epidermal keratinocytes and in cells comprising the epidermal-dermal junction. Furthermore, as demonstrated in Figure 2, overall expression levels of NF-κB appeared to be higher in MGP melanomas compared with VGP melanomas and melanomas in situ. While the cellular localization of JAK2, JNK1, AKT1, and NF-κB was predominantly cytoplasmic, in some cases they were also detected in nuclei, although the nuclear fluorescence signals were generally weaker. In contrast, IFN-α/β-R was prominently localized in the plasma membrane. Regarding the analysis of early- and advanced-stage melanomas, care was taken to insure that protein expression was attributed to melanoma cells rather than host immune infiltrate. Furthermore, to independently verify the data obtained by fluorescence imaging, adjacent tissue sections of each specimen were analyzed by standard immunohistochemistry, using the same primary antibodies, but not fluorochrome-conjugated. Relative levels of individual protein expression and staining pattern were similar to those detected by fluorescence imaging (data not shown).
Expression of JAK2, JNK1, AKT1, IFN-α/β-R, NF-κB, IκB-α, phosphorylated IκB-α, and IL-8 in Nevi and Melanomas

Adjacent tissue sections, obtained from nevus and melanoma specimens, were probed with a fluorochrome-conjugated antibody specific for each molecule, and protein expression was determined by fluorescence imaging of the stained tissue sections.
Quantitative Analysis of NF-κB and IFN-α/β-R Expression in Atypical Nevi Excised Pre- and Post-Low-Dose IFN-α2a Treatment, and in MGP Melanoma-Positive Lymph Nodes Obtained Pre- and Post-High-Dose IFN-α2b Treatment
Since it would have proven difficult, as shown in the case of NF-κB (Figure 3), to objectively determine by the naked eye whether low-dose IFN-α2a had altered the level of expression of the respective proteins in atypical nevi obtained posttreatment, an optical imaging software program was designed to quantitate the fluorescence hybridization signals in every fluorochrome-conjugated antibody-stained nevus section. Given the observation that increasing levels of NF-κB expression appeared to correlate with progression from atypical nevi to early- and advanced-stage melanomas (Figure 2), quantitative fluorescence imaging analysis was performed first on the NF-κB antibody-stained nevus sections.
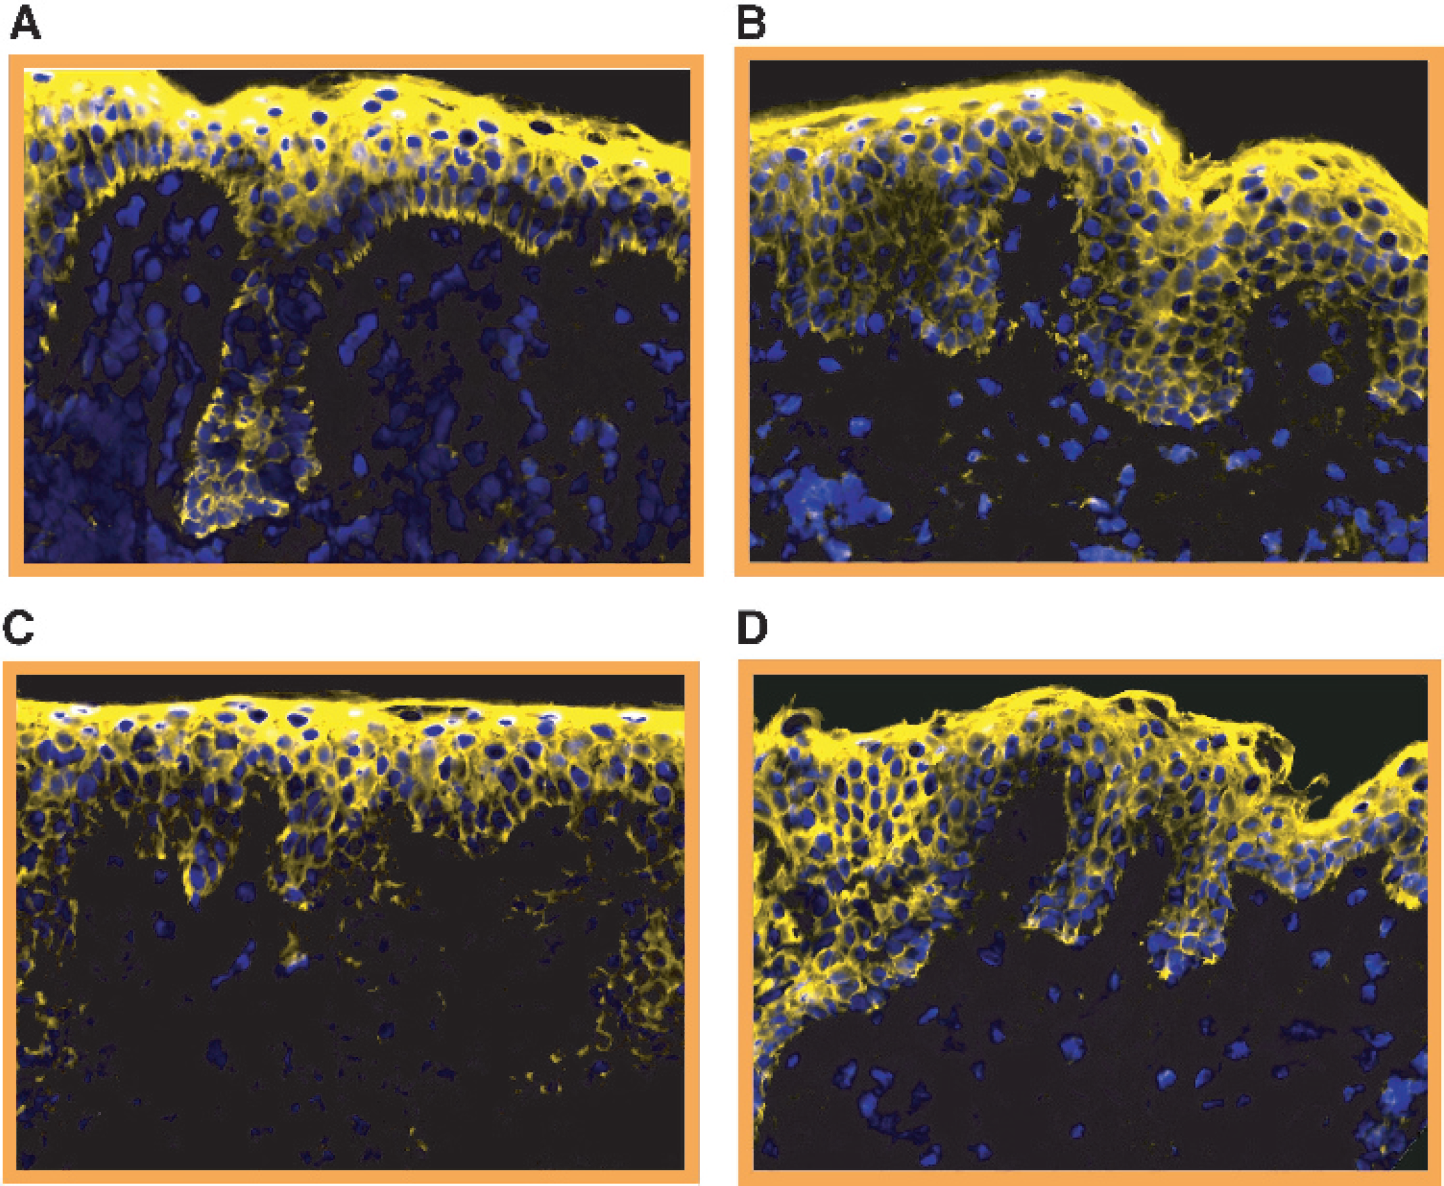
Expression of NF-κB in atypical nevi obtained from a patient before and after 3 months of systemic low-dose IFN-α treatment. Tissue sections prepared from atypical nevi, obtained before (A and B) and after (C and D) low-dose IFN-α treatment, were probed with a Cy5-conjugated NF-κB antibody (pseudocolored yellow) and counterstained with DAPI (pseudocolored blue).
Upon acquisition of the dual-color (Cy5-NF-κB and DAPI) rectangular tiles, which encompassed the epidermis, epidermal-dermal junction, and part of the dermis, the Cy5-NF-κB hybridization signals within the epidermis and epidermal-dermal junction were quantified using a single “cell-based” and “field-based” approach. Excluded from the quantitative analyses were the upper part of the dermis and the keratin-comprising stratum corneum because they yielded nonspecific antibody staining. Arbitrary hybridization signal intensity values, representing the average fluorescence per single cell or per nevus field, were generated for each nevus section.
A total of 96 nevi obtained from 24 patients, pre- and post-low-dose IFN-α treatment, were analyzed using these two quantitative imaging software methods. The results, presented in Figure 4, documented that in the case of each nevus section, the level of NF-κB protein expression determined by the single “cell-based” approach corresponded closely to the level of NF-κB protein expression obtained by the “field-based” method. However, neither of the two fluorescence imaging analyses revealed quantitative changes with respect to the level of NF-κB expression in atypical nevi obtained after versus before low-dose IFN-α treatment.
On the other hand, quantitative imaging analysis of tissue sections prepared from an atypical nevus (Figure 1, panels A-E) and MGP melanoma, resected from two patients prior to any clinical treatment (Figure 1, E-H) demonstrated that the proteins JAK2 (Figure 1, A and E) and AKT1 (Figure 1, C and G) were expressed at two- and threefold higher levels than JNK1 (Figure 1, B and F) and IL-8, respectively (Figure 1, D and H). Furthermore, NF-κB expression in the MGP melanoma (Figure 2E) was found to be 3 times higher compared to its expression in the atypical nevus (Figure 2B) and in a melanoma in situ (Figure 2C), and 1.7 times higher than in a VGP melanoma (Figure 2D), the latter two having also been obtained from two patients before clinical treatment.

Quantitative “cell-based” and “field-based” fluorescence imaging analysis of NF-κB expression in atypical nevi obtained before and after systemic low-dose IFN-α treatment. Following the probing of atypical nevus sections with a Cy5-conjugated NF-κB antibody and the nuclear counterstain DAPI, collages were acquired for each fluorescence-stained tissue section. Custom-designed optical imaging software was used to quantitate NF-κB expression in individual cells (A) and across the entire field (B) of a nevus section. Atypical nevi from 24 patients were analyzed and they are depicted in chronological order of IFN-α treatment received.

Expression of IFN-α/β-R in atypical nevi and MGP melanoma-positive lymph nodes resected before and after systemic low- or high-dose IFN-α treatment. Depicted in A and B are tissue sections from the same patient, prepared from an atypical nevus obtained before (A) and an atypical nevus obtained after (B) low-dose IFN-α treatment. Shown in C and D are tissue sections of an atypical nevus obtained before (C) and an atypical nevus resected after (D) high-dose IFN-α treatment of a patient. Panels E and F represent tissue sections prepared from an MGP melanoma-positive lymph node resected before (E) and an MGP melanoma-positive lymph node obtained after (F) high-dose IFN-α treatment of another patient. Each tissue section was probed with a Cy5-conjugated anti-human IFN-α/β-R antibody (pseudocolored red) and counterstained with DAPI (pseudocolored blue).
To address the possibility that unlike low-dose IFN-α treatment, which did not impair the level of expression of NF-κB or the other proteins (data not shown) in atypical nevi, we analyzed tissue sections from atypical nevi that were obtained from patients before and after 3 months of systemic high-dose IFN-α2b treatment, and MGP melanoma-positive lymph nodes which had been surgically resected from patients before and after 4 weeks of high-dose IFN-α2b treatment. Upon probing the respective tissue sections with the different fluorochrome-conjugated antibodies and conducting quantitative analyses of the captured fluorescence images of atypical nevi, a significant increase in IFN-α/β-R expression was noticed in MGP melanoma-positive lymph nodes resected from patients after 4 weeks of high-dose IFN-α treatment (Figure 5F). In contrast, atypical nevi collected in the context of either the low-dose (Figure 5, A and B) or the high-dose IFN-α treatment protocol (Figure 5, C and D) did not exhibit quantitative changes in the level of IFN-α/β-R expression.
Discussion
The data presented in this study demonstrate that like the transcription factors STAT1 and STAT3 [3], NF-κB is expressed in epidermal keratinocytes and in cells comprising the epidermal-dermal junction of benign and atypical nevi. Furthermore, there appears to be a corollary between increasing levels of NF-κB expression and progression from atypical nevi to early- and advanced-stage melanomas. However, unlike as shown in the case of STAT1 and STAT3 [3], the results of the qualitative and quantitative fluorescence imaging analyses, performed in the context of this precursor lesion study, did not provide evidence that systemic low-dose IFN-α treatment had induced a change from the predominantly cytoplasmic localization of NF-κB to a nuclear one, or that it had altered the level of NF-κB expression in atypical nevi obtained from patients after versus before treatment. This finding is opposite the one described by Rath and Aggarwal [14], who showed that, in vitro, IFN-α is a potent suppressor of constitutively expressed NF-κB. Interestingly, both in the case of STAT1/STAT3 [3] and NF-κB, systemic IFN-α treatment does not exert the same effect or regulatory impact on these transcription factors as what has been described in the context of in vitro studies.
In quiescent cells, NF-κB is maintained in an inactive form in the cytoplasm through its association with IκB kinases (IKKs). Upon phosphorylation of IκB-α by the IKK complex, which encompasses the subunits IKK-α, IKK-β, and IKK-γ, IκB-α is targeted for ubiquitindependent degradation. Thereupon, NF-κB is translocated to the nucleus where it activates target genes. Given that in benign and atypical nevi, NF-κB was detected predominantly in the cytoplasm of epidermal keratinocytes and junctional melanocytes and keratinocytes, it was surprising that we did not observe in any of the nevus or melanoma specimens, either by fluorescence imaging or standard immunohistochemistry, expression of IκBα or phosphorylated IκB-α. To reconcile this finding with data reported in the literature, which have described IκBα expression in melanoma cell lines [15–17], will require further studies.
The other protein that, like NF-κB, exhibited prominent expression in nevus and melanoma specimens was AKT1. On the other hand, JNK1 was found to be expressed at comparatively low levels, and IL-8 expression was not detected at all in any of the specimens analyzed. Like NF-κB, AKT has been implemented in promoting cell survival, and while the issue of whether AKT activates or is a downstream target of NF-κB [18] is not yet resolved, a recent study by Ivanov et al. [9] demonstrated that the PI-3K/AKT pathway, by disrupting co-operation between c-Jun and STAT3, leads to increased expression of surface Fas receptor and concomitant sensitization to FasL-mediated apoptosis. The fact that as shown in the present study, AKT, and as previously demonstrated, STAT3 [3], are expressed at high levels in nevi and melanomas, yet FasL is not detected in nevi and VGP melanomas, but only in a small fraction of MGP melanomas [19], suggests that in nevi and melanomas, the PI-3K/AKT pathway may not be active or may not function in this particular way. On the other hand, the recently reported findings that NF-κB down-regulates JNK [20], and that AKT inhibits JNK through activation of the NF-κB pathway [21], may explain why compared to the strong of expression of AKT1 and NF-κB, observed in nevus and melanoma specimens, JNK1 expression was found to be significantly lower. With respect to the expression of the cytokine, IL-8, there is still a controversy as to whether IL-8 is expressed in nevi and/or melanomas [22,23]. For example, Patel et al. [11] reported that constitutive and induced NF-κB activation regulates IL-8 expression in melanoma cells, and that down-regulation of NF-κB leads to inhibition of IL-8 production. However, the results obtained by fluorescence imaging and standard immunohistochemistry, which showed strong expression of NF-κB and lack of IL-8 expression in every stage of the melanoma progression pathway, do not support an existing correlation or “cross-talk” between these two molecules in either nevi or melanomas.
The other finding that emerged from our study was the observation that systemic high-dose IFN-α treatment led to increased expression of IFN-α/β-R in MGP melanoma-positive lymph nodes, but not in atypical nevi or melanomas. In fact, only 1/5 MGP melanoma specimens revealed expression of IFN-α/β-R. A close examination of the fluorescence images of the MGP melanoma-positive lymph nodes resected before and after treatment suggested that, indeed, it was not lymph node-interspersing MGP melanoma cells that exhibited increased IFN-α/β-R expression following high-dose IFN-α treatment, but the lymphocytes. Although this observation requires further investigations such as probing the MGP melanoma-positive lymph nodes with fluorochrome-conjugated melanoma and T-cell specific antibodies, it may suggest that in the context of clinical treatment, high-dose IFN-α does not so much alter the expression of genes in atypical nevi and melanomas, but rather that it elicits a host immune response.
Footnotes
Acknowledgments
We thank L. Stover and R. Mascari for assistance in collecting nevus and melanoma specimens. This work was supported by grants from the National Institutes of Health (D. B. and D. L. F.) and the Cancer Treatment Research Foundation (D. B.).