
Abstract
In the present study we used high-density EEG brain mapping to investigate spatio-temporal aspects of brain activity in response to experimentally induced muscle pain in 17 patients with migraine without aura and 15 healthy controls. Painful electrical stimuli were applied to the trapezius muscle and somatosensory-evoked potentials were recorded with 128-channel EEG with and without concurrent induced tonic neck/shoulder muscle pain. At baseline, the calculated P300 dipole for single stimuli was localized in the cingulate cortex. In patients, but not in controls, the dipole changed position from baseline to the tonic muscle pain condition (z = 29 mm vs. z = −13 mm, P < 0.001) and from baseline to the post-tonic muscle pain condition (z = 29 mm vs. z = −9 mm, P < 0.001). This may be the first evidence that the supraspinal processing of muscle pain is abnormal in patients with migraine without aura.
Introduction
In healthy subjects, brain imaging has demonstrated with reasonable consistency that certain brain areas (SI, SII, thalamus, cingulate cortex, basal ganglia, cerebellum and parts of the insula) are involved in pain processing (1–3). Moreover, brain imaging has provided new understanding of how the human brain works by demonstrating that the adult brain is not static but capable of substantial plastic changes in response to pain (4–6).
In migraine patients, brain imaging has provided evidence of both structural changes (decrease in grey matter in several of the cortical areas known to be involved in pain processing (7–9)) and functional changes (i.e. changes in regional cerebral blood flow in the brain stem during the migraine attack (10)). As in other clinical pain conditions, most studies investigating functional changes in migraine have been based on PET or fMRI techniques (10,11). These techniques have the advantage of a high spatial resolution in showing the cerebral areas activated by the afferent input, but because they use indirect methods based on changes in metabolic parameters (such as glucose consumption or haemoglobin oxygenation), their sensitivity to the temporal sequence of the cerebral events is rather low (12–14). In comparison, electroencephalography (EEG) can monitor brain activity in the order of milliseconds (13). The main obstacle to conventional EEG has been the poor spatial resolution. By using a high number of recording electrodes (high-density EEG) together with the development of different source localization methods for the retrieval of intracerebral dipoles based on the somatosensory-evoked potentials recorded at the scalp surface, the EEG technology has, however, improved significantly. In the present study we used high-density (128-ch) EEG brain mapping to investigate functional changes in the spatio-temporal aspects of brain activity in response to intramuscular electrical stimulation in patients with migraine without aura and in healthy controls before, during and after experimentally induced tonic muscle pain.
Materials and methods
Subjects
Nineteen patients (3 men, 16 women) with a diagnosis of migraine without aura according to the criteria of the International Classification of Headache Disorders (ICHD-2) were recruited from the out-patient headache clinic at a tertiary headache centre. The inclusion criteria were a diagnosis of migraine without aura, one to six migraine attacks per month and age between 18 and 65 years. Patients with coexisting chronic tension-type headache or medication-overuse headache were excluded. Eighteen healthy volunteers (3 men, 15 women) served as controls. The controls were allowed to have infrequent episodic TTH and/or migraine < 1 day per month (none had migraine). Both patients and controls were headache free on the day of examination and at least 12 h prior to the investigation. In both groups exclusion criteria were: use of prophylactic headache therapy; antiepileptics and/or antidepressants; excessive use of simple analgesics (use of analgesics on 15 days or more each month); over-consumption or addiction to morphine; pregnancy; breastfeeding; and serious somatic or psychiatric diseases including depression. Subjects were not allowed to take analgesics or muscle relaxants 24 h prior to the investigation.
All subjects underwent a general physical and a neurological examination. Patients and controls were examined in random order. A written consent from each subject was obtained prior to the study. The study was approved by the local ethical committee (KA 05085) and conducted in accordance with the Helsinki Declaration.
Experimental procedures
Each subject underwent three experimental conditions. Subjects had at least a 5–10 min break between experimental conditions or until the effects of experimental muscle pain had disappeared. The somatosensory potentials (SEPs) were evoked by intramuscular electrical stimuli in the trapezius muscle. Prior to the experiment quantitative sensory testing was recorded.
Quantitative sensory testing
Pressure pain thresholds (defined as the pressure at which the sensation changed from pressure alone to a combination of pressure and pain) were measured at the trapezius muscle and at the dorsum of the second finger (middle phalanx) using a pressure algometer (Somedic AB, Sweden) (15). Electrical pain thresholds for the single pulses and train pulses (recorded at the fifth stimulus) were determined by a method of limits (16). All measurements were performed three times with a 1-min interval and a mean of the three measurements was used.
Electrical stimulation
The needle electrodes (Medtronic Danmark A/S, Copenhagen S, Denmark, Disposable Sensory Needle Electrode, 20 mm ×0.35 mm (28G), active recording area 2.0 mm2) were placed (10 mm distance, 5 mm depth) in the trapezius muscle (on the centre of the descending part of the trapezius muscle 2 cm laterally to the midway between the processus spinosus of the seventh cervical vertebra and the lateral edge of the acromion). EMG activity was registered to confirm that the electrodes were placed in the muscle.
The constant current electrical stimulation consisted of two modes; single stimuli with duration of 1 millisecond and train stimuli consisting of five repeated single stimuli given with 2 Hz. This interval between the repeated stimuli is known to activate temporal summation (i.e. increasing pain perception to repetitive stimulation at the same intensity) (17,18). An electrical stimulator (NoxiTest Biomedical A/S, Aalborg University, Aalborg, Denmark) was programmed with the LabVIEW (National Instruments) to make 60 single stimuli and 60 train stimuli in randomized order with inter-stimulus interval between 4 and 6 s. Inter-stimulus interval longer than 3 s was chosen to avoid central temporal summation between the stimulations (19). Single stimuli were given with the electrical pain threshold for single pulses and train stimuli were given with the electrical pain threshold for train pulses.
Induced tonic pain
Glutamate (0.2 ml of glutamate: L-monosodiumglutamate 1 M, 1 mmol – 187 mg) was injected with a 1 ml syringe and a 27G X 3/4 inch cannula (Terumo Europe N.V., Leuven, Belgium) into the trapezius muscle at the reference point (on the centre of the descending part of the trapezius muscle 2 cm laterally to the midway between the processus spinosus of the seventh cervical vertebra and the lateral edge of the acromion). The subjects were asked to rate the tonic muscle pain every 30 s. If the rating fell below the pain threshold level another injection was given.
Allodynia questionnaire
Approximately 1 month after the experiment all patients were contacted by telephone and asked to complete a questionnaire regarding their skin sensitivity during past migraine attacks. The questionnaire was as follows. Do you experience pain or unpleasant sensation on your skin during a migraine attack when you engage in any of the following activities (Yes, No, N/A): combing your hair; pulling your hair back (e.g. ponytail); shaving your face; wearing eyeglasses; wearing contact lenses; wearing earrings; wearing necklaces; wearing tight clothes; taking a shower (when water hits your face); resting your face on a pillow on the side of the headache; being exposed to heat (e.g. cooking, placing heating pads on your face); or being exposed to cold (e.g. breathing through your nose on a cold day, placing ice pads on your face)? Patients were also asked whether triptan therapy typically terminates their migraine attacks (always, sometimes, only if treated early, never). The questionnaire has been developed by Jakubowski et al. (20) as a diagnostic tool to identify allodynic patients.
EEG data acquisition
The EEG was recorded from 128 surface electrodes using a standard EEG-cap (Waveguard cap system, Cephalon A/S, Noerresundby, Denmark) employing the 10-5 montage system (21). Impedance was kept below 5 KΩ. EEG signals were sampled at 2048 Hz; 16-bit resolution in EEG quantification was used. The EEG was recorded by use of the EEProbe Software (ANT B.V., Enschede, Netherlands).
Analysis of EEG data
The examiner, who recorded and handled the EEG data, was blinded for the headache diagnosis. Epoching, artifact rejection and averaging were performed by use of custom-made Matlab/LabVIEW based EEG Inspect software. For single pulses epoch duration of SEPs ranged from 100 ms before to 600 ms after the stimulus onset. For each of the five train pulses epoch duration ranged from 100 ms before to 500 ms after the stimulus onset. Only the first and fifth pulses of the train stimulation were subjected to further analysis.
The epochs were forward and reverse filtered with fourth-order Butterworth band pass filter (0.5–100 Hz) in Matlab. All valid epochs were transformed to a common average reference offline. The averaged EEG data were further processed with the Matching Pursuit algorithm (22,23) in order to eliminate the 50 Hz component and any other disturbances.
From the compressed waveforms profile for each subject, specific peak stages were extracted for further analyses. For each of the extracted peak stages the localization and magnitude of the corresponding dipole was computed with the moving dipole model. The localization of each dipole is reported according to the Subjects Coordinate System (SCS) (provided by the manufacturer of the analysis software, ANT-Software A/S, ANT B.V., Enschede, Netherlands), which describes the localization of the dipole on the basis of three axes: x, y and z (Fig. 3). Based on the computed individual dipoles a mean x-coordinate, y-coordinate and z-coordinate was calculated for each group (patients and controls). Finally, the calculated dipoles were superimposed on MRI slices of the standard MNI (Montreal Neurological Institute) brain. Source analysis and topographic maps were created with the use of commercial available software ASA 3.0 (Advanced Source Analysis, ANT-Software A/S: http://www.ant-neuro.com/) and Brain Voyager Brain Tutor 2.0 (©2003–07 rainer Goebel, http://www.brainvovyager.com/BrainTutor.html).
Statistical analysis
The primary endpoint was difference in dipole components (peak latency, magnitude, localization) between baseline and tonic muscle pain in patients and controls in response to single and train stimuli. The secondary endpoint was difference in dipole components (peak latency, magnitude, localization) during tonic muscle pain between patients and controls in response to single and train stimuli. Further, differences in quantitative sensory parameters between patients and controls were analysed. SEP and dipole components (peak latency, localization, magnitude) were analysed with two-way RM
Results
Clinical data and quantitative sensory testing on migraine patients and healthy controls

Age, duration of migraine and frequency of migraine are presented as mean ± SD.
Pressure pain thresholds are presented as mean ± SE (independent-samples t-test).
Electrical pain thresholds are presented as median with quartiles in parentheses (Mann–Whitney U-test).
Quantitative sensory testing
No differences in pressure pain thresholds or electrical pain thresholds were found between patients and controls (Table 1). The electrical pain threshold for train pulses was significantly lower than the electrical pain threshold for single pulses both in patients (1.8 mA vs. 2.3 mA, P = 0.004) and in controls (2.5 mA vs. 3.9 mA, P = 0.001).
Compressed SEP waveform profiles and extraction of peak stages
In the compressed waveforms profile of the grand average three specific peak stages that were observed consistently as common features independently of experimental condition (baseline/tonic muscle pain/post-tonic muscle pain), group (migraine/controls) and stimulation mode (single/train) were selected for the further analyses. The first major peak that was observed was a negative peak occurring around 100 ms after stimulus onset (N100). The second and third major peaks were positive peaks occurring around 200 ms (P200) and 300 ms (P300) after stimulus onset. In Figure 1 the peaks are labelled on the compressed waveforms profile of the grand average for patients at baseline following single pulse stimulation. No difference in peak latency of the dipoles to single and train stimuli was found between baseline and the tonic muscle pain condition in patients or in controls. Likewise no difference in peak latency of the dipoles to single and train stimuli was found between patients and controls during the tonic muscle pain condition.
Compressed waveform single pulse (patients at baseline). The first major peak that was observed was a negative peak occurring around 100 ms after stimulus onset (N100). The second and third major peaks were positive peaks occurring around 200 ms (P200) and 300 ms (P300) after stimulus onset.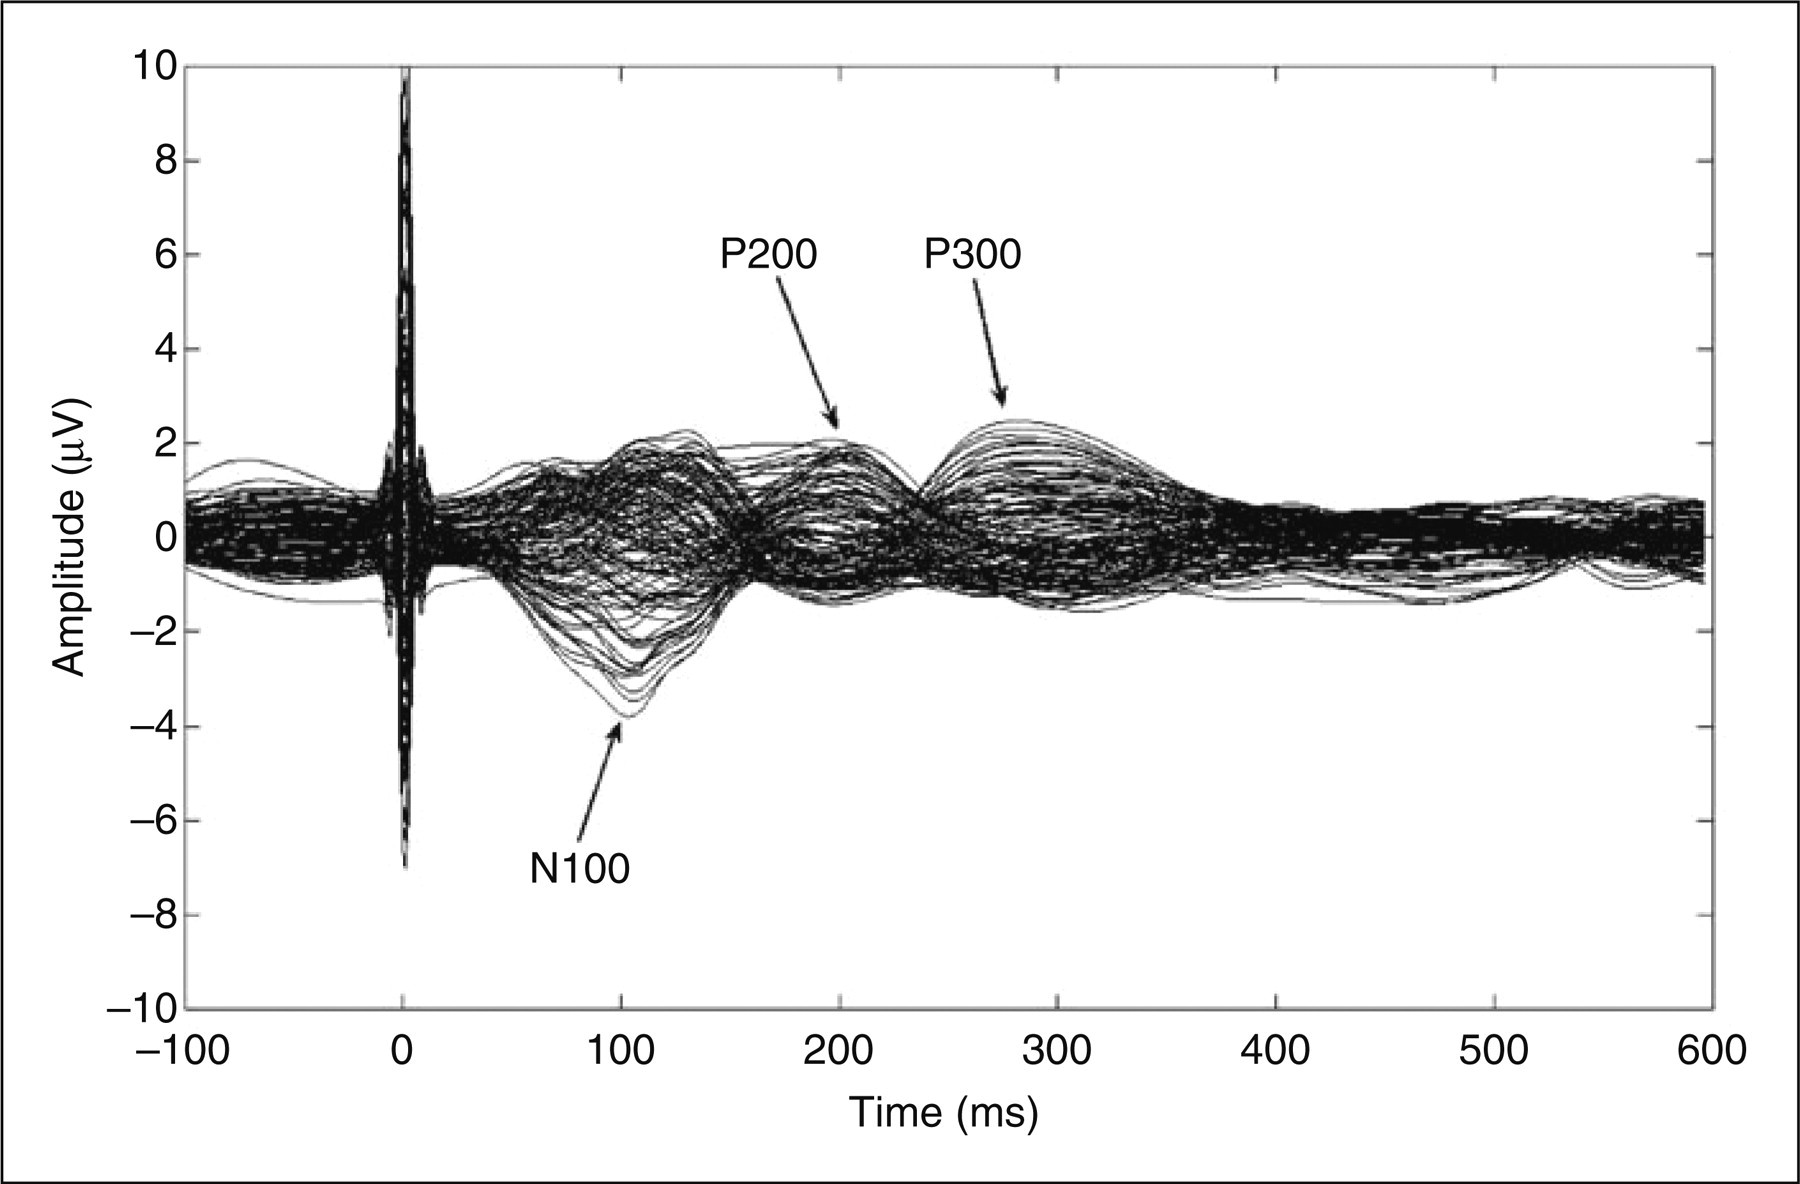
Topography
At N100, a dominant negative response was distributed over both hemispheres. At P200, the topography became dominated by a positive response; meanwhile the negative response was dispersed to the posterior area. In the late phase, 300 ms, the dominant positive response was distributed over both hemispheres whereas a small negative response was seen in the frontal area. No major difference in topographic maps between the conditions (baseline/tonic muscle pain/post-tonic muscle pain) or groups (migraine/controls) was seen (Fig. 2).
Topography of single pulse migraine vs. control. B, baseline; T, tonic muscle pain condition; P, post-tonic muscle pain condition; positive response (red colour), efflux; negative response (blue colour), influx. No major difference in topographic maps between the conditions (baseline/tonic pain/post-tonic pain) or groups (migraine/controls) was seen.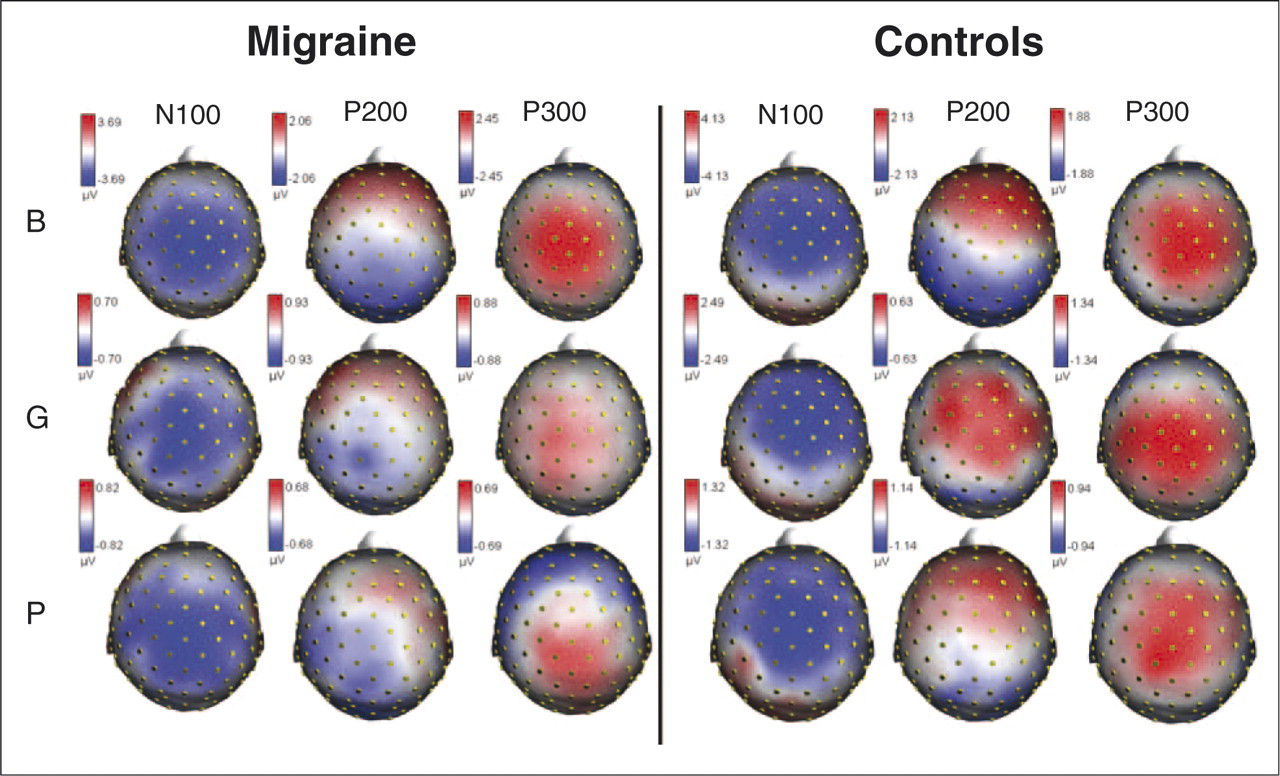
Localization of the dipoles (x-, y- and z-coordinates)
Significant difference in localization of the P300 dipole for single stimuli was found (z-coordinate: F = 4.8, P = 0.01). In both patients and controls the calculated P300 dipole for single stimuli was localized in the cingulated cortex at baseline (patients: x, −5 mm; y, −3 mm; z, 29 mm; controls: x, −9 mm; y, −8 mm; z, 30 mm). In patients, but not in controls, the position of the z-coordinate changed significantly (moved caudally) from baseline to the tonic muscle pain condition (Fig. 3) (baseline z = 29 mm vs. tonic muscle pain z = −13 mm; Tukey HSD, P < 0.001) and from baseline to the post-tonic muscle pain condition (baseline z = 29 mm vs. post-tonic muscle pain z = −9 mm; Tukey HSD, P < 0.001). Consequently, the dipole in patients was localized significantly more caudally than the dipole in controls during (patients z = −13 mm vs. control: z = 27 mm; Tukey HSD, P < 0.001) and after (patients z = −9 mm vs. controls z = 11 mm; Tukey HSD, P = 0.05) induced tonic muscle pain.
Dipole localizations at baseline and during tonic pain in migraine patients (a) and controls (b) at P300 single pulse. The marked lines intersect in the dipole. Note: because the localization of the dipole is an estimated mean it is not necessarily constrained to a location within a grey-matter compartment.
A significant difference was also found in localization of the P200 dipole for the fifth train stimuli (x-coordinate, F = 4.7, P = 0.01) after induced tonic muscle pain (post-tonic muscle pain condition) where the localization of the x-coordinate in patients was different from the localization in controls (patients, x = 1 mm; controls, x = −22 mm; Tukey HSD, P = 0.006).
Magnitude of the dipoles
No difference in magnitude of the dipoles to single and train stimuli was found between baseline and the tonic muscle pain condition in patients or in controls. Likewise no difference in magnitude of the dipoles to single and train stimuli was found between patients and controls during the tonic muscle pain condition.
Discussion
For the first time the present study showed that the brain dynamics for tonic muscle pain and repeated phasic stimuli are different in migraine patients as compared with controls.
Pain sensitivity
Central sensitization is thought to play an important role in the maintenance and exacerbation of the acute migraine attack, and in the development of the chronic form of the disorder (24–27). Clinically, central sensitization may result in allodynia of the face and scalp (24–26,28) during migraine attacks whereas pain sensitivity seems to be normal between attacks (24,25). This is in line with the findings in the present study of normal pain thresholds for both pressure and electrical stimulation and supports that patients with episodic migraine have normal pain sensitivity between attacks. In the present study 71% of the patients had experienced one or more of the painful or unpleasant sensations on their skin, possibly reflecting allodynia during migraine attacks, which is very similar to previous findings (24).
Pain processing
The major finding in the present study was that the calculated P300 dipole for single stimuli in both patients and controls was localized in the cingulate cortex at baseline but changed position (moved caudally) during and after induced tonic muscle pain in patients but not in controls. This may be the first direct evidence of a functionally different supraspinal response to muscle pain interictally in patients with migraine without aura. What could be a possible interpretation of this result? In similar studies in other pain conditions, such as phantom-limb pain and irritable bowel syndrome, cortical reorganization has been found (29). Whether or not our finding could be interpreted as a result of short-term cortical reorganization in the cingulate cortex is not yet clear. Brain mapping in migraine is in its infancy, thus the result has to be confirmed in future studies in order to draw a firm conclusion. The changes in position of the dipole in patients in the present study were related to the cingulate cortex, which is known to be highly involved in pain processing (1–3). The complex functions of the cingualate cortex, such as modulation of emotional responses and evaluative and cognitive functions, are far from fully understood. It is therefore not possible to draw firm conclusions on the exact nature of the present findings. Also, other studies have found changes in the cingulate cortex in migraine patients. First of all, using a very similar technique as in the present study, although employing a considerably lower number of recording electrodes (25 ch), de Tommaso et al. previously examined the brain processing of pain in migraine without aura both during the migraine attack (30) and in the pain-free phase (31). In both studies potentials were evoked by CO2 laser and recorded by 25 scalp electrodes. In patients, they found that a P2 component that was generated in the anterior cingulated cortex was shifted towards a more rostrocaudal portion during the migraine attack (30). In another study they found that acute cutaneous pain induced by capsaicin induced a posterior shifting of the P2 component within the anterior cingulated cortex in healthy controls but not in migraine patients during the pain-free phase (31). Functional changes have also been found in regional cerebral blood flow during the migraine attack in the brain stem, visual cortex, auditory cortex and in the cingulated cortex (10). Further, using MRI and voxel-based morphometry Schmidt-Wilcke et al. (32) recently demonstrated a significant grey matter decrease in patients with migraine compared with healthy controls. The decrease was restricted to structures known to be involved in pain processing (including the cingulate cortex). This is in agreement with the finding by Valfrè et al. of a significant correlation between grey matter reduction in the anterior cingulate cortex and frequency of migraine attacks (8). Altogether this suggests that both structural changes and functional changes in the cingulate cortex may play a role in the pathophysiology of migraine.
Methodological considerations
Changes in electrical cortical activities have previously been demonstrated both in the days before and after a migraine attack. A possible criticism of our study may therefore be that patients were not contacted after the experiment to check for any post-recording attacks. One could expect that the change we found in patients in position of the P300 dipole would correspond to a change in topography. Yet, no major difference in topographic maps between patients and controls was seen. In the present study a ‘realistic head shape model’ (boundary element method) was used as a head volume conductor model. This model describes the electrical properties of the head as a number of homogenous and isotropic compartments (e.g. skull, brain, skin). The computation of the intracerebral sources (source reconstruction) from the measured EEG is called the solution of the ‘inverse problem’. In the present study a ‘moving dipole model’ was used to perform the source localization. The inverse problem lacks a unique solution and depends on certain model assumptions about the expected source. In the ‘moving dipole model’ the position of the source is a rough indication of the centre of gravity of the activated cortical area. Model assumptions and limitations are discussed in detail elsewhere (33,34).
Most of the previous studies on brain imaging have focused on superficial skin pain. In the present study intramuscular stimulation was used, because this type of stimulation is more clinically relevant in migraine patients than stimulation of the skin. Similar topographies and waveforms are found for sensory inputs from the skin and muscle and they are processed in nearly the same cerebral areas (35), but differences do exist. If, as in the present study, a low number of stimuli are used, muscle SEPs do not contain early SEP components, but have the first post-stimulus peak after 80–90 ms (13,36). The inter-individual variability in the localization of the dipoles in the present study could most likely have been reduced by superimposing the dipoles on individual brain images and by using Polhemus (Polhemus FASTRACK ®, http://www.polhemus.com) to mark the positions of the recording electrodes (and individual MRI). Finally, because this is the first high-density EEG brain mapping study in migraine patients the results must be confirmed in further studies in order to provide final evidence. In addition, a relatively high number of comparisons were performed and therefore the risk of type I error must also be taken into consideration.
Conclusion
In conclusion, we found that tthe calculated P300 dipole for single stimuli in both patients and controls was localized in the cingulated cortex at baseline but changed position (moved caudally) during and after induced tonic muscle pain in patients but not in controls. Further, we found that the localization of the P200 dipole for the fifth train stimuli after induced tonic muscle pain in patients was different from the localization in controls. Together, this may be the first direct evidence of a functionally different supraspinal response to muscle pain, interictally in patients with migraine without aura.
Footnotes
Acknowledgements
A special thanks to Kristian Hennings for spending his time developing the EEG Inspect ® software and to Maciej Gratkowski for providing the Matching Pursuit algorithm. This study is supported by the Danish Technical Research Council.