
Abstract
Migraine with aura (MA) is associated with cerebral hyper- and hypoperfusion during and after the attacks. Several attempts to estimate individual perfusion changes and asymmetries in patients with MA using transcranial Doppler (TCD) have not been consistent. In 70 patients with MA and 40 controls with migraine without aura (MoA) or without any history of migraine, interictally recorded TCD sequences were prospectively analysed. Formal curve analysis of the visually evoked flow response (VEFR) was performed semiautomatically. As a main parameter for functional vasomotor reactivity (fVMR), the visually evoked flow rate (VEFR%) was calculated. The VEFR% showed a significantly higher mean difference of 14.7 ± 12% in MA patients vs. 5.8 ± 4.4% (P < 0.001) in controls. The significant asymmetry of fVMR in MA patients is suggested to reflect interattack persisting vasomotor changes which are of pathophysiological interest and may be used as a monitoring tool under prophylactic medication.
Introduction
Sterile neurogenic inflammation caused by a dysfunction of the brainstem or diencephalic nuclei contributes to the mechanism of headache attacks in migraine (1, 2). The preceding aura symptoms in migraine, however, reflect a cortical spreading depression (CSD) (3, 4) that is associated with local blood flow changes and transient clinical signs (5).
Early characteristics of cerebral perfusion are slowly progressing hypoperfusion, often in the posterior part of the affected brain hemisphere (5, 6) that persists beyond the phase of the aura (7). Hyperperfusion follows in the headache phase (8) preferentially observed in previously hypoperfused areas (9), but occasionally at a distance and even in the opposite hemisphere (10). Hyperperfusion may persist hours and days after decay of symptoms (9). Although there is scant knowledge about the interattack conditions, changes of cerebral perfusion are unlikely to be limited to acute migraine attacks, and focal hypoperfusions during pain-free periods have been reported in single photon emission computed tomography (SPECT) studies particularly in migraine with aura (MA) (11).
Among several technologies used to demonstrate cerebral perfusion-related activation patterns (magnetic resonance imaging (12), positron emission tomography (13), SPECT (14)), real-time transcranial Doppler (TCD) is the most comfortable, sensitive and the least invasive to identify distinct changes in real time. Therefore, we investigated vasoreagibility in patients with repeated MA using different paradigms of functional TCD (fTCD).
TCD studies
Friberg et al. performed TCD blood flow velocity studies on the middle cerebral artery (MCA) in patients with migraine without aura (MoA) within the attack and interictally. They found a significantly reduced cerebral blood flow velocity (CBFV) in the MCA ipsilateral to the headache within the attack (15) but no changes interictally. Thomsen et al. confirmed a decreased flow on the ipsilateral side of the headache for patients during an attack without aura (16).
Thie et al. found reduced blood flow velocities during attacks of MoA, whereas blood flow increased in MA during the headache phase. However, there was no correlation between velocity changes and headache side or side of the aura symptoms in MA (17). In an additional study they evaluated subjects with MA and MoA interictally with significantly higher mean flow velocities compared with controls, supporting the view of abnormal vasoregulation in migraineurs. The results did not permit discrimination between MA and MoA, however.
In contrast, Thomsen et al. found a higher reactivity index in MA interictally compared with MoA (18), thus confirming alterations in vasoneural coupling in migraine, but further differentiating between both groups of migraine. However, no side-to-side difference was detected.
Finally, De Benedittis et al. conducted a study comparing TCD of the MCA and SPECT in migraine attacks with and without aura as well as interictally. Perfusion changes were more pronounced in MA during attacks, but sometimes occurred even during headache-free phases (11).
Functional TCD studies
Using visual stimulation, fTCD studies were able to identify more subtle changes in cerebral vasoreactivity persisting beyond the acute migraine attack. Thie et al. provided the first evidence for a higher variability of blood flow velocities in the posterior cerebral artery (PCA) after visual stimulation (19). Bäcker et al used flash stimuli and recorded CBFV responses, showing stronger CBFV changes in the PCA at beginning and end of stimulation and a lack of habituation in the MCA of migraineurs compared with controls (20). Nedeltchev et al. found a greater cerebrovascular response in migraineurs with aura in the PCA and MCA during visual stimulation using a checkerboard, with less habituation of the CBFV compared with controls (21). Finally, Baezner et al. using a pattern-coloured moving object and standardized TCD signal analysis (22), showed significantly greater CBFV in migraineurs compared with controls in the P2-segments of the PCA after full functional visual stimulation (23).
Our aim was to characterize persistent functional vasomotor reactivity (fVMR) changes in MA, during the symptom-free state, to contribute both to a better understanding of the pathophysiology of migraine and its potential use as a diagnostic tool in clinical practice, e.g. to differentiate transient ischaemic attack (TIA) or stroke mimics from MA attacks.
Subjects and methods
Population
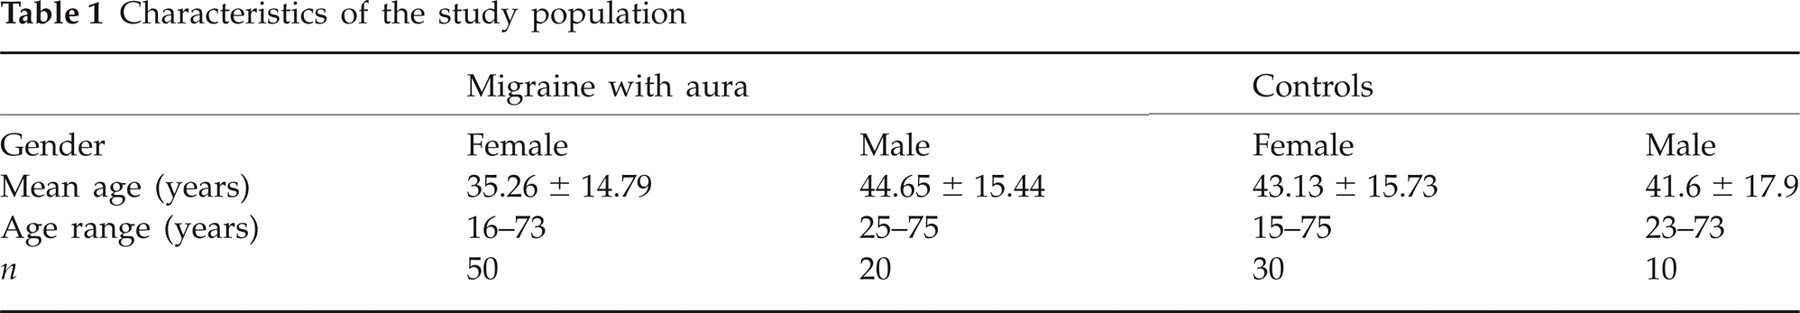
Seventy patients [50 women, age range 16–73 years (mean 35.26 ± 14.79); 20 men, age range 25–75 years (mean 44.65 ± 15.44)] with MA according to the diagnostic criteria of the International Headache Society (24) were recruited for the study (Table 1). Fifty-four patients reported a typical visual aura, whereas 16 described symptoms like hemihypaesthesia, hemiparesis or dysphasia. Ethical approvals were obtained according to appropriate national regulations. No patient included received any prophylactic medication against migraine, and the frequency of attacks was 1–7 days/month. Thirty-seven patients had left hemispheric symptoms, 27 had symptoms of the right hemisphere, whereas six presented with no predominant side effect or bilateral aura symptoms. Recording was performed in a headache-free period. Forty subjects with MoA or patients without any history of migraine or disorder affecting the visual system constituted the control group [30 women, age range 15–75 years (mean 43.13 ± 15.73); 10 men, age range 23–73 years (mean 41.6 ± 17.9)]. These controls mainly suffered from unspecific headache symptoms or symptoms without evidence of neurological deficit or any organic correlation. Patients with brain lesions (e.g. tumour, stroke, important atrophy) or structural changes of the vessels (e.g. stenosis, occlusion) were excluded.
Characteristics of the study population
Methods
Following our standardized study protocol (22), subjects lay comfortably in a quiet room and were asked to breathe regularly. Using a four-channel TCD scanner (DWL Multidop X) with 2-MHz pulsed-wave Doppler transducers affixed to a headband, we performed transtemporal TCD recordings from the P2-segments of both PCAs simultaneously during visual stimulation with a rotating optokinetic drum for 20 s (‘on’ phase) followed by 20 s with closed eyes (‘off’ phase). Ten cycles were performed and averaged. Vessels were identified according to the criteria described by Hennerici and Neuerburg-Heusler (25). Stimulus on and off phases were initiated by an acoustic signal. Fast Fourier transformation was used to calculate a time-averaged mean flow velocity for each cycle (Fig. 1).

Schematic drawing of the examination procedure: visual stimulation is performed with an optokinetic drum, transcranial Doppler (TCD) signal is recorded continuously and after 10 cycles data are averaged semi-automatically. CBFV, cerebral blood flow velocity; VEFR%, visually evoked flow rate.
Formal curve analysis of the visually evoked flow response (VEFR) was performed as displayed in Table 2, additional parameters being semiautomatically calculated including the onset and offset latency, the off phenomenon, the adaptation, and the steepness of the increasing and decreasing slope. Figure 2 illustrates the calculated parameters in an exemplary curve. All parameters were tested for a significant side difference within the individuals. The side difference was assessed as follows: VEFR% responses were analysed and high VEFR% minus low VEFR% was calculated. The other parameters were calculated the same way, choosing right minus left or left minus right according to the calculation of the VEFR%.
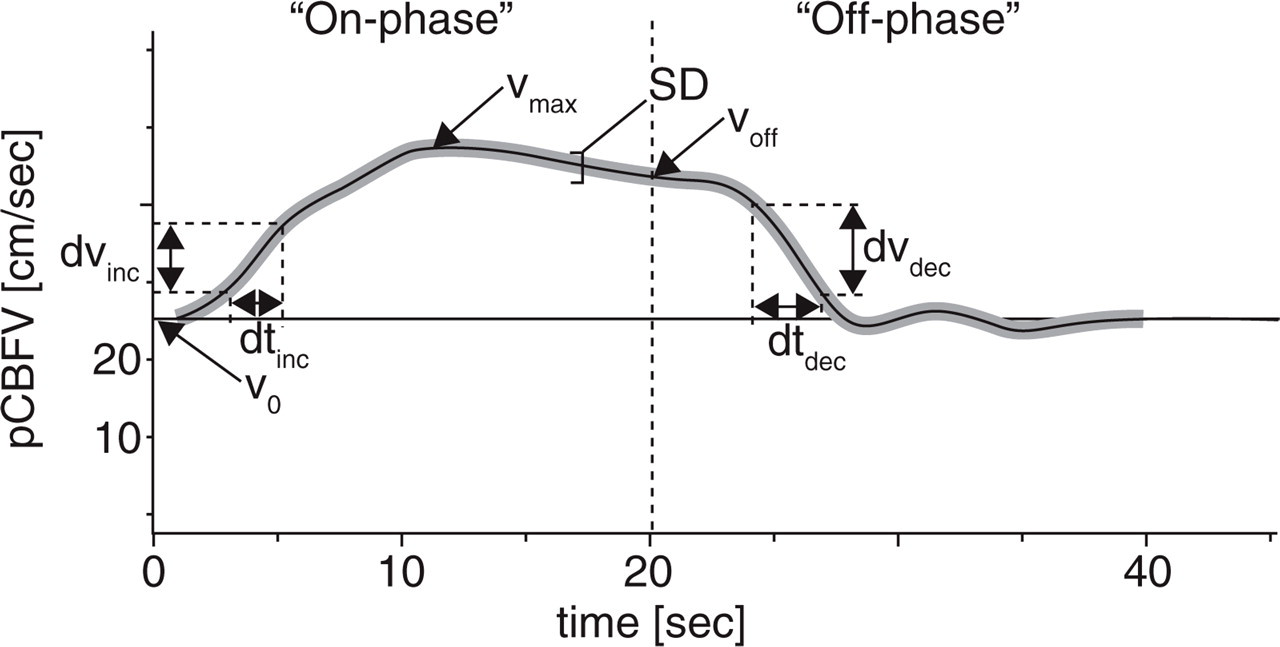
Standard pCBFV recordings of a patient and assessed values. During the first 20 s the visual stimulus was on (‘on-phase’), the next 20 s subjects closed their eyes (‘off-phase’). V0 means velocity at the beginning before stimulation, Vmax is the maximal velocity, Voff is the velocity at the end of stimulus. dvinc and dtinc were used to calculate the increasing slope, dvdec and dtdec for the decreasing slope.
Analysed parameters of vasomotor reactivity (VMR) in functional transcranial Doppler (fTCD) of the P2 segments of both posterior cerebral arteries

Statistics
Parameters were analysed to identify significant intraindividual side differences (left side vs. right side or vice versa) and between groups of MA patients and controls (side difference in one group vs. side difference in the other group). A one-sample two-tailed t-test was performed concerning a significant side difference within both groups for all parameters. Side differences within the groups were tested against each other with an independent-samples two-tailed t-test corrected for unequal variances where appropriate. Because of the moderately large number of statistical tests that were performed, the significance level was conservatively reduced to 0.01.
Results
Typical curves of the VEFR from a control subject (Fig. 3A) and a MA patient (Fig. 3B) are illustrated. The characteristics of the responses during stimulation in both groups are summarized in Table 3.

(A) Visually evoked flow response (VEFR) on left and right posterior cerebral artery (PCA) in a control subject. A side difference in VEFR is not obvious. (B) VEFR on left and right PCA in a patient with migraine with aura. A significant side difference in VEFR can be observed. VEFR%, visually evoked flow rate.
Parameters of the visually evoked flow response (VEFR) in migraine with aura (MA) (above) and the control group (below)

Values are mean ±
Comparison within the individuals and analysis of the differences between the groups were performed.
MA vs. controls
In MA a significant side difference was found for the VEFR% (P < 0.001), V max (P < 0.01), offset latency (P < 0.005) as well as steepness of increasing (P < 0.001) and decreasing (P < 0.001) slope. Differences of onset latency only showed a tendency (P < 0.05), differences of V 0, off phenomenon and adaptation were not significantly different from zero.
Similarly, control subjects showed a significant side difference for VEFR% (P < 0.001), onset latency (P < 0.01) and steepness of increasing (P < 0.005) and decreasing (P < 0.005) slope. Side difference of V max showed at most a small tendency (P = 0.078), whereas V 0, offset latency, off phenomenon and adaptation revealed no significant side difference.
Comparing the side differences between groups, the side difference of the VEFR in patients with MA was significantly higher than in controls (P < 0.001) (see Fig. 4).

Illustration of the side difference of visually evoked flow rate (VEFR%) with the SE in patients with migrainous aura and controls: a significantly higher side difference is found in the population with aura.
We found corresponding results with a significantly higher side difference in patients for offset latency (P < 0.01) and steepness of decreasing slope (P < 0.01), and a small tendency for steepness of increasing slope (P = 0.083). The side difference of the other parameters such as V max (P = 0.41), V 0 (P = 0.52), onset latency (P = 0.16), off phenomenon (P = 0.86) and adaptation (P = 0.99) showed no statistical significance.
Individual assessment
Figure 5 shows the side difference of the VEFR% of each individual subject in both groups. In Table 4 groups have been shown to evaluate the distribution within defined intervals of side difference; putting these results in a specificity/sensitivity scheme, we obtained the data illustrated in Table 5. A side difference > 5% is quite sensitive (74%) but is not specific for patients with MA (53%), whereas a difference of > 15% was observed in only one control subject, thus detecting migraineurs with aura with a specificity of 98% at this cut-off point.

Visually evoked flow rate (VEFR%) side difference in patients with migraine with aura (MA) and controls, each symbol represents one subject. In patients the side difference reaches levels above 16%, controls stay below. A cut-off point at e.g. 20% would suggest a possible diagnosis of MA in patients with a VEFR% difference > 20%.
Distribution of percent visually evoked flow response (VEFR%) side difference in both groups

Specificity/sensitivity scheme to differentiate migraine with aura patients and controls using the per cent visually evoked flow response (VEFR%)

Association between symptomatic side and distribution of asymmetry?
As to a potential association between the clinically affected side during the aura and the asymmetry in fTCD, for patients with symptoms of the left hemisphere (n = 37) when calculating right minus left, the VEFR% side difference was significant at 7.85 ± 16.82% (P < 0.01) (see Table 6). In 27 subjects out of 37 the asymmetry correlated with the symptomatic side. For patients with symptoms of the right hemisphere, the VEFR% side difference was 1.18 ± 19.92% (P = NS), with only 12 subjects out of 27 having an asymmetry matching the symptomatic side. Overall we found a tendency for a significant VEFR% side difference [5.04 ± 18.34 (P < 0.05)], and in 39 of 64 patients (61%) the side difference matched with the hemisphere affected by aura symptoms. However, there was no significant difference between this side difference and the results in the control group (P = NS).
Percent visually evoked flow response (VEFR%) evaluation considering the symptomatic migraine with aura side

MA, VEFR difference calculated as VEFR (asymptomatic side)—VEFR (side of migraine).
We also calculated the side difference between left and right side for both groups. In migraine patients with aura the VEFR% difference was 4.70 ± 18.46 in favour of the right side, which was a tendency to be significantly different from zero (P < 0.05). In controls the VEFR% difference was 0.60 ± 7.33 (P = NS) in favour of the right side.
Discussion
Persisting asymmetry as a correlate of interattack perfusion changes?
In our study, fTCD of both PCAs showed a significant side difference of the VEFR in patients with MA, correlating in two-thirds with the affected hemisphere. We also found a significant asymmetry of the VEFR% response in the control population, but at significantly lower levels.
This asymmetry in MA is consistent with the well-known asymmetric distribution of perfusion and metabolism (26, 27) associated with CSD (7), and persists beyond migraine attacks. So far, our knowledge about the amount, time and territorial distribution of these changes has been limited due to the technically complex and invasive methods used so far. Such problems could now be overcome by non-invasive fTCD studies, which allow continuous monitoring and sequential follow-up at any time.
Records of the VEFR of the PCAs are most sensitive to aura-associated perfusion changes. Presuming a largely constant calibre of the PCA, the changes of the CBFV reflect changes in cortical activation (28). As the basic vascular properties of both groups are the same without significant differences between the two groups for maximal and minimal CBFV (V max, V 0), the side difference does not reflect structural differences or asymmetries in vascular territories. Therefore the asymmetry of the VEFR is likely to reflect ongoing persisting vasomotor changes in MA patients. Conversely, asymmetry of VEFR is a complementary diagnostic hint to support the diagnosis of MA in cases of doubt.
A certain asymmetry in control subjects seems to be physiological. There is a tendency towards higher responses on the right side than on the left side. This might be due to the fact that pattern recognition is predominantly located on the right hemisphere (29) and fTCD simply reflects brain function, similar to other functional imaging techniques.
As aura symptoms are usually generated in one preferential hemisphere, we looked for a correlation of the vascular changes with the clinically affected side. Such an association was found in 61% of patients with MA. For symptoms of the left hemisphere a tendency for a higher VEFR% on the contralateral side was observed, whereas for the right hemisphere no statistically significant asymmetry was found. The lack of a clear association between the side of the symptoms and vascular changes can partly be explained by the fact that patients may have symptoms of either hemispheres, thus a precise association with one side is difficult. Furthermore, patients were not always sure that they remembered which side had been affected during the last episodes. Besides, knowledge regarding intermittent perfusion changes outside the attack is quite limited, but vasomotor instability may change perfusion on either side. Assuming a quantitative factor with a certain threshold in the perfusion changes before becoming symptomatic, we were able to observe differences in fTCD that do not have to be associated with the predominantly symptomatic side. In summary, the missing association, in some cases concerning clinically affected hemisphere and asymmetry in fTCD response, may be an indication that over the time course perfusion changes are not constant and can even affect the clinically silent hemisphere.
Comparison with previous studies
Conventional TCD studies in migraineurs have provided hints for an altered vasoreagibility in this disease (30). However, fTCD is a more sensitive tool to quantify such changes, and this may lead to a higher proportion of patients displaying persisting perfusion asymmetries using this technology. Nevertheless, even using functional methods in previous work, asymmetric perfusion has not always been reported (19, 23).
Early fTCD studies in the MCA territory did not demonstrate asymmetry of evoked flow in the attack-free period using hypercapnia and mental/motor activity as a stimulus (31). This may be related to small group sizes, insufficient stimulation paradigms and less refined fTCD techniques. MCA recordings are also less valid for documenting persisting vasomotor changes in patients with MA predominantly affecting the PCA territory.
Furthermore, it is important to use a complex, coloured, visual stimulus resulting in maximum activation of the primary and secondary visual cortices (V1–V5): the larger the potentially responding cortical area, the higher are evoked flow responses, which permits better differentiation of asymmetries compared with studies using a simple black/white checkerboard as a less complex stimulus (V1–-V2).
Although the VEFR% was not significantly higher in migraine patients compared with controls, responses were higher compared with VEFR% values in the literature (19, 22). This could be due to the composition of our control group including patients with MoA. This subgroup had a slightly higher VEFR% than the other controls, even if not significantly so. However, the reported studies did not focus on a potential side-to-side difference. The frequency of attacks may also have an impact on the height of asymmetry; this hypothesis is subject to additional clinical studies. One could argue that less asymmetric stimulation responses may be associated with different types of aura symptoms, e.g. symptoms of the MCA territory such as hypaesthesia or aphasia, which would not be associated with vasomotor changes in the PCAs. This hypothesis could not be verified in our study sample, since the 16 patients with aura symptoms of the MCA territory showed a mean asymmetry of approximately 13%.
Diagnostic statement and clinical implications
For clinical purposes we suggest defining a cut-off point at 15% of side difference to separate MA patients from controls. This would be a highly specific (98%) though not very sensitive (43%) test—a cut-off point at 7.5% with a specificity of 70% and a sensitivity of 64% might serve as an alternative.
With 15% of VEFR% side difference we may miss some patients with MA, but a threshold diagnostic value was helpful to separate MA from TIA, ictal episodes or functional disorders causing migraine mimics in selected cases. However, we consider this test helpful to better understand the pathophysiology of migraine rather more than a diagnostic test permitting diagnosis of each single patient correctly.
Further investigations will show if fTCD is a suitable tool to monitor treatment effects. Previous findings suggest a change of cortical reactivity evaluated with visual evoked potentials in migrainous patients after initiation of a prophylaxis with β-blockers (32).
In conclusion, patients with MA have a significant asymmetry of fVMR responses from bilateral TCD–PCA recordings, which reflect post-attack persisting vasomotor changes. fTCD studies, in addition to clinical features and further diagnostic procedures, are useful tools improving the diagnostic work-up of patients with MA and overlapping other pathophysiological entities. Underlying vascular mechanisms in MA are present even in the symptom-free state. Further investigations will evaluate the potential use of this method in monitoring the effect of prophylactic medication.