
Abstract
Cortical hyperexcitability in migraine could arise from abnormally weak inhibition or from strengthened intracortical excitatory mechanisms. The present study employed binocular rivalry to differentiate between these possibilities. Rivalry between static oriented grating patterns was examined in migraine with aura (MA), migraine without aura (MoA) and headache-free control participants. A non-significant trend toward elevated mean dominance intervals (monocular percepts, in seconds) was seen in both migraine groups at all contrasts. Second, significant interocular differences in rivalry dominance durations were seen in the MoA group compared with controls; this difference also approached significance in the MA group. Finally, both MA and MoA exhibited significantly greater visual discomfort than the control group in the presence of both static stripes and flickering visual stimuli. The rivalry results provide no support for weakened intracortical inhibition in migraine. Optical or neural precortical differences in the eyes' input strengths paired with enhanced recurrent cortical excitation can explain these findings.
Introduction
Heightened sensitivity of the sensory systems is the hallmark of migraine both during episodes and interictally. In the case of vision, this takes the form of photophobia (1) during migraine episodes (2) and susceptibility to discomfort and visual illusions in the presence of intense or repetitive patterns of visual stimulation interictally (3–6). Furthermore, intense visual stimulation can apparently trigger attacks (7, 8) in some individuals, and a high preponderance of the auras or focal neurological disturbances experienced preceding headache onset are visual (9, 10). Hypersensitivity is generally (although not necessarily correctly) taken to mean neural hyperexcitability.
At the cortical level, there is divided opinion as to whether the brain is hypo- or hyperexcitable in migraine (11–17). The present work was motivated by the hypothesis that the visual cortex in migraine is hyperexcitable. The argument within this framework would be that visual discomfort in the presence of striped patterns or flickering lights arises because the cortical regions tuned to these visual properties are being driven more strongly in migraine than in headache-free individuals, reaching saturation at lower contrasts.
Hyperexcitability is also viewed as setting the stage for visual auras. Cortical spreading depression (CSD) is widely seen as the underlying neuronal process supporting auras (18). Since CSD involves a wave front of neural depolarization, the notion that some, or all, cortical visual areas have lower than normal thresholds for generating this form of excitatory wave has gained widespread support (19, 20). The recent report of a lower threshold for triggering CSD in a knock-in mouse model of familial hemiplegic migraine (21) (calcium channelopathy) has lent support to this line of reasoning.
In principle, cortical hyperexcitability might arise either from factors that directly amplify excitatory neural mechanisms or it might be a product of weakened inhibitory mechanisms. Clearly, any imbalance that exists chronically cannot be too great, as this would lead to run-away excitation and seizure. There have been numerous attempts to garner evidence in support of either enhanced excitation or reduced inhibition using psychophysical (6, 14, 22), electrophysiological (16, 23, 24), transcranial magnetic stimulation (25–28) and functional magnetic resonance imaging (fMRI) (29–31) approaches. Most of this work has been framed to provide positive evidence for the inhibition model. Backward masking (12, 22, 32), contrast gain control (33, 34) and orientation discrimination thresholds (17, 35, 36) have all been tested as indicators of strength of inhibition, and in each case the findings have been mixed. A problem with all of these studies is that they do not provide a direct way of assessing both enhanced excitation and reduced inhibition in the same paradigm. For this reason, we have utilized binocular rivalry in this study.
Normally we see very similar but not identical images in our two eyes. The visual system matches the similarities and extracts the disparities to derive information about the third dimension (stereoscopic depth). However, when faced with patterned inputs so different that they are very unlikely to be derived from images of the same visual scene, competition occurs between the two sets of monocular information (37). For example, if one views a red horizontal grating pattern in one eye and a green vertical pattern in the other eye simultaneously, one does not see a plaid pattern in some intermediate colour; rather one sees the two images alternate every 1–2 s on average. Only at very low contrasts or briefly at stimulus onset is a combination of the two perceived as overlaid. For large images, the alternation is a patchwork with parts of each monocular image perceived simultaneously; in general, regions compete, not whole eyes. However, if the unmatched area is kept to ≤ 2° of visual angle, complete rivalry will occur, with one image replacing the other in a wave like a curtain moving across the field. This process has received enormous attention in the vision literature because of its implications for conscious awareness (38–40); in addition to psychophysical studies, there are computational models of the underlying neural networks (41–43) and fMRI evidence of rivalry in a variety of brain structures (40, 44, 45). There has been extensive discussion about the level of visual processing at which rivalry occurs, and there may be different answers depending on stimulus complexity. However, there is very strong evidence from fMRI that rivalry between simple patterns such as oriented gratings occurs in V1 (striate cortex) (46, 47). As we based our stimuli on patterns showing strong rivalry in V1, we are confident that we are studying primary visual cortical function.
Although the details vary, all models of binocular rivalry entail a balance between excitatory and inhibitory processes. In the model on which we based the present work (48), populations of monocularly activated neurons amplify their input through recurrent excitatory connections among one another; interactions between the populations representing the two eyes are via reciprocal inhibition. The strength of the incoming visual drive through one eye will be reflected in the strength of the inhibition from that eye onto the other eye's neurons. The eye dominating perception at a given point in time will be the eye generating the strongest inhibition. However, over time, hyperpolarizing membrane changes in the excitatory neurons (49) lead to a weakening of that eye's control over inhibitory neurons, leading to the escape of the second eye from the inhibition. In this model, changes in different components of the circuit produce predictable changes in the rate at which eye alternation occurs. If the strength of the recurrent excitatory loop is increased (e.g. by increasing the strength or number of active glutamate synapses), the length of time an eye would maintain its dominance would be predicted to increase. Abnormalities that reduce the strength of after-hyperpolarization (or spike frequency adaptation) would similarly lead to increased dominance durations (DD). On the other hand, if reciprocal inhibitory links were weakened, the opposite effect would occur—the suppressed eye would escape inhibition more rapidly than in the normal state if all else were held constant. All three of these alterations, despite predicting different outcomes in rivalry, would result in a hyperexcitable cortex—one that amplifies inputs more, responds longer to a fixed drive, or is less damped by tonic inhibition than the normal brain.
We set out to examine the balance between excitation and inhibition in V1 binocular rivalry by having participants view oblique gratings tilted in opposite directions (45° and 135°) in the two eyes. By tracking the visibility of the two patterns by pressing one or other of two response keys (or both in the event that a combination of the patterns was seen), migraine and headache-free participants tracked alternations in dominance by the left and right eyes over short periods. Rivalry rates are typically described as mean DD calculated over a series of alternations. For equivalently strong stimuli in the two eyes, mean DD is normally approximately equal in each eye. Rivalry rate is sensitive to a number of stimulus parameters. It slows as stimulus contrast is reduced, provided contrast is equated in the two eyes (37, 50). At very low contrasts, rivalry may give way to fusion where a mixture of the two images is perceived simultaneously (in the present case, as a plaid) (51). Selectively weakening the stimulus in one eye (by reducing its contrast) greatly increases the average DD of the higher contrast eye while producing little change in the DD of the lower contrast eye (52). In the present study, we varied stimulus contrast symmetrically in the two eyes, leading to the prediction that DDs would be equal in the two eyes at any given contrast but would increase as contrast was reduced. We compared rivalry rates in both migraine with aura (MA) and migraine without aura (MoA) with the rates displayed by headache-free controls.
Methods
Participants
This study was approved by the ethics review boards of York University and the University Health Network. Subjects were recruited by advertisement posted at York University. All potential participants first underwent a standardized telephone interview. The design of the questionnaire allowed for confirmation of the International Headache Society (IHS) 2004 criteria (2) and screening for medical and ocular exclusionary criteria. With the written consent of the participant, migraine diagnosis was confirmed by the patient's primary care physician whenever possible.
Forty migraine participants fulfilled the IHS criteria (2004) for migraine (see Table 1 for participant details). The MoA group consisted of 17 women and three men (mean age 25.85 ± 7.31 years); the MA group comprised 15 women and five men (mean age 24.95 ± 8.07 years).
Group characteristics

The control group consisted of 20 subjects who did not suffer from migraine or any other type of severe headache and who reported fewer than one tension headache per month. They were matched as closely as possible to the migraine groups in age and gender (18 female and two male, mean age 25.4 ± 6.8 years) and reported no family history of migraine headache.
Subjects were excluded if they were taking prophylactic medication for migraine or for mood disorders (anxiety, depression) or had a history of severe head or neck injury. They were also excluded if they suffered from diabetes, cardiovascular disease, any visual abnormality not corrected by optical lenses (e.g. amblyopia) or any cognitive or neurological disorders that may affect vision (epilepsy, optic neuritis, multiple sclerosis).
All participants had normal stereopsis, normal or corrected to normal visual acuity and were able to read text in Arial 10 point font at the testing distance of 1.14 m. Monocular and binocular acuities were measured using the Snellen eye chart at a distance of 6.1 m. Contrast sensitivity was measured using the Pelli-Robson letter chart (Clement Clarke International Ltd, Harlow, UK) and stereopsis by the Stereo Fly Test (Stereo Optical Co., Inc., Chicago, IL, USA). Eye preference was determined by noting which eye was used to find a target through a small hole in a card held at arm's length.
Participants were tested in headache-free periods at least 5 days after a headache. A follow-up telephone call was conducted 3 days after testing to determine if the participant had experienced a headache following the experiment. Three participants reported migraine headaches within 3 days after testing (two MoA and one MA).
Apparatus and stimuli
Visual stimuli were generated on a MacIntosh G4 computer using VPixx™ software (VPixx Technologies, Inc., Montreal, QC, Canada) and presented on a 19-in CRT computer screen (Samsung) at a resolution of 800 × 600 pixel and a frame rate of 120 Hz. A Crystaleyes® workstation and liquid crystal goggles (Stereographics, San Rafael, CA, USA) were synchronized with the computer. Using this method, separate conflicting images were presented to corresponding retinal locations of the two eyes. When relevant, the goggles were worn over the individual's normal spectacle or contact lens correction.
A stationary sine-wave grating with a spatial frequency of 3.2 cycles/degree (c/deg) was presented foveally in a circular patch subtending 2° of visual angle with a different orientation presented to each eye (45° or 135°, Fig. 1).
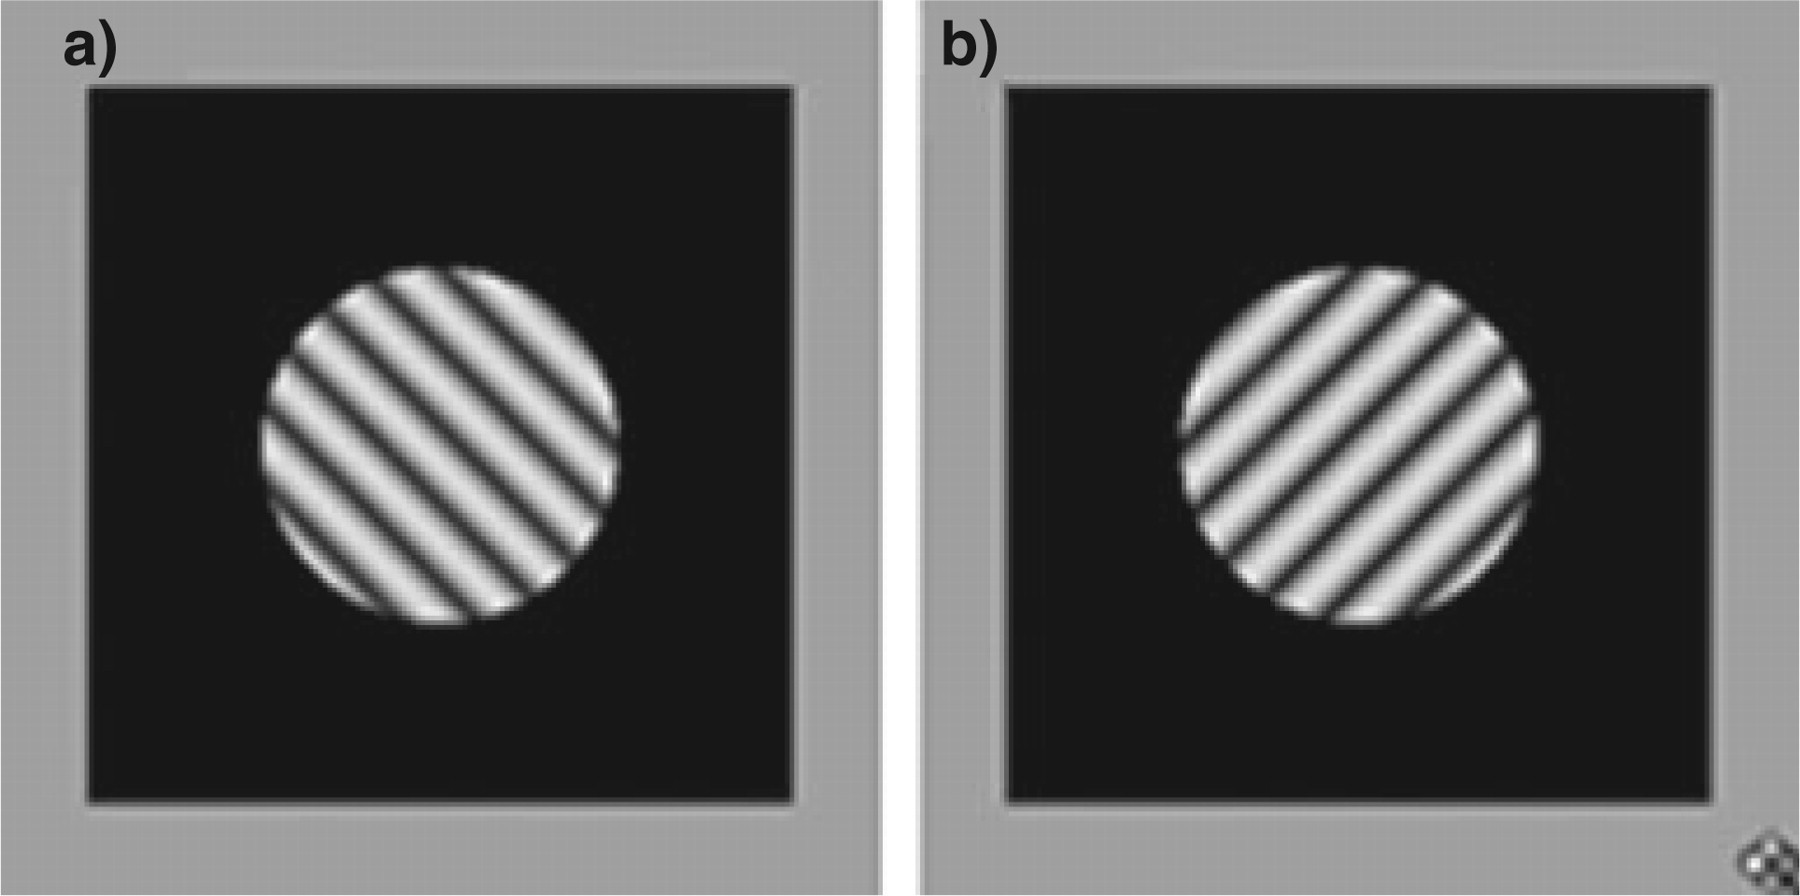
Sinusoidal grating stimuli presented foveally to the left eye (a, 135° tilt) and right eye (b, 45°) simultaneously to induce binocular rivalry. Grating spatial frequency was 3.2 c/deg and grating diameter was 2° of visual angle. Three grating contrast levels were tested: 92%, 29% and 12%.
The surrounding 4° × 4° rectangular region had a luminance of 0.9 cd/m2 and was identical in the two eyes allowing for fusion of the frame. Binocular rivalry was tested at contrast levels of 92, 29, 12% when measured through the goggles.
Binocular rivalry—procedure
Subjects were seated in a chair positioned 1.14 m from the computer screen in a dimly lit room. Head position was maintained with a chin rest. All subjects went through a training process to insure that they were familiar and comfortable with the task because none had previous experience in binocular rivalry. After training, a 2-min simulated rivalry movie was presented in order to ensure that subjects understood the instructions and to monitor responding to the stimulus. Responses were made on a Cedrus RB 530 respond pad (Cedrus Corp., San Pedro, CA, USA). The participants' task was to track their percept by pressing the left key down while perceiving the pattern oriented at 135° (top tilted to the left), and the right key when perceiving the pattern oriented at 45° (top tilted to the right). When the image was fused in a plaid or a stable mixture of both, both buttons were pressed at the same time. The button press data were recorded using a custom program written in Matlab (The MathWorks Inc., Natick, MA, USA).
All subjects completed four runs at each contrast level for a total of 12 counterbalanced binocular rivalry experimental runs. Each run lasted 120 s. Subjects were asked to wait between runs until any afterimages had disappeared (2–5 min).
Binocular rivalry—data analysis
The raw data files of temporal sequences of left and right response key onsets and offsets were converted into sequences of intervals of left eye dominance, right eye dominance, and shared dominance (when both keys were depressed simultaneously). Shared dominance intervals of < 200 ms were omitted from analysis as they were assumed to represent brief periods of overlap as the percept shifted from one eye to the other (41) rather than fused plaid percepts.
Participants completed four 2-min rivalry tests at each of three contrasts. The data from the four tests were combined to produce single sets of left, right and both dominance intervals for each participant and contrast condition.
In binocular rivalry, the distributions of eye dominance intervals are typically positively skewed, with a few very long dominance intervals, and are therefore best modelled by gamma rather than normal distributions. However, in the rivalry literature, mean dominance interval is the most commonly used measure of rivalry performance. In a preliminary analysis of a subset of the present data, we found very strong correlations among three measures of central tendency (mean, median, gamma peak) (r = 0.87–0.99; P < 0.01 in all cases), and therefore our principal analyses are carried out using means to allow direct comparison with the existing literature.
All datasets (for each migraine group and contrast condition) were evaluated using the Kolmogorov–Smirnov test of normality. Datasets meeting the normality criteria were analysed using split-plot
Visual discomfort—procedure
Visual discomfort was assessed at the end of the session. The discomfort test began with a homogenous grey screen of 45 cd/m2 luminance. When the trial was initiated, a vertical square-wave grating pattern (Stripes test) with a spatial frequency of 3.2 c/deg and a contrast of 1% appeared on the screen. After 5 s, contrast was increased in increments of 10% every 5 s until the subject indicated that the pattern had become aversive by pressing a key on the computer keyboard to abort the test, or until 100% contrast was reached. This procedure was repeated five times. This was followed by five trials with a uniform flickering field filling the whole screen, temporally modulated at 10 Hz (Flicker test). Again, contrast was increased from 1% in steps until the abort key was pressed or until 100% contrast was reached.
Visual discomfort—data analysis
Average discomfort thresholds were calculated separately for Stripes and Flicker based on the five trials on each task. In order to produce a discomfort scale based on log contrast, on which higher scores indicated greater sensitivity, the follow formula was used: Discomfort Score = log (1/threshold contrast). On this scale, a score of 0 indicates that the participant did not experience discomfort over the entire contrast range, a score of 1 indicates a discomfort threshold at 10% contrast, and a score of 2 a threshold at 1% contrast.
Results
Rivalry
There is no a priori reason to expect that left and right eye dominance intervals would vary in any consistent fashion across individuals, and paired t-tests showed no significant differences between left and right eye means in any condition (P > 0.05 in all cases). Since there was no evidence of a significant bias favouring the same eye consistently across all subjects, ruling out a role for eye or hand preference (most participants were right handed), we treated the left and right eye datasets in two ways. First, left and right eye scores were averaged for each participant, producing a set of average rivalry DD scores, which were compared across groups and stimulus contrasts as described below. Second, because it was noted that many individuals did show idiosyncratic interocular differences (IOD) in mean DD, we re-sorted the individual left and right eye scores into longer and shorter duration eyes and examined IOD in dominance intervals from this perspective.
Average dominance scores
None of the datasets of average DD failed the Kolmogorov–Smirnov test for normality. Using ± 3
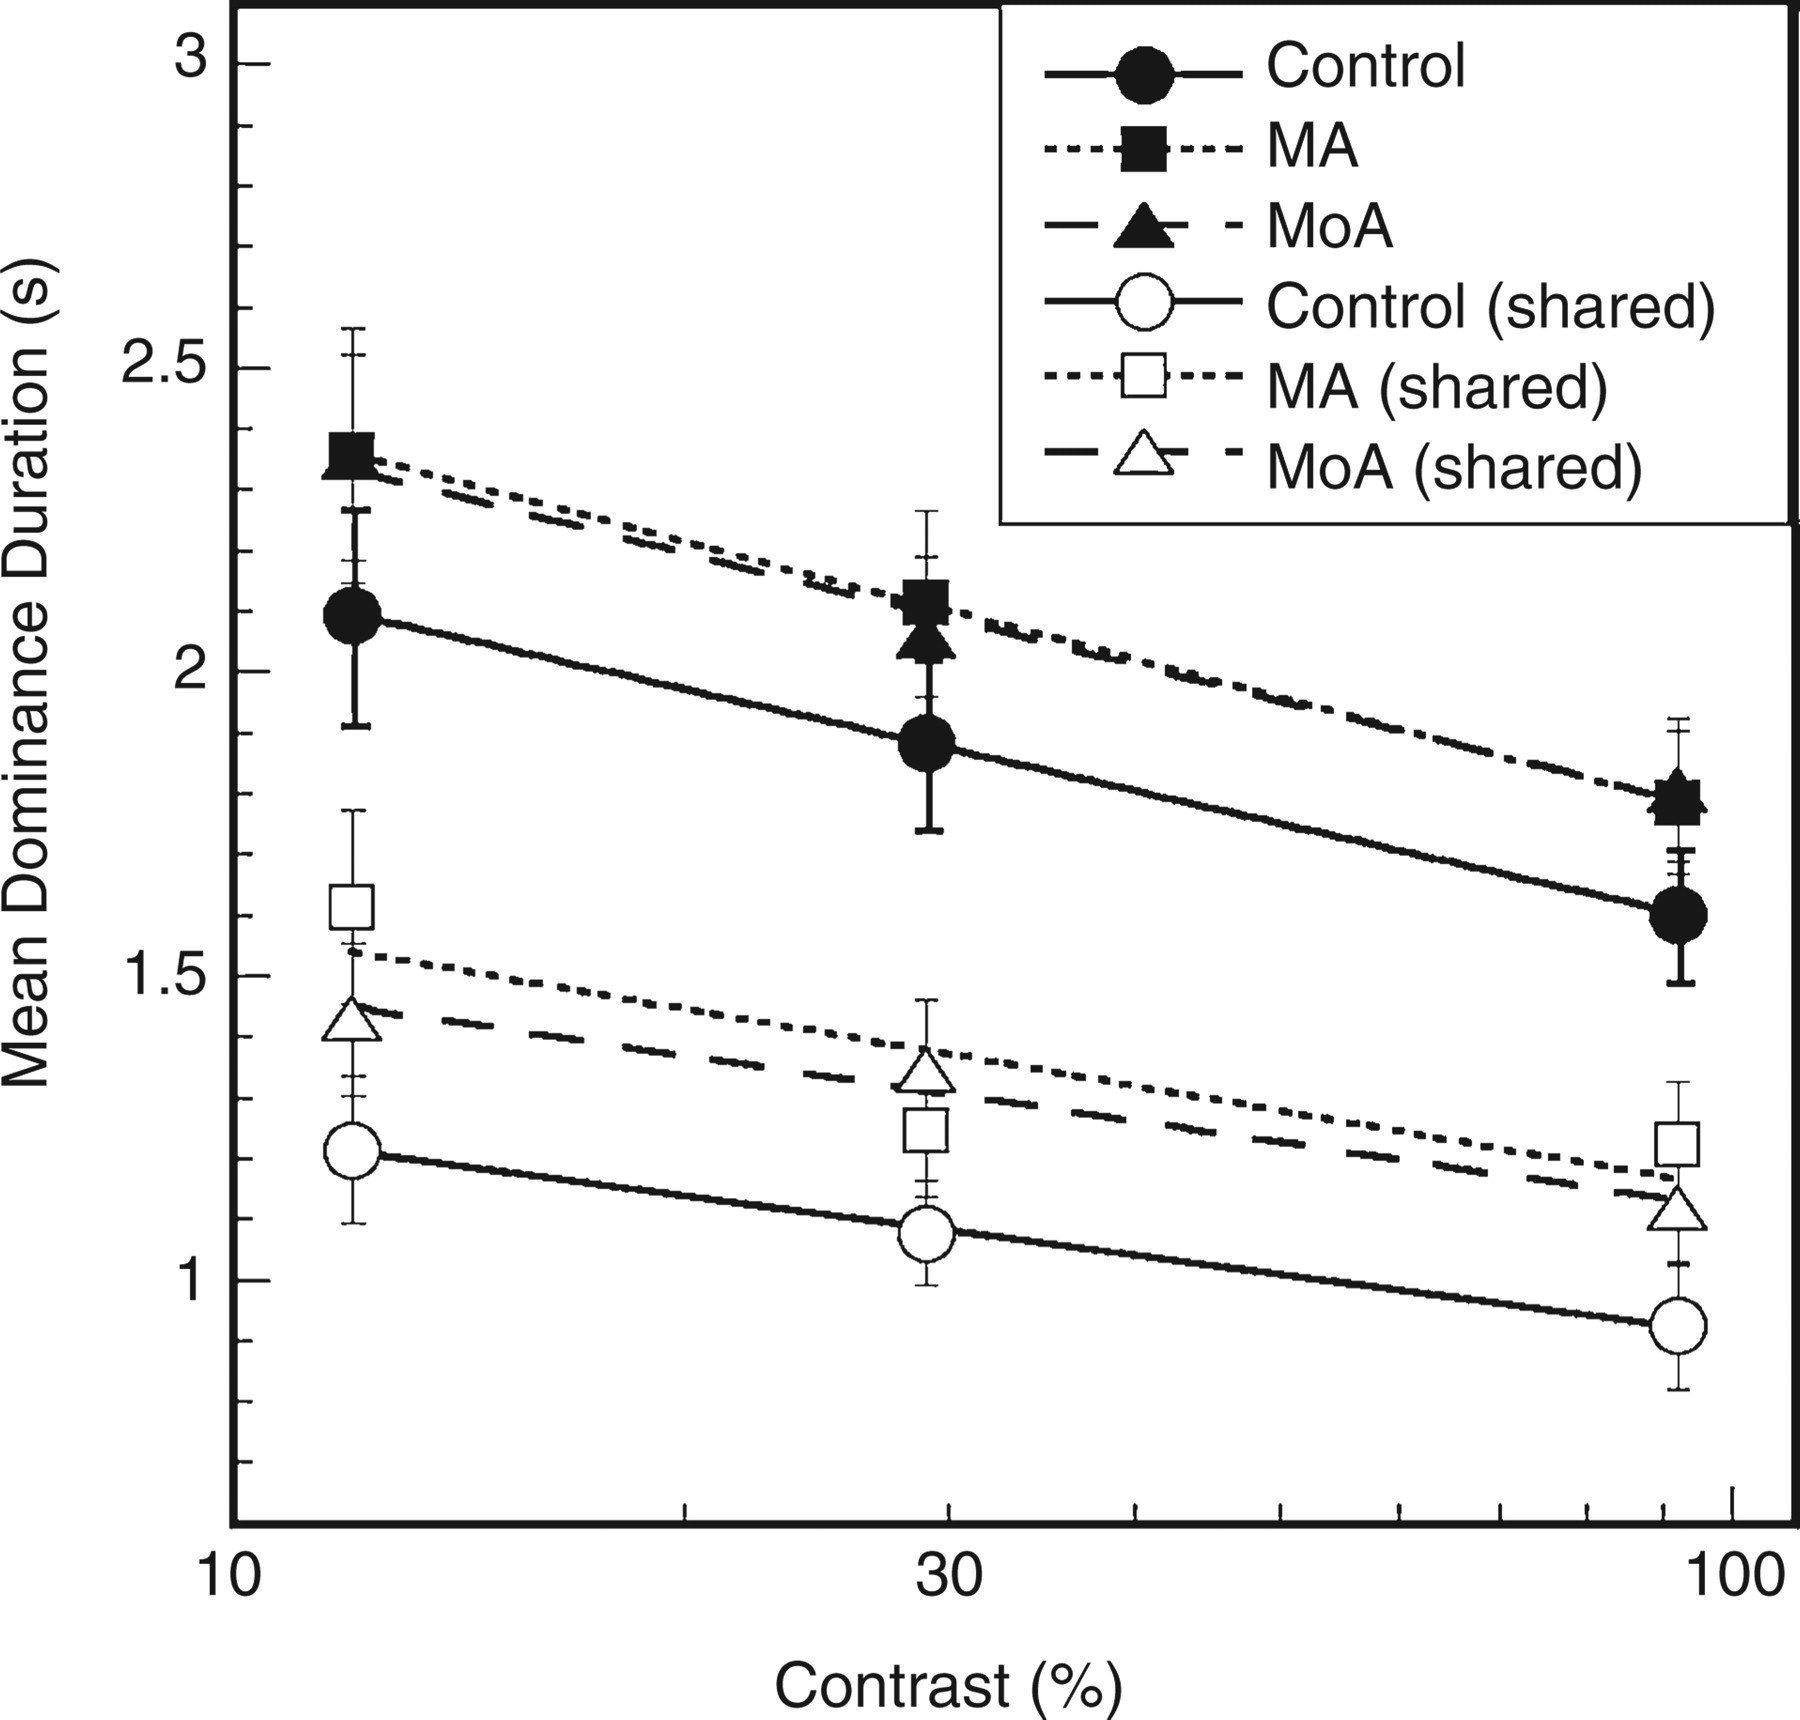
Dominance duration (DD) plotted against stimulus contrast. Solid symbols represent mean DDs during rivalry intervals when one or other eye dominated, averaged across eyes; open symbols represent intervals of shared dominance. Error bars = ± 1
As can be seen in Fig. 2 (filled symbols), mean DD decreased with increasing contrast in all groups, and at every contrast duration was slightly lower in the control group than in the migraine groups. Repeated measures
We also examined the average duration of intervals of shared dominance (when both response buttons were depressed). These intervals were briefer overall than the rivalry intervals where one or other eye dominated (Fig. 2, open symbols). Because some datasets failed to meet the normality criterion, the data were analysed using a split plot
Interocular differences in dominance duration
IODs in mean dominance interval were obtained by subtracting the left eye score from the right eye score for each participant. In Fig. 3a–c, IODs are displayed for each participant at each of the three test contrasts. Negative scores indicate longer dominance intervals for the left eye.

Interocular difference in mean dominance interval for each participant at three contrast levels. Positive values indicate longer mean dominance in the right eye. Left-handed individuals are represented by filled symbols, and left eye preference individuals are indicated by arrows. (a) Control. (b) Migraine with aura. (c) Migraine without aura participants.
Control subjects (Fig. 3a) showed IODs in the range of ± 0.4 s, and individual performance was generally quite consistent across contrast levels. In the migraine groups (Fig. 3b, MA; Fig. 3c, MoA) the range of differences was much larger (−2 s to +3 s) and the degree of within-subject variability across contrasts was more striking. Although some migraine participants showed IODs clustered around 0 similar to the control data, large IOD scores generally favoured the same eye at all contrasts. There was no consistent relationship between the sign of the IOD in rivalry and either eye preference (see arrows in Fig. 3) or handedness (filled symbols).
Not surprisingly, the size of IODs tended to increase with mean DD. In order to examine IODs independent of sign (direction) and unbiased by the length of the rivalry intervals, an IOD ratio was calculated by dividing the absolute difference in DD between the left and right eyes by the DD of the eye with the lower score, and multiplying by 100. The distributions of these IOD ratios were highly skewed in all conditions (Kolmogorov–Smirnov test < 0.05 in all cases). In Fig. 4a–c box-and-whisker plots allow cross-group comparisons at each test contrast. At each contrast, the median IOD ratio in the migraine groups is higher than that of the control group, and the data are more strongly skewed. One individual in the MoA group (S#10) was an outlier at all three contrast levels, and the same MA outlier identified earlier (S#9) was an outlier at the two higher contrasts.

Box-and-whisker plots of interocular differences (IODs) compared across groups at each stimulus contrast. Solid black lines represent median IOD ratio values for each group. Circles represent outliers.
Split plot
Visual discomfort
As described above, a discomfort score of 0 indicates that visual discomfort was not experienced over the entire contrast range. For the stationary striped pattern, 13/20 control participants had discomfort scores of 0, whereas this was true of only 2/20 MA subjects and 4/20 MoA subjects. For the flickering stimulus, 5/20 control subjects had scores of 0; no MA subjects and only one MoA subject had discomfort scores of 0 for flicker.
Stripes and flicker discomfort scores (Fig. 5a,b) were compared separately across migraine groups using Kruskal–Wallis non-parametric tests because the data did not meet the normality criterion. Significant between-group differences were found for both stripes (P = 0.0001) and flicker (P = 0.0027). In both cases, the control group was found to have significantly lower discomfort scores than either migraine group (P < 0.004 in all cases), but MA and MoA groups did not differ from one another [Wilcoxon test, P = 0.28 (stripes), P = 0.25 (flicker)].
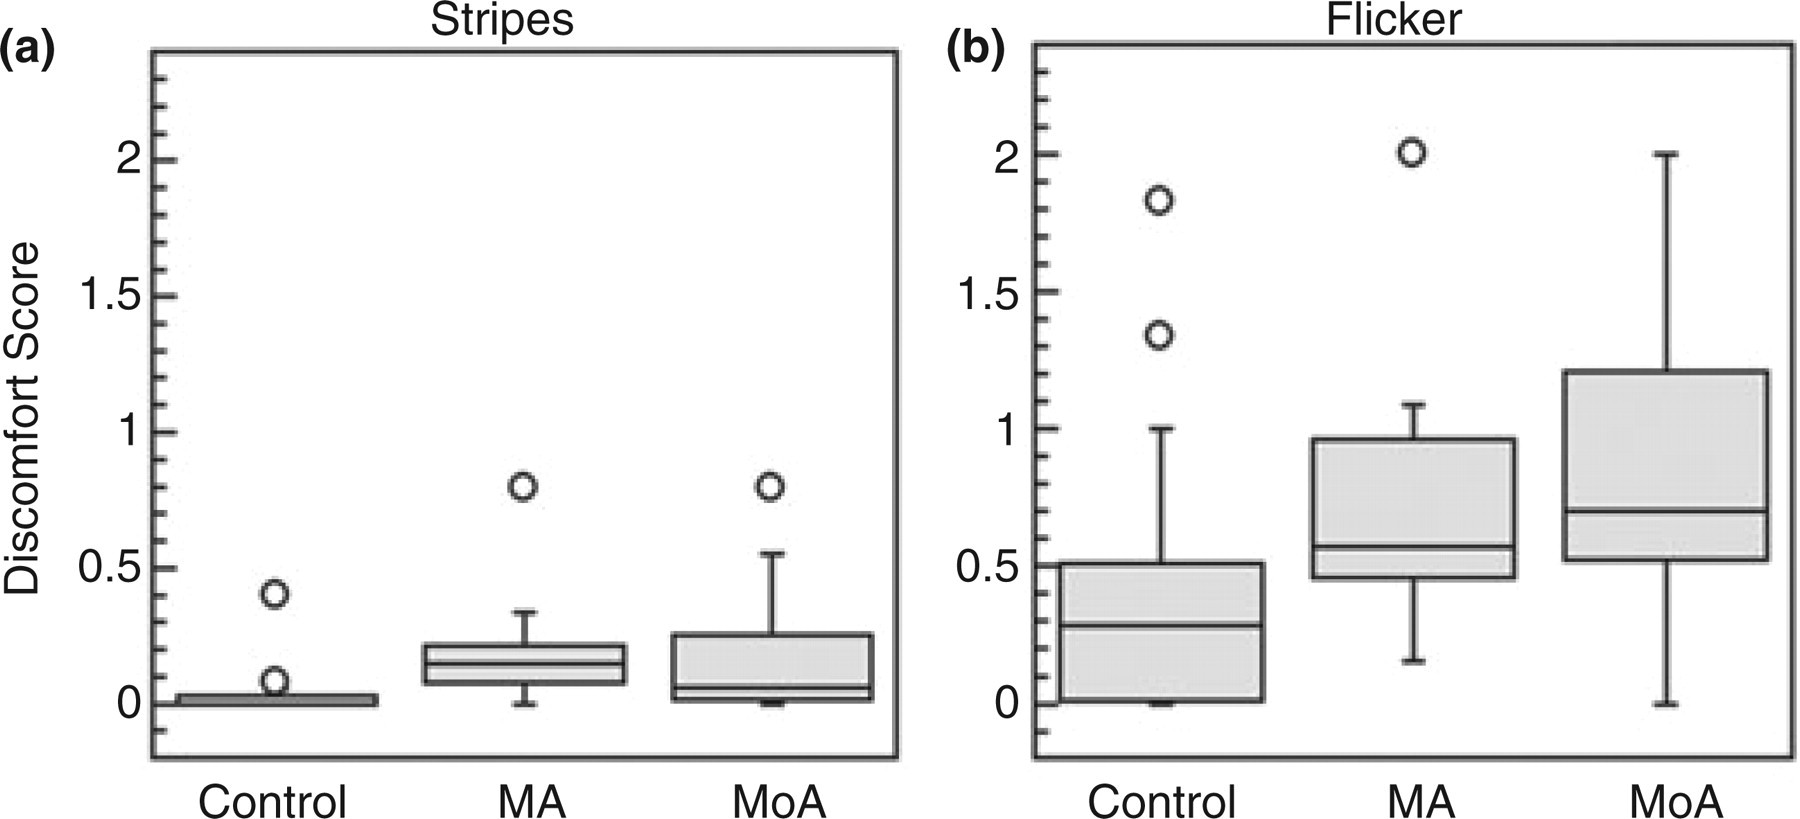
Box-and-whisker plots for cross-group comparison of discomfort scores. (a) Stationary stripes (3 c/deg square wave). (b) 10-Hz flicker. Circles represent outliers.
The correlations (Spearman's ρ for ranked data) between stripe and flicker discomfort scores, and between discomfort scores and rivalry measures (DD and IOD) were assessed for the MA and MoA groups separately. This was not done for controls because a large proportion of this group showed little or no discomfort. Stripe and flicker sensitivity were positively correlated in the MoA group (ρ = 0.54; P = 0.01). There were no significant correlations between any of the other measures; however, for the MA group, the relationship between IOD ratio and stripe discomfort was positive and approached significance (ρ = 0.44, P = 0.051).
Correlation with subject variables
Subject age was not significantly correlated with either the rivalry or the discomfort measures in any group (P > 0.05 in all cases). For the MoA group, we examined the correlations between the rivalry and discomfort measures and two migraine properties: duration (years with migraine), and frequency (episodes/year). No statistically significant correlations were found; however, years with migraine was positively associated with all measures and approached significance in the case of IOD ratio (ρ = 0.43, P = 0.058) and stripe sensitivity (ρ = 0.42; P = 0.066). For the MA group, aura frequency was examined along with migraine frequency and duration since not all episodes were accompanied by aura in most of these individuals. Surprisingly, migraine frequency and aura frequency were negatively correlated with discomfort to stripes (migraine frequency ρ = −0.54, P = 0.01; aura frequency ρ = −0.61, P = 0.004), but no other significant correlations were observed.
Discussion
In the present study binocular rivalry was used as a tool to explore the balance between inhibitory and excitatory components of visual cortical processing. Rivalry was selected because weakened inhibition and enhanced excitation, either of which might underlie cortical hyperexcitability, are predicted from computational models to affect the rate of rivalry in opposite directions (48). A reduction in interocular inhibition would allow a suppressed eye to escape more rapidly from rivalry suppression; hence rivalry rate would be predicted to be higher and mean DDs shorter as a consequence.
The present results provide no support for this prediction. Although not statistically significant, there was a clear trend for both MA and MoA groups to have longer, not shorter, dominance intervals than control subjects. This was true at all stimulus contrasts for both group means and group medians; furthermore, in every condition the lowest individual scores belonged to control group members. Longer intervals of shared rivalry were also seen in the migraine groups; again, this effect did not reach statistical significance. It is important to note that all groups showed normal modulation of rivalry rate with contrast: mean DD increased as contrast decreased, as described previously in normal observers (52). The second main finding of this study was that there was greater interocular imbalance in the rivalry dominance scores of migraineurs than of controls. This finding is important because it suggests that the abnormality affecting migraineurs on the rivalry task can have a selectively greater effect on the inputs from a single eye.
Finally, the present results replicate previous reports of elevated visual discomfort in migraine, in both MoA and MA (4, 54, 55), and emphasize that flicker is a more potent inducer of visual discomfort than static patterns of stripes. As reported by Shepherd (6), this elevated sensitivity to visual patterns, although much more prevalent in migraineurs than in controls subjects, does not affect every migraine participant. This suggests that visual pattern and flicker sensitivity may be a basis for subdividing migraineurs that is unrelated to the aura/no aura dimension as suggested by Shepherd (6).
Mechanisms underlying prolonged dominance
Previous fMRI studies of rivalry in healthy observers have provided strong evidence that rivalry between the simple oriented grating patterns used here arises at the level of V1 (primary visual cortex) (46, 56, 57). Area V1 receives separate inputs from the layers of the lateral geniculate nucleus (LGN) where left and right eye inputs are spatially segregated. V1 contains populations of monocular neurons in layer 4 partially segregated in ocular dominance columns (58), the outputs of which converge on binocularly driven pyramidal cells. Normally, these pyramidal cells are activated binocularly when signals representing the same visual feature seen through each eye converge on a common binocular neuron. Interocular suppression between monocular cortical neurons is mediated by GABAa receptors (59); the present results suggest that this inhibition is of normal strength in our migraine groups.
We hypothesized at the outset of this study that two variations in cortical networks might lead to slower alternation rates (longer DDs) in migraine. The first is a reduction in the strength of after-hyperpolarizing currents in excitatory neurons, leading to slower adaptation of the neurons activated by the dominant input and thus to slower release from inhibition of the suppressed eye. Since brainstem serotonergic inputs are known to modulate this after-hyperpolarizing current (49) and since serotonin has long been implicated in migraine (60), this is an interesting possibility. Dominance intervals in binocular rivalry have been reported to be lengthened in healthy individuals after taking psilocybin, an effect that appears to be mediated by 5HT1a receptors (61, 62). Conversely, individuals scoring high on an anxiety measure showed more rapid binocular rivalry than low-anxiety individuals, which would be in line with a hypothesized serotonin deficit in such individuals (63). However, serotonergic activity is generally hypothesized to be reduced interictally in migraine (60), and the trend toward lengthened dominance intervals reported here would argue for stronger serotonergic modulation of the cortex, not weaker. Therefore, it seems unlikely that brainstem modulation of after-hyperpolarizing currents in cortical neurons (at least by serotonin) can explain our findings.
The second intracortical change that could slow the rate of rivalry is strengthened recurrent excitation among similarly tuned cortical neurons, e.g. through collinear facilitation (64, 65). The overall trend toward longer DDs in the migraine groups is consistent with this explanation. A lengthy description of our rivalry model (48) is beyond the scope of this discussion; however, simulations with this model indicate that a moderate increase in the strength of recurrent excitation, in combination with a small (2%) IOD in input strength (see below), provides a reasonably good fit to our data.
Finally, it should be emphasized that we began from the hypothesis of cortical hyperexcitability in migraine and used our rivalry model to examine possible mechanisms of hyperexcitability. However, it is valuable to consider the data from the perspective of hypoexcitability models (e.g. (16)). Alterations of two of the factors we have considered, in a direction consistent with hypoexcitability, produce predictions inconsistent with our findings. Increasing the strength of the hyperpolarizing currents underlying spike frequency adaptation would have led to more rapid rivalry alternation rates, opposite to the observed trend. This would presumably also lead to more rapid habituation to repetitive visual stimulation, which is difficult to reconcile with reports in the literature of potentiation rather than habituation of the visual evoked potential, reversing only immediately before migraine episodes (reviewed in (16)). Weakened recurrent excitation within the cortex would lead to less amplification of inputs and, again, we would predict, to more rapid rivalry. This leaves strengthened inhibition as the only factor that would be consistent both with the present results and with cortical hypoexcitability. In our model of rivalry (48), there is a small range over which abnormally strong inhibition would be expected to lengthen dominance intervals; beyond this range, the dynamics drive the system into a winner-take-all regime in which one eye dominates indefinitely. Although we cannot rule out this explanation, it seems unlikely as it cannot easily account for the IOD in dominance (discussed below); this would require differential changes to inhibitory neurons driven indirectly by one eye vs. the other.
Possible sources of interocular differences in dominance durations
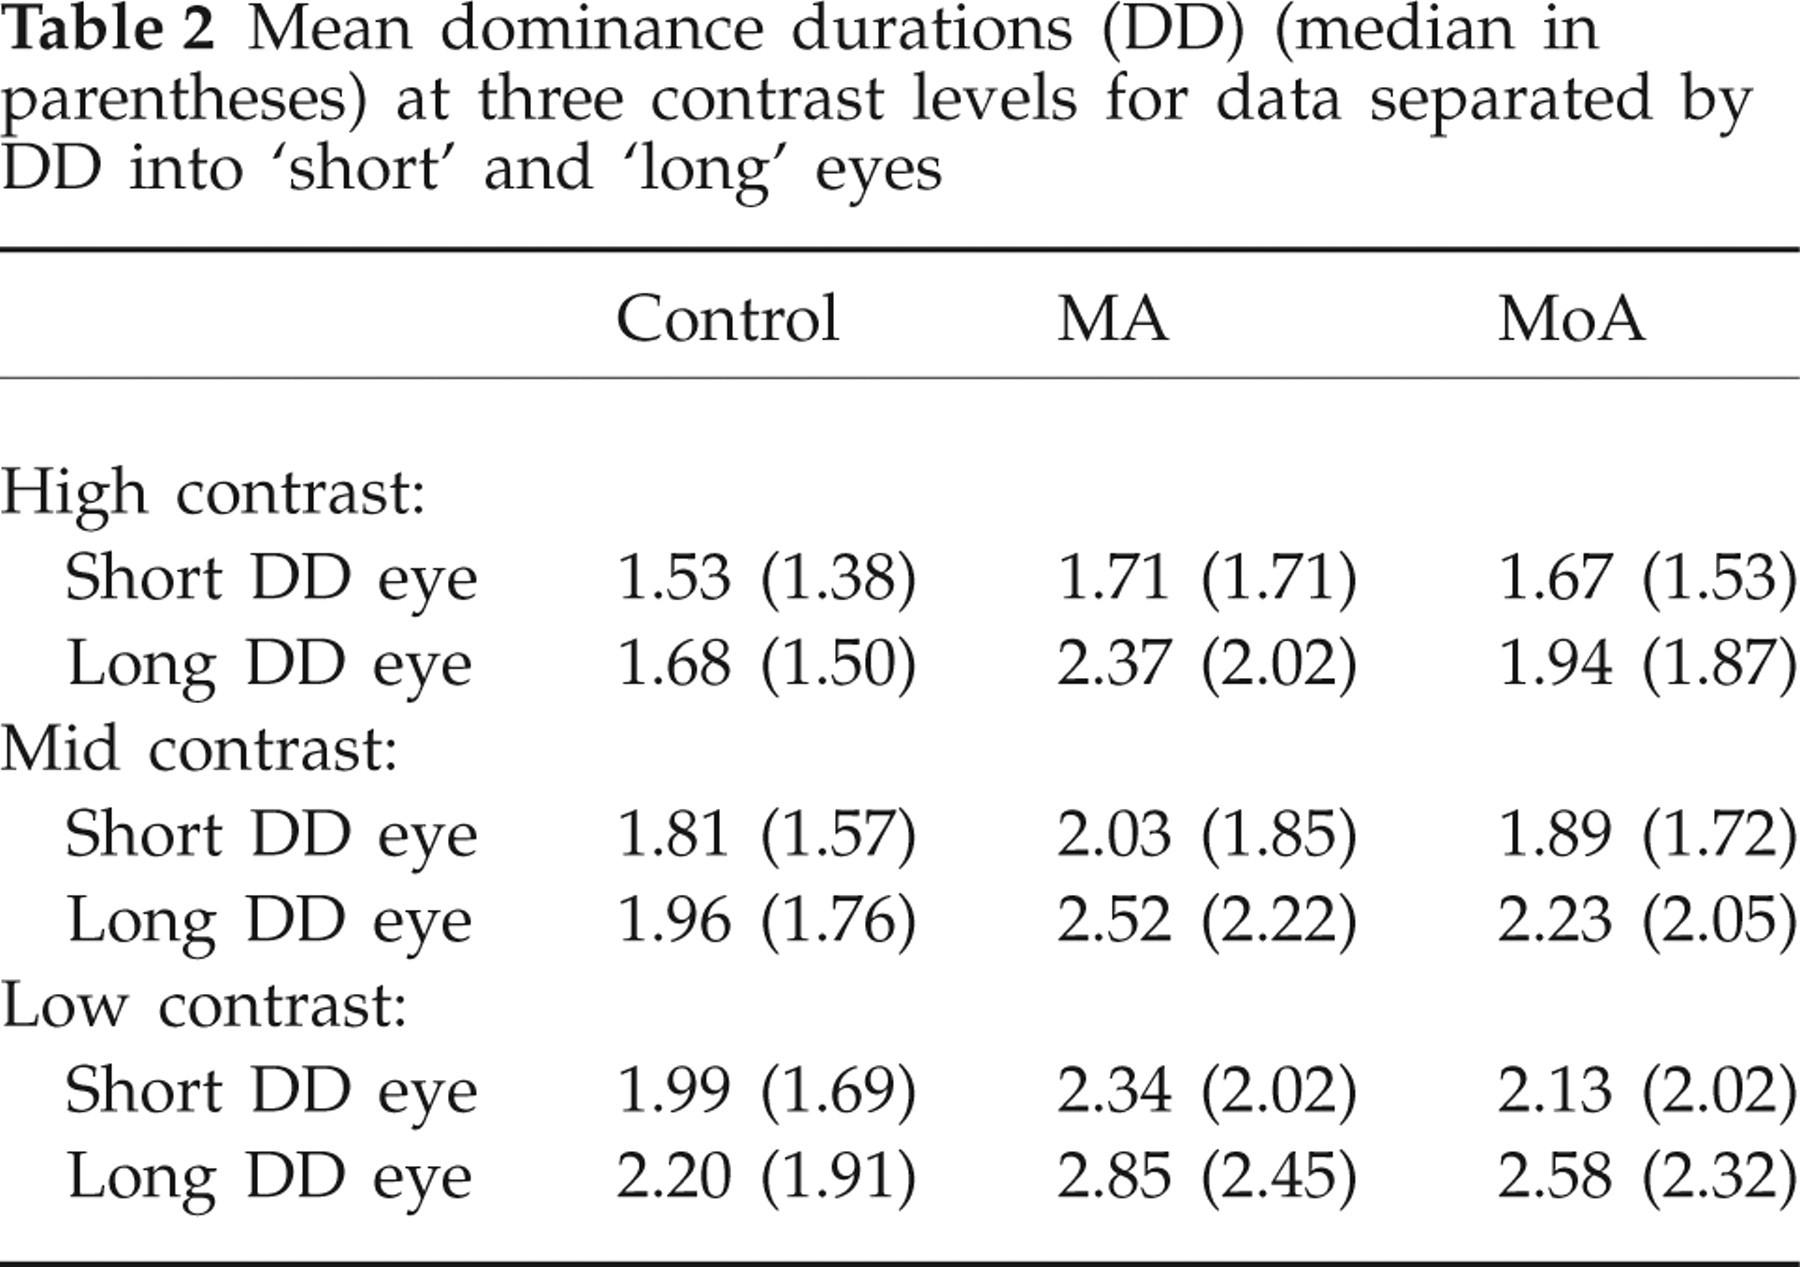
As illustrated clearly in Table 2, although migraineurs have longer DDs on average in both eyes than controls, the difference is greater for the eye with the longer mean DD. On average the means are 10% longer in migraineurs when the eye with shorter dominance intervals are compared, and 24% longer when the longer duration eyes are compared. This underlies the significant difference in IOD ratio described in the Results.
Mean dominance durations (DD) (median in parentheses) at three contrast levels for data separated by DD into ‘short’ and ‘long’ eyes
As described in the Introduction, unequal dominance intervals can be produced in normal subjects by altering the relative strength of the stimuli to the two eyes. The best known effect of this type occurs when contrast is reduced in one of the two patterns. Periods of dominance by the eye receiving the higher contrast stimulus will lengthen (50). Levelt has also reported similar effects when blur was introduced to one eye's image. This suggests that, in our migraineurs, the effective stimulus strength of one eye's input to the cortex has been altered. This difference may be quite small; as mentioned above, in our modelling of the results a 2% difference in the input values for the two eyes was sufficient to fit the data well. Both optical and neural explanations must be considered. Neurally, this could arise from influences at an early stage of the visual pathway, where the inputs from the two eyes do not overlap (retina or LGN of the thalamus), affecting the neural strength of one input relative to the other. The LGN, in which inputs from the two eyes are maintained in separate layers, contains both intrinsic inhibitory circuits and brainstem modulatory inputs including brainstem serotonergic axons. The role of serotonin in the LGN is complex, as it exerts presynaptic inhibitory influences on retinal axon terminals (66), excitatory effects on post-synaptic geniculate neurons, and it enhances intra-geniculate inhibition by exciting GABAergic interneurons (67). Thus, it is possible that changes in this complex circuitry could alter the signal gain for inputs from one eye selectively.
An alternative explanation is that our results arose due to small IODs in optics, which were magnified under the conditions of our test. Subtle abnormalities in the pupil size and light reflex, stereoacuity and heterophoria are reported to be more common in migraineurs than in comparable non-headache sufferers (68, 69). The stereoacuity of all of our participants was excellent since we used an exclusionary cut-off of 40 s of arc disparity. Very slight heterophoria is unlikely to affect rivalry. However, pupil changes, especially anisocoria, could affect the quality of the inputs in our task. The goggles used to present stereo images greatly reduced the overall luminance of the visual input, reducing the screen luminance to 11 cd/m2. We did not use artificial pupils; this would have been technically extremely difficult with the goggles and would have further reduced the effective luminance. All our participants wore correction for their refractive errors during the experiment, and had excellent corrected acuity and contrast sensitivity as tested in normal room lighting (Table 1); however, it remains possible that under the low light conditions of testing, enlarged pupils degraded optical quality unequally in the two eyes due to differences in spherical aberration. Increased blur and decreased contrast in the image of one eye introduced in this manner could account for the IODs seen. Anisocoria might also have enhanced the contribution of refractive factors disproportionately in one eye. In the studies reporting small IODs in binocular vision and pupillary light reflex, evaluations were done in room light (68, 69); these effects could be amplified under low light conditions. To determine whether refractive errors, although corrected, were responsible for the IOD effect described above, we re-examined this question in the subgroup of our subjects who were emmetropic (no refractive error in either eye). This subgroup comprised nine controls and 17 migraineurs (five MA and 12 MoA); the two migraine groups were combined to increase statistical power.
Conclusions
Overall, using binocular rivalry as a measure, we found no evidence of differences in migraine that would be indicative of weakened cortical inhibition, and only weak evidence of enhanced cortical excitation. The latter seems most likely to arise as a consequence not of intracortical differences between migraineurs and controls, but from differences lower in the visual pathway or in the optical apparatus of the eye. It should be emphasized, however, that our rivalry study was restricted to static patterns which would be expected to reflect rivalry between orientation-tuned neurons in cortical area V1. This cortical region is likely to be the substrate of auras with fortification phenomenology, although not necessarily of auras with other characteristics (70). Since there is considerable evidence that measures involving visual motion are particularly strongly affected in migraine (71, 72), and since binocular rivalry for moving and static patterns has been shown to involve different mechanisms (45), it would be interesting to extend the present paradigm to investigate binocular rivalry for moving stimuli.
Acknowledgements
This study was supported by the Canadian Institutes of Health Research (grant no. 49596), the Krembil Foundation and the Canadian Institute for Advanced Research.