
Abstract
A robust, visual masking test that was developed to be feasible with functional magnetic resonance imaging (fMRI) was used to examine the visual cortical inhibitory function in migraine patients with visual aura at both psychophysical and cortical levels. The study showed that the decreased visibility of a visual target was associated with a reduction in cortical activation in the primary visual cortex. The suppression of the transient on-response and after-discharge of neurons to the target was most likely to be responsible for reducing cortical activation, rendering the target less visible or invisible. The migraine patients were equally susceptible to visual masking and showed no difference in cortical activation when compared with age- and sex-matched non-headache controls, demonstrating that visual cortical inhibitory function was not impaired under the experimental conditions. Although these results are not in conflict with the general cortical hyperexcitability theory in migraine, they provide evidence to show the limitation to the theory.
Introduction
Numerous studies have concluded that the visual cortex of migraine patients is functionally hyperexcitable, particularly in those with associated aura (MA). An epidemiological study of 1044 women with migraine revealed that those with aura showed a high prevalence of visual sensitivity and that their attacks could be evoked by visual environmental stimuli (1). Sustained visual stimulation can promote a migraine attack in MA patients (2, 3). Certain stripe-like patterns that elicited epileptiform electroencephalographic (EEG) abnormalities in photosensitive epileptic patients produced intensive visual discomfort and illusion in individuals with frequent headache or migraine (4, 5). Our recent functional magnetic resonance imaging (fMRI) study elicited that black–white grating patterns with spatial frequency close to 1.2 cycle-per-degree (cpd) provoked illusions of colours, moving lines/spots and three-dimensional effects, and produced an increase in neuronal visual activity in migraineurs with aura (6). The hyperexcitability of the visual cortex in migraine has been suggested to be responsible for an increase in the amplitude of visual evoked potentials (7) and fast response time during visual attention tasks (8). Furthermore, phosphenes were elicited by occipital transcranial magnetic stimulation (TMS) at a lower threshold in migraineurs with aura than in non-headache controls (9). Migraine symptoms were also induced by repetitive visual stimulation in migraineurs with aura (2, 10). The significant correlation between the phosphenes induced by TMS and the headaches triggered by visual stimulation in the same group of migraineurs with aura suggests a common mechanism—the cortical hyperexcitability hypothesis underlies both observations (11).
Although the hyperexcitability hypothesis is supported by many studies, several studies reported contradictory results, including increased visual after-effects following pattern adaptation in migraine (12), a low prevalence of TMS-elicited phosphenes in MA (13) and an increased threshold of phosphene production for migraineurs both with and without aura (14).
The underlying mechanisms responsible for the visual cortex hyperexcitability in migraineurs, however, remain unclear. This cortical hyperexcitability could be caused by overactivity of the excitatory amino acids, glutamate, and possible aspartate (15). Another possible mechanism is that a deficit in cortical inhibitory processing causes the hyperexcitability in MA (16). In the primary visual cortex, GABAergic neurons form a diffuse horizontal network in lamina IV (17) and provide the intracortical inhibition to modulate the response of the primary visual cortex efferent to afferent excitatory information (18). Chronicle and Mulleners suggested that these neurons are very likely to be selectively damaged due to hypoperfusion/hypoxia occurring during the late phase of migraine aura (16). The degeneration of these neurons could lead to impaired visual inhibitory function in migraineurs with aura.
A novel psychophysical test, called visual masking, provides a unique technique to examine visual cortical inhibitory function in migraineurs. A briefly displayed visual target stimulus that is visible when presented alone can be rendered less visible or invisible if it is immediately preceded or followed by another stimulus (mask), known as forward or backward visual masking effect. A recent study of multiunit recordings, which were taken from the primary visual cortex (V1) in awake and anaesthetized monkeys during the presentation of visual stimuli that give rise to visual masking in humans, demonstrated that a forward mask suppressed the transient on-response of neurons to the target in V1 and a backward mask inhibited the transient after-discharge of neurons, the excitatory response that occurred right after the disappearance of the target (19). It is plausible to assume that the visual cortical inhibitory function is responsible for the suppression of these transient on-response and after-discharge of neurons to the target in V1, thus providing a means of examining the function in migraineurs. Impairment in the inhibitory function in V1, in migraneurs, could reduce inhibition of these transient on-response and after-discharge of neurons to the target, rendering the migraineurs less susceptible to visual masking. A recent psychophysical test that used a backward masking protocol reported that MA patients were significantly less susceptible to visual masking than patients with migraine without aura and non-headache controls, suggesting that it is the deficit in cortical inhibitory processing in the MA patients that was responsible for the cortical hyperexcitability (20). We recently developed a robust, fMRI-feasible visual masking protocol which produced a strong visual masking effect (21). Our preliminary study showed that the decreased visibility of a visual target is associated with a reduction in cortical activation in V1. In the present study, we utilized the protocol to examine the visual cortical inhibitory function in a group of MA patients and a group of age- and sex-matched non-headache controls at both psychophysical and cortical levels.
Methods and materials
Subjects
Ten migraineurs with visual aura (MA) (nine female, one male, age 24–50 years with mean ± SD = 37.6 ± 8.9) and 10 age- and sex-matched non-headache controls (NHC) (nine female, one male, age 24–51 years with mean ± SD = 36.4 ± 9.8) participated in the study. The migraine patients were recruited locally and were diagnosed according to the diagnostic criteria of the International Headache Society (22). The inclusion and exclusion criteria for both MA and NHC were described previously (6). In the migraineurs, self-reported migraine attack frequency varied from three episodes per month to 12 per year in the preceding 12 months, and aura was described as scintillation and scotoma. All migraineurs reported that most of their migraine attacks were preceded by visual aura and migraine headaches had occurred previously without aura. All but one of the migraineurs reported photophobia during migraine attacks and were sensitive to bright light. The University Committee on Research Involving Human Subjects at Michigan State University approved the study. Written informed consent was obtained from all subjects prior to the study.
Psychophysical test
Stimuli
A robust, fMRI-feasible three-pulse stimulus sequence, in which one mask stimulus preceded and another mask stimulus followed the display of a visual target stimulus, was developed and tested (21). This three-pulse stimulus sequence produces a strong visual masking effect, presumably by suppressing both transient on-response and after-discharge of neurons to the visual target. The time sequence of stimulus presentation consisted of fixation–forward mask–time delay–target–time delay–backward mask–fixation (Fig. 1). The forward mask (Mf) was displayed for 100 ms, and the target (T) and the backward mask (Mb) were displayed for 84 ms. The time delay (interstimulus interval) was varied to 0, 34, 100 or 500 ms. The fixation comprised a 0.3° cross white mark at the centre of the black background field. The target consisted of two vertical bars having the same spatial dimension, being offset to left or right from the centre of the display with an equal distance from the fixation, and being either in white (9.78 cd/m2) or light grey on a black background. The width and height of the bars was 1.5° and 7°, respectively. The distance between the centres of the two bars was 6.5°. Forward and backward masks had the same spatial dimension and were comprised of two white rectangular boxes with their inner surfaces coincident with outer surfaces of the targets. The width and height of the boxes was 2.5° and 8°, respectively. The stimulus presentation was programmed on a PC by using E-Prime (Psychology Software Tools Inc.), and displayed on a LCD, of which contrast and luminance were calibrated and set within a 5% error of the LCD used during fMRI.
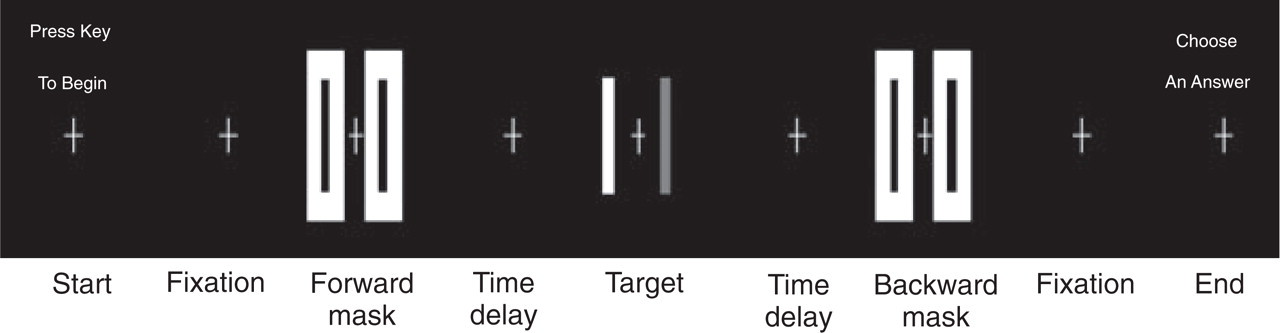
Stimuli flow chart for the psychophysical test. Each trial consisted of the sequence: fixation–forward-mask–time delay–target–time delay–backward-mask–fixation. The forward-mask was displayed for 100 ms, the target 84 ms and the backward-mask 84 ms also. Four values of 0, 34, 100 and 500 ms were chosen for the time delay.
Test
The subjects were seated 0.76 m from the PC monitor and were instructed to focus their eyes on the fixation mark. During the test, two different types of the targets were used: one target with both bars in white and the other with one bar in white and another bar in light grey. The subject was asked to detect whether or not the two bars were at the same grey level. Each condition was administered for 20 trials. The subject entered an answer by pressing one of two keys on the PC keyboard at the end of each trial, and the result was recorded automatically. Prior to the test, each subject had a pretest to establish the grey level of the light-grey bar for the experiment. During the pretest, only a target was displayed in each trial. Five different grey levels for the grey bar in the target were used and a total of 40 trials for each level were presented. The order of the trials was selected randomly. The grey level of the light-grey bar that was selected for the experiment was as close as possible to the grey level of the white bar while the subject was still able to detect the targets (error rate ≤10%).
Functional MRI study
FMRI protocols
The fMRI scan included three protocols: (i) a retinotopic mapping, (ii) a corticotopic mapping, and (iii) a visual masking protocol. The retinotopic mapping used phase-encoded polar coordinate stimuli that have been demonstrated to be an objective and reliable methodology to determine the borders of visual areas (23–25). During the retinotopic mapping, a half-field black–white checkerboard with contrast-reversing rate 4 Hz was presented. The checkerboard rotated around a fixation at the centre of the visual field and completed a cycle every 36 s. It first rotated counterclockwise 3.5 cycles, followed by an 18-s fixation, and then rotated clockwise for another 3.5 cycles.
The corticotopic mapping protocol attempted to determine the cortical regions activated by the target independently. During the corticotopic mapping, a target that had the same spatial dimension as the one used in the psychophysical experiment was displayed for 4 s followed by an 18-s long fixation in each trial, and a total of seven trials was presented. In order to increase the magnitude of cortical activation that was induced by the target, a square-wave grating pattern was created in the vertical direction on each of the two bars. The pattern had a spatial frequency 2 degree-per-cycle with a contrast 35% and was contrast-reversing at the rate of 4 Hz.
The visual masking protocol consisted of five different trials: (i) target only (T) displayed for 84 ms; (ii) masking condition (MfTMb) in which a 100-ms forward mask preceded a 84-ms target and a 84-ms backward mask followed the target; (iii) mask only (MfFMb) in which a 84 ms long fixation (F) period replaced the target in the masking condition; (iv) unmasking condition (MftTtMb) that was similar to MfTMb except that a 500-ms time delay (t) was placed between the target and each of the two masks; and (v) second mask-only condition (MftFtMb) in which a 84 ms long fixation period replaced the target display in the unmasking condition. The first mask-only condition served as a control condition for the masking condition, while the second mask-only condition served as a control condition for the unmasking condition. During each trial, a fixation mark followed the stimulation sequence, resulting in a 20 s long trial. We limited the number of trials performed in anticipation that a prolonged fMRI protocol could increase eye stress and fatigue, increase the probability of head movement, and degrade image quality. In addition, we needed to have sufficient numbers of trials for each condition in order to average functional signals and to have statistical power for differentiation of the functional signals for the different conditions. As a trade-off, we used only one of the two targets that were used in the psychophysical test: both two bars in white. All five conditions were pseudo-randomly presented in one scan with three trials for each. Each subject had six scans, resulting in a total of 18 trials for each condition. During scanning, subjects were instructed to focus their eyes on the fixation mark at the centre of the visual field at all times.
MRI parameters
Six axial-oblique sections, perpendicular to Calcarine Fissure, were acquired on a GE 3.0-T clinical scanner using a gradient-echo echo-planar imaging pulse sequence (GE-EPI) with TE/TR = 40 ms/500 ms, flip angle 70°, field-of-view 200 mm, matrix size 64 × 64, and slice thickness 5 mm. Thus, 40 images per anatomical section were acquired for each trial in the visual masking protocol.
Data analysis
Pre-processing All functional images were corrected for possible in-plane translation and rotation within each scan and between scans (26). Signal intensity time course was corrected for possible slow baseline drifts using 0, 1st and 2nd orders of polynomials, and normalized to allow signal averaging over voxels, over scans, and across subjects (27).
Retinotopic map Images that were acquired during the first half cycle of each rotation were discarded, leaving one volume of images of three whole cycles for the counter-clockwise rotation and another volume for the clockwise rotation of the stimulus, respectively. The discrete Fourier transformation of the time course for each volume was computed voxel by voxel, and the phase angle of the time course was further calculated. Due to the time delay of the BOLD response to the stimulus, the temporal phase of the time course of the BOLD signal intensity in a voxel was shifted relative to the polar phase of the periodic stimulation corresponding to the spatial location of the checkerboard, and the magnitude of the shift is uncertain. This uncertain phase shift due to the delayed BOLD response, however, is identical in both the counter-clockwise and clockwise rotations, and therefore can be removed by subtracting them from the measured phase angles for the counter-clockwise and clockwise rotations (23), yielding a corresponding one-to-one relationship between the temporal phase of the BOLD signals and the polar phase of the periodic stimulation. Finally, the phase was colour-coded and overlaid onto T1-weighted anatomical images. The ventral (dorsal) border of V1/V2 was determined by the polar angle phase reversal in the activation of the first band when the centre of the stimulus was within 45° of the superior (inferior) vertical meridian.
Corticotopic regions of the target Corticotopic regions of the target were determined from functional images that were acquired during the corticotopic mapping (images of the first dummy trial were discarded). The time series of the functional images was correlated voxel by voxel, with sine and cosine wave functions having periodicity equal to the trial duration of 22 s, and then the magnitude and phase of cross-correlation coefficient were computed (28, 29). A threshold level of significance for the magnitude of the cross-correlation coefficient, equal to or greater than 0.35 with phase range of [−100, 50], was chosen to yield an estimated Type I error rate of P < 0.0005/voxel. The activated voxels, coincident with the primary visual cortex (determined by the retinotopic mapping), defined the region of interest (ROI) for analysis.
Visual masking After preprocessing, all functional images that were acquired during the visual masking experiment were sorted according to the five stimulation sequences. For each stimulation condition, signal intensity time courses of the functional images were averaged over the voxels within the ROI and over the trials. The area under the time course of signal intensity changes was integrated and used as a metric for activation for the stimulation condition.
Results
Psychophysical test
Without the forward- and backward-masks, all subjects could detect the target correctly with an error rate of 5.3 ± 3.2% (mean ± SEM) for MA and 4.0 ± 1.1% for NHC, indicating that the target was clearly visible. The presentation of the forward- and backward-masks affects the visibility of the target. The magnitude of this effect depends upon the time delay between the target and the two masks (Fig. 2). When the forward mask was placed immediately before the target and the backward mask followed the target without a time delay, the presentation of the masks decreased the visibility of the target. This rendered an increase in errors for detection of the target with an error rate of 48.0 ± 2.3% for MA and 43.3 ± 3.4% for NHC (50% error rate for random choice), significantly greater than without the masks (P < 0.0001, t-test). Adding time delays between the forward mask and the target and between the target and the backward mask reduced the masking effect (Fig. 2). With a 500-ms time delay, the masking effect had almost vanished, as reflected in the error rate being reduced to 14.3 ± 14.0% for MA and 9.8 ± 1.9% for NHC. Comparing the masking condition (no time delay between the masks and the target) with the unmasking condition (a 500-ms time delay between the masks and the target), the error rates were significantly different (P < 0.001) for both MA and NHC. However, no significant difference was observed between MA and NHC (P > 0.2).

Psychophysical results. T, Target only. Delay time: 0, 34, 100 and 500 ms. □, Migraine with aura; ▪, non-headache control.
Activation in V1
The group-averaged integrated areas of signal intensity changes in V1 for the five stimulation conditions are plotted in Fig. 3. Significant cortical activation was produced by the target T in both the migraine patients and non-headache controls, and is reflected in the measured area of the BOLD response 3.8 ± 0.5 (mean ± SEM, % × s) for MA and 3.6 ± 0.4 (% × s) for NHC. The unmasking stimulation MftTtMb produced the maximum cortical activation in V1 as expected for both MA and NHC, and similar cortical activations for the five stimulation conditions were observed between MA and NHC (Fig. 3). Cortical activation that was induced by the unmasking stimulation MftTtMb was bigger than that produced by its control condition MftFtMb in which the fixation F replaced the target T, reflecting the additional contribution of T in MftTtMb compared with MftFtMb. Cortical activation that was induced by the masking stimulation MfTMb, however, was smaller than that produced by its control stimulation MfFMb, indicating an overall strong suppression to the underlying neuronal activation in MfTMb. For NHC, the difference of cortical activations between MftTtMb and MftFtMb was significantly greater than zero (P < 0.002), but not between MfTMb and MfFMb. The difference of cortical activations between MftTtMb and MfTMb was 3.0 ± 0.5 (% × s), and the difference between MftFtMb and MfFMb was 0.6 ± 0.5 (% × s). These two differences were significantly different from each other (P < 0.002, paired t-test). No significant difference was observed between MA and NHC. This result is self-consistent with the psychophysical test (Fig. 2).
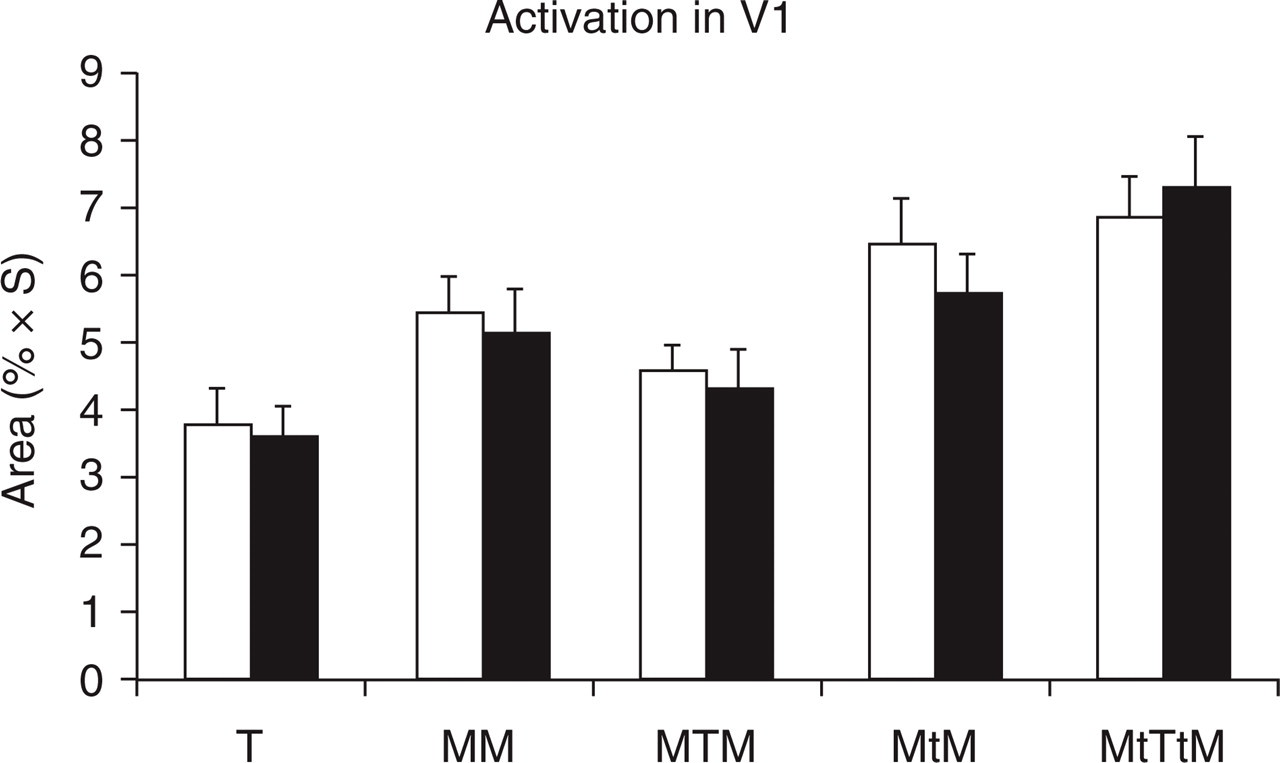
Cortical activation results. T, Target only; MTM, masking condition; MtTtM, unmasking condition; MM (MtM), control condition for the masking (unmasking) condition; □, Migraine with aura; ▪, non-headache control.
Discussion
The result of the psychophysical test showed that both groups of MA and NHC were equally susceptible to visual masking; no one group performed the task better than the other under the same conditions (Fig. 2). When there was no time delay between the masks and the target, the task performance error rates for the two groups were close to the error rate for random choice, indicating that the provided answers were mainly based on guessing and the target was almost invisible. The error rate decreased with increased time delay, indicating increased visibility of the target with increasing the time delay. Both groups showed a similar pattern of task performance. The fact that the error rate for MA was systematically bigger than that for NHC showed that the MA consistently performed worse than the NHC even if their performance for each condition was not significantly different (Fig. 2). It demonstrates that the MA was equally, if not more, susceptible to visual masking when compared with the NHC.
Cortical activation in V1 showed a similar pattern for both groups of MA and NHC (Fig. 3), and no significant difference was observed between the two groups. The unmasking condition MftTtMb provided more visual stimulation, and hence, produced a bigger cortical activation when compared with its control condition MftFtMb. Despite the more visual stimulation that was provided by the masking condition MfTMb when compared with its control condition MfFMb, the former produced less cortical activation then the latter. This indicated a strong overall suppression of on-response and after-discharge of neuron firings (19). During the masking condition, the forward mask Mf suppressed the on-response of neurons to the target T, the target inhibited the after-discharge of neurons to Mf and suppressed the on-response of neurons to the backward mask Mb, and the backward mask inhibited the after-discharge of neurons to T. These suppressing interactions among Mf, T and Mb counteracted the additional stimulation provided by T in MfTMb. As a result, MfTMb provoked less activation in V1 than MfFMb. It is probably the suppression of on-response and after-discharge of neurons to the target that rendered the target invisible during the masking condition.
The results of the psychophysical test and the fMRI study are consistent. The target was visible when it was unmasked, but invisible when it was masked. When the target was unmasked, cortical activation was maximal. When the target was invisible, cortical activation was reduced, which demonstrated that the decreased visibility of the target was associated with the reduced cortical activation in V1. The reduction in cortical activation and in the visibility of the target was probably due to the inhibition to the transient on-response and after-discharge of neurons to the target. These similarly consistent results from both the psychophysical test and the fMRI study, when compared with the NHC, showed no observable impairment in visual cortical inhibitory function in the MA. It is consistent with the conclusion of normal inhibition function in migraine from a visual contrast gain control study (30), but contrary to the statement of dysfunction of inhibition in migraine that was reported in the psychophysical study (20). The MA also did not show any significant hyperneuronal activity when compared with the NHC (Fig. 3). We conclude that if, indeed, there is a deficit in inhibition that is responsible for the cortical hyperexcitability in MA patients, as suggested in the study (20), the inhibitory function must be specifically impaired and is disrupted for only certain specific conditions. This conclusion is consistent with our recent fMRI study, in which we found that hyperneuronal activity induced by a black–white grating in the MA patients occurred only for a specific range of spatial frequency (6). Although these conclusions are not in conflict with the general cortical hyperexcitability theory in migraine, they provide evidence to show the limitation to the theory. In addition, a recent review of the studies of evoked potentials and transcranial magnetic stimulation in migraine favoured the concept of cortical hypo- but not hyperexcitability in migraine, and concluded deficient habituation and decreased preactivation cortical excitability as the predominant interictal dysfunctions (31). More studies are needed to uncover the mechanisms responsible for the cortical dysfunctions in migraine.
Footnotes
Acknowledgements
The authors are indebted to James G. Lyon for reading the manuscript, and would like to acknowledge the technology support provided by Dr E. J. Potchen and the Department of Radiology at Michigan State University. This work was supported in part by a NINDS grant (R21 NS42742) and an AHA Established Investigator Award to Y.C.