
Abstract
Neurophysiological testing has become a valuable tool for investigating brain excitability and nociceptive systems in headache disorders. Previous reviews have suggested that most neurophysiological tests have limited value for headache diagnosis, but a vast potential for exploring the pathophysiology of headaches, the central effects of certain pharmacological treatments and phenotype-genotype correlations. Many protocols, however, lack standardization. This meta-analytical review of neurophysiological methods in migraine was initiated by a task force within the EUROHEAD project (EU Strep LSHM-CT-2004-5044837-Workpackage 9). Most of the neurophysiological approaches that have been used in headache patients are reviewed, i.e. evoked potentials, nociception-specific blink reflex, single-fibre electromyography, neuroimaging methods (functional MRI, PET, and voxel-based morphometry) and the nitroglycerin attack-provoking test. For each of them, we summarize the results, analyse the methodological limitations and propose recommendations for improved methodology and standardization of research protocols. The first part is devoted to electrophysiological methods, the second to neuroimaging techniques and the NTG test.
Introduction
Neurophysiological testing has become a valuable tool for investigating, atraumatically in humans, CNS functions, including those related to pain processing. Previous studies in headache disorders have suggested that most neurophysiological tests have limited value for diagnosis, but a vast potential for studying pathophysiology and the effects of pharmacological treatment (1). They also may contribute to improve phenotype-genotype correlations.
Considering the great number and variety of neurophysiological tests that have been used up to now in headache patients, sometimes with differing results, there seems to be a timely need for the standardization of methods. In this article we will critically review the available data published for neurophysiological tests in headache and propose some recommendations for optimized research protocols. We will focus on those tests that have been used in migraine (2) and have provided the most relevant and novel information for the understanding of migraine pathophysiology. Electrophysiological tests such as evoked potentials, single fibre electromyography and the nociceptive blink reflex, will be described in this first part of the article. The imaging techniques, such as functional magnetic resonance imaging (fMRI), positron emission tomography (PET) and voxel-based magnetic resonance imaging morphometry (VBM), as well as the attack-provoking nitroglycerin test, will be discussed in the second companion paper.
Electrophysiological tests
In migraine, interictal abnormalities of cerebral information processing were first detected by studying an event-related potential, contingent negative variation (CNV). Thereafter, similar changes were also found for the more simple modality-specific evoked potentials, which are less dependent on attention and motivation. The somatosensory modality has been less frequently studied than the visual and auditory modalities; the results have been summarized elsewhere (2). More recently, it has been shown that in migraineurs between attacks laser-evoked cortical nociceptive potentials have the same abnormality as the other evoked potentials, i.e. a deficit of habituation (3). In the present review, we will focus on visual and auditory evoked potentials, which are most frequently examined in migraine.
We will also review the data and lessons coming from studies of single fibre EMG and the nociceptive blink reflex in migraine patients, as these two methods have yielded interesting results in recent years.
The vast literature on transcranial magnetic stimulation and the controversial information it provides on cortical excitability in migraine have been discussed in detail elsewhere (4).
Visual evoked potentials (VEP) D Magis & J Schoenen
Definition
Visual evoked potentials are electrical potential differences recorded from the scalp in response to visual stimuli. They represent a mass response of cortical and possibly subcortical visual areas. Visual evoked potentials to stimuli repeated at low rates are defined as transient visual evoked potentials (usually abbreviated as VEPs). VEPs can be elicited by either patterned or unpatterned stimuli. The most commonly used are pattern-reversal, pattern onset-offset and flash stimuli. Steady-state visual evoked potentials (abbreviated as SVEPs) are responses to visual stimuli at relatively high frequencies (above 3.5/s).
Published data
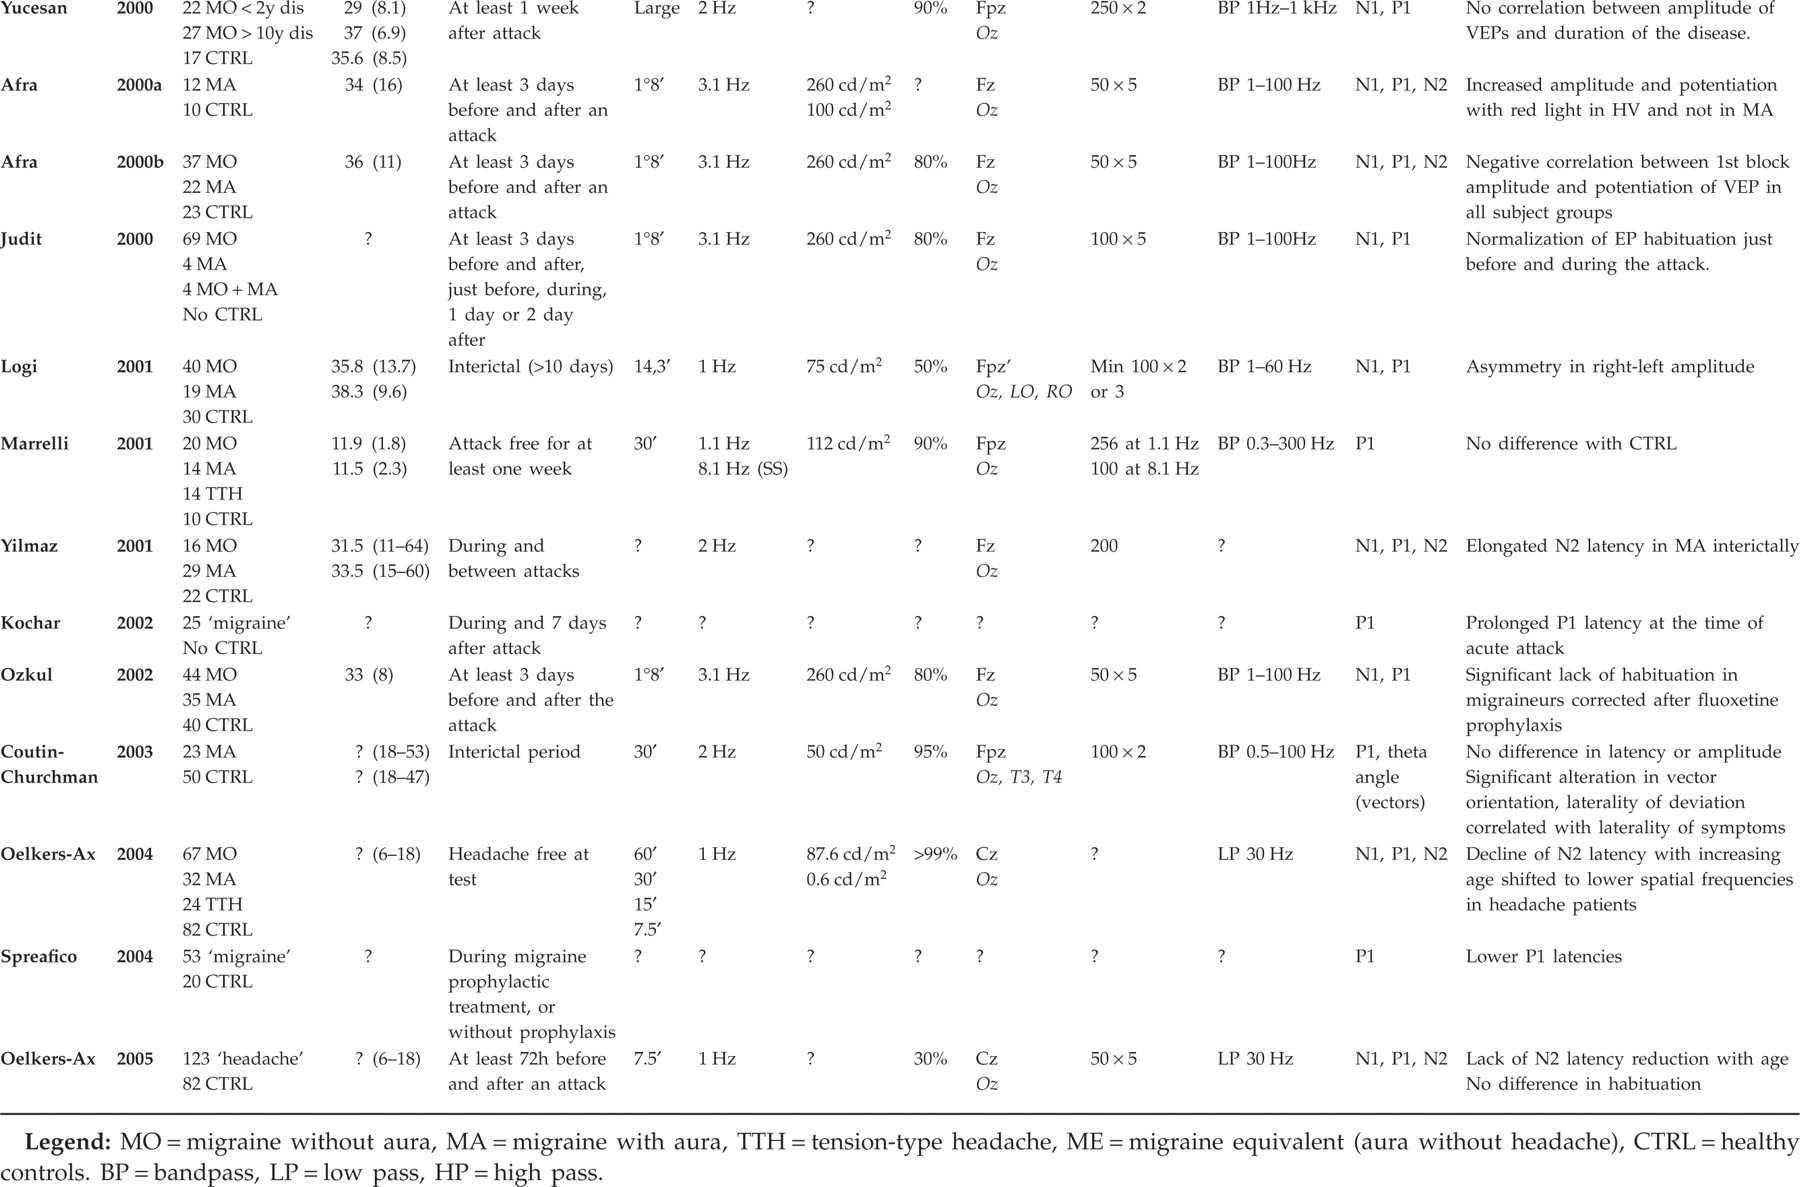
The available published data on VEP studies in migraine are presented in Table 1, including the methods used in each study (5–44). The table illustrates the great variability of methods. It also shows that VEP abnormalities have been found in most studies, although the type of abnormality varies.
Available VEP studies in migraine


Interests
The majority of VEP studies demonstrate interictally increased amplitude of grand averages or lack of habituation in sequential blocks of averaging. The habituation pattern may have a familial character (29). As electroretinograms are normal (25), this indicates that information processing in the visual cortex is abnormal in migraineurs between attacks and that it could represent an endophenotypic marker for the disorder.
The advantage of evoked potential studies is that the method is non-invasive and that it can be repeated in the same individual at different time points, e.g. during an attack (35) or after pharmacotherapy (11).
Moreover, evoked potential studies can be performed with portable recording devices, which is of interest for field studies of population isolates and of genotype-phenotype correlations.
Limitations
There is no published information on the intra- and interindividual reproducibility of VEP habituation. For diagnostic and research purposes, the International Federation of Clinical Neurophysiology recommends replicating any electrophysiological test at least once. Regarding habituation, it is not known at which time delay such replication can be performed without interfering with the habituation phenomenon itself. Variability may be greater for averaging of smaller numbers of responses, as used to evaluate habituation.
Visual impairment interferes with morphology, amplitude and latency of VEPs. Patients with known visual disturbances (e.g. visual loss due to previous optic neuritis) should be excluded or analysed separately. Modified sensitivity to perception of contrast or patterns should be a criterion for exclusion, as it is frequently found interictally in migraineurs. In the case of optic deficits, the recordings should be made with correcting glasses.
There is a need for a better standardization between different studies/centres.
Recommendations for improved methodology
To standardize methods and allow comparisons between laboratories, the Guidelines recommended by the International Federation of Clinical Neurophysiology for the general use of VEP in clinical neurology should be followed (45).
The following information should be included in the ‘methods’ section of published studies.
Stimulus characteristics
Type of pattern: checkerboard, square-wave gratings, sine-wave gratings. Orientation of gratings: horizontal, vertical … It should be achromatic black and white, unless a specific effect of various wave lengths is explored.
Size of pattern elements: defined by the visual angle that they subtend in the subject's visual field. Checks are traditionally expressed in minutes of arc, whereas gratings are reported in cycle per degree (cpd). To calculate the visual angle of the pattern elements, the following equation is used: a = arctan (W/2D) × 120 where a is the visual angle in minutes of arc, W is the width of the check in millimetres and D is the distance of the pattern from the corneal surface in millimetres. The visual angle can be converted to cycles per degree (cpd) by the equation: cpd = 30/a for bars and cpd = 42.3/a for checks. The measure in cpd defines the spatial frequency.
Total field size: expressed in degrees of visual angle. The location of the central fixation point in the field should also be noted.
Rate of presentation/alternation of the pattern: refers to the number of stimulus events per unit of time (temporal frequency). Stimulus frequency is expressed in Hertz (Hz) and represents the number of full cycles of stimulus presentation per second.
Stimulus luminance: measured by a photometer and expressed in candela per square meter (cd/m2). It should be uniform and vary by less than 20% between the centre and the periphery of the field. The mean luminance should be measured at the centre of the field and can be expressed for spatially mirror symmetric stimuli by the equation: Mean luminance = (Lmax + Lmin)/2 where Lmax and Lmin are the maximum and minimum luminance values across the stimulus field. It is important to notice that the response amplitude and peak latency will vary with the stimulus luminance.
Background luminance: should be kept constant throughout the recording and remain the same for each given protocol.
Contrast: i.e. the difference in luminance between the bright and the dark portion of the pattern. It is expressed by the equation C = [(Lmax − Lmin)/(Lmax + Lmin)] × 100%.
Type of stimulator: patterned stimuli may be displayed in various ways (TV, oscilloscope, projector screen …). There is no perfect stimulator. Comparable results among laboratories will be possible only if the physical characteristics of the stimuli are matched.
Recordings
Electrodes: type and position.
Recording equipment: type and bandwidth of the amplifiers and preamplifiers.
Number of repeats.
For clinical purposes, the IFCN committee recommends the following parameters to obtain reliable and reproducible VEPs.
Black and white pattern-reversal checkerboard or vertical gratings for stimulation.
Pattern elements: 14–16′, 28–32′, 56–64′ (ideally all of them in clinical practice). The smaller size of 14–16′ is optimal to stimulate the fovea but is easily affected by visual acuity changes. The wider size patterns may also stimulate the parafoveal region and may elicit normal responses in cases of foveal dysfunction.
Full field size greater than 8°.
Frequency of presentation of the pattern: 1Hz is preferred for transient VEPs; suggested frequency for SVEPs is 4 or 8 Hz.
Mean luminance of at least 50 cd/m2 of the centre field.
Background luminance matched as closely as possible to the mean luminance of the stimulus.
Contrast between 60 and 95%.
System bandpass filtering of 1.0 to 250–300 Hz.
Montage: two recording electrodes are sufficient, as VEPs are widely distributed over the scalp from the vertex to the inion. The montages suggested for a reproducible VEP are: Oz-Fpz or Oz-A1-A2 (linked ears) with a ground electrode placed at Cz.
Analysis time of 250 ms for transient VEP, 2 s for SVEP.
Number of repeats: averaging of at least 100 individual trials.
There are no guidelines as far as habituation is concerned, as it is not routinely assessed in clinical practice. Nonetheless, the following parameters are considered important for the study of habituation.
Luminance: a change in luminance interferes with peak amplitudes and latencies.
Band pass filtering: it should ideally be minimal in habituation studies.
Spatial frequency 1°8′ is recommended
Stimulation frequency: this is important as higher stimulation rates induce faster habituation; 3.1 Hz can be recommended.
Number of blocks of averaging: the optimal number of blocks has to be defined; usually five or six blocks of 50–100 averaging are used. We recommend recording evoked potentials continuously and averaging off-line, which allows measurement of habituation on blocks of a variable number of responses without stimulus interruption.
The time interval between the recording session and the last/next attack is crucial as habituation markedly changes in the peri-attack interval (33); an interval of at least 72 h is recommended, which indicates that patients with high attack frequencies have to be studied separately.
Studies needed
Studies are needed to assess the reproducibility of VEP habituation in healthy volunteers and in migraineurs. Several physiological models indicate that habituation is positively related to the amplitude of the initial response. Thus, the relation between the amplitude of the first block of averaging and the degree of habituation should be assessed in all studies.
Auditory evoked cortical potentials (AEP) D Magis & J Schoenen
Definition
Auditory stimuli elicit in the CNS small electrical potentials, which, depending on their generators in the auditory pathways, can be separated into short (brain stem), middle and long latency auditory evoked potentials. Middle latency AEP originate in the auditory cortex. In migraine between attacks (46) they were found to steeply increase in amplitude with increasing stimulus intensity reflecting a pronounced intensity-dependence of auditory evoked potentials (IDAP), which is likely to reflect reduced central serotonin neurotransmission.
Literature data
The available published data on AEP studies in migraine are presented in Table 2, including the methods used in each study (32, 34, 46–54). There are only three published studies exploring habituation of cortical auditory evoked potentials. The first (46) reported potentiation at high but not at low intensities. This was confirmed by a second study (54) measuring simultaneously intensity dependence and habituation for each stimulation intensity, but not in another study using a somewhat different methodology (32). The majority of IDAP studies show that the intensity-dependence is more pronounced in migraine with some evidence for a genetic influence (51; 53).
Available AEP studies in migraine

Interests
Intensity-dependence could be a marker of central serotoninergic neurotransmission, as it can be modulated by drugs increasing or decreasing serotoninergic activity (48). Therefore, it could be a useful and non-invasive surrogate for detecting an action of pharmacological agents on central serotonin transmission (46).
As for VEPs, the advantage of cortical auditory evoked potential is that the method is non-invasive and that it can be replicated in the same individual at different time points, e.g. during an attack (55) or after pharmacotherapy (52). Moreover, AEPs can be recorded with portable devices, which is of interest for field studies of population isolates and genotype-phenotype correlations.
Limitations of the method
Their sensitivity to cognitive factors makes the AEP vulnerable to general changes in attention and vigilance. Their low voltage combined with relatively high background electrical noise requires the use of highly sensitive amplifiers and computer averaging equipment.
Two studies showed poor IDAP repeatability for pathophysiology (50) and pharmacological studies (49). It was concluded that variability was too large to compare individuals, and that therefore IDAP could not be used for diagnosis, but that it could be used for intraindividual comparisons.
Hearing impairment may interfere with amplitude and latencies of AEP, but there is no information on its possible influence on habituation or amplitude-stimulus function. It is likely, however, that mild hearing loss is not a major confounding factor as long as the stimulus sensation level (SL) is determined at the beginning of the recording.
Recommendations for improved methodology
As for VEPs, the first step to optimize cortical AEP methodology and to allow more reliable comparisons between centres is to comply with the Guidelines recommended by the International Federation of Clinical Neurophysiology.
To obtain reliable and reproducible cortical AEP in clinical practice, the committee recommends the following method.
For clinical research studies, a set of five recording channels is recommended, including electrodes Fz, Cz, F3 and F4 of the international 10/20 system referenced to the linked mastoid processes, but this is rarely possible in clinical practice, as many evoked potential recording devices offer no more than two recording channels.
For recordings with minimal distortion, bandpass settings should be 0.1 (0.3) to 30 (100) Hz.
Averaging should be performed after artefact rejection and include at least 200 responses per condition.
Recordings should be repeated at least once to evaluate consistency.
There are no guidelines for habituation and IDAP studies, as the latter are not commonly used in clinical practice. The following parameters are of importance.
The intensity of the stimulus is a crucial variable for habituation study of AEP. Patients with an otologic disease should be detected by audiometric testing. We propose excluding the patients showing an average tone loss above 20 dB (compared with normal hearing level dB nHL) (International Bureau for Audiophonology recommendations). Adjusting stimulus intensity to sensation level, which is used in most studies, may be harmful and painful in patients with end organ hearing loss and auditory recruitment. The following intensities should be recorded: 40-50-60-70 dB above sensation level (dB SL) if absence of significant hearing loss has been ascertained, or above the normal hearing threshold (dB nHL), at which an average normal subject can perceive the stimulus 50% of the time, if the otologic status is uncertain (see Table 2). Which of SL or nHL has been used to set the intensity should be clearly announced in the methods.
Different stimulus intensities should be administered in a randomized or pseudorandomized sequence, ideally the first intensity should not be the lowest or the highest one (sequence example: 60-70-50-40 dB and not 40-50-60-70 dB).
As for the stimulus rate, most of the studies in migraine used a randomized interstimulus interval (ISI) of 1.6 to 2.2 s (0.61–0.45 Hz). The average ISI should be approximately 1500 ms (45).
The optimal number of blocks of averaging for each intensity has to be defined; four to five blocks of 30 averaged responses can be used; as for the other evoked potentials, we recommend recording evoked potentials continuously and averaging off-line, which allows measurement of habituation on blocks of a variable number of responses without stimulus interruption.
The interval between the recording and the last/next attack is crucial; an interval of at least 72 h is recommended, which indicates that patients with high attack frequencies have to be studied separately.
Studies needed
Simultaneous recordings of AEP and cochlear responses could be of interest to exclude a subclinical dysfunction of cochlear processing in migraineurs. Recently, we have analysed, between attacks in migraineurs without a history of vertigo, the vestibulo-collic reflex (VCR) (or vestibular evoked myogenic potential-VEMP), an inhibitory brain stem reflex that explores an oligosynaptic pathway most probably including the saccular macula, the inferior vestibular nerve, the lateral (Deiter's) vestibular nucleus, the vestibulospinal tract and the neck motor neurones innervating the ipsilateral sternocleidomastoid muscle. We found that amplitude and habituation of the VCR are reduced (56), an abnormality very similar to that found for cortical evoked potentials.
Single-fibre electromyography A Ambrosini & M Ertas
Definition and literature data
Single-fibre electromyography (SFEMG) is the best and safest neurophysiological method to assess the neuromuscular junction performances in vivo in human subjects. Although there is a priori no clinical reason suggesting an abnormality of neuromuscular transmission in migraine patients, most (57–61), but not all (62), recent studies found such mild subclinical abnormalities in some subgroups of migraineurs. The working hypothesis for these findings was that some migraineurs might share genetic abnormalities on the CACNA1A gene similar to those found in familial hemiplegic migraine type 1 (FHM1) patients, as suggested by some linkage and sib-pair analysis studies (63–65). Normalization of the abnormal SFEMG values was obtained in two migraine patients by a treatment with acetazolamide, which is also used in FHM1 and EA-2 patients (66).
Limitations of the method
Recordings
There are two methods to obtain SFEMG recordings (67). The most commonly used is voluntary muscular contraction, where the mean MCD values are calculated from the intervals between two consecutive discharges of a single muscle fibre potential. This method requires good cooperation of the subject, who has to adequately dose his muscle contraction. SFEMG may also be performed during electrical stimulation of intramuscular motor axons (Stimulation-SFEMG); in this case mean MCD is calculated from the interval between the stimulus artefact and the single muscle fibre potential. Stimulation-SFEMG is easy to perform and does not require any patient collaboration except for relaxation. It suffers, however, from the risk of insufficient stimuli and consequent miscalculations.
SFEMG may be performed in different muscles; the muscles most commonly explored are extensor digitorum communis (EDC), frontalis and orbicularis oculi muscles. While the orbicularis oculi muscle is probably the best to reveal neuromuscular transmission abnormalities in ocular type myasthenia gravis (68), the EDC muscle is commonly used in generalized neuromuscular transmission defects such as generalized type myasthenia gravis. In their studies Ambrosini et al. (57–59, 66) used stimulation SFEMG of EDC, Domitrz et al. (61), Ertas and Baslo (69) and Coban (60) used voluntary EDC contraction SFEMG and Terwindt et al. (62) used stimulation SFEMG of frontalis muscle. These studies are thus heterogeneous, and the results obtained from them cannot be appropriately compared.
Reference values
Migraine is a very common disease, affecting 10–15% of the general population, and often undiagnosed or misdiagnosed. Moreover, it can occur at any age before 40–50 years and is characterized by a strong genetic component, which may explain why neurophysiological abnormalities can be found in asymptomatic relatives of migraine patients (29, 53). Consequently, most normative SFEMG values reported in the literature cannot be applied in migraine studies without reservation because pre-symptomatic, or even symptomatic, migraineurs may have been included in the ‘normal’ control group. It is thus necessary to establish normal control values for SFEMG in healthy subjects without a personal migraine history, but also without a family history of migraine. Only some investigators (57–60) took into account this important potential bias.
One of the most critical points in assessing the presence of SFEMG abnormalities in migraine patients is to define the electrophysiological parameters to be measured and their normative values. In many studies (57–59, 62, 66, A. Ambrosini et al., unpublished data) average mean MCD values (indices of the mean jitter of all the examined fibres) were used to compare migraineurs with healthy controls; in some of them (57, 58, 61, 66; A. Ambrosini et al., unpublished data) neuromuscular transmission abnormalities were also evaluated by the percentage of single fibres with abnormal mean MCD values in each recording.
The upper normal limits commonly accepted for stimulation-SFEMG recordings are 25 µs for the mean of MCD values and l0% or less fibres with a MCD value higher than 40 µs. However, these values were obtained in groups of control subjects that have probably included migraineurs and subjects at genetic risk for migraine. Normal values should thus be assessed on more strictly selected healthy volunteers. In their studies Ambrosini et al. found that in 16 healthy controls no one had single fibre jitter values exceeding 40 µs, and any abnormally high jitter value in migraineurs was considered as a neuromuscular transmission abnormality. Ambrosini et al. (57–59, 66), and Terwindt et al. (62) considered an SFEMG abnormal if the mean of MCD values exceeded that of control subjects by two standard deviations. Domitrz et al. (61), who used SFEMG during voluntary contraction, reported as cut-offs 33.8 µs for the mean of MCD values and 55 μs for single fibre jitter value on the basis of their own reference values. They did not take into account the percentage of abnormal fibres. Ertas and Baslo (69) and Coban (60), who also studied SFEMG during voluntary contraction, considered the test as abnormal if 15% or more MCD values exceeded 55 µs and borderline if 10% of MCD values were above this threshold.
In conclusion, the concept of SFEMG abnormality may vary between studies and needs to be clearly defined with regard to the parameter measured and to the control population that was recorded to define normal values.
Blinding
Terwindt et al. (62) stress that insufficient blindness may influence recordings and analyses of SFEMG tests. In their study the SFEMG performers were reported to be unaware of the diagnoses. It seems difficult, however, to maintain blinding in such a selected small group of patients who generally also undergo various other investigations. Ambrosini et al. (57–59) and Domitrz et al. (61) were blinded to the clinical aura features of the examined patients, but were informed about the general diagnosis. Although bias due to the incomplete blinding cannot be excluded in these studies, it probably had no major role, as significant differences were found only between subgroups of migraine with aura patients and not between the three groups of subjects taken together.
Recommendations for improved methodology
Recordings
The two different methods for obtaining SFEMG recordings both have advantages and disadvantages. The most sensitive one is stimulation-SFEMG of orbicularis oculi muscle (for ocular type myasthenia gravis), the most reproducible one stimulation-SFEMG of extensor digitorum communis muscle and the most reliable one SFEMG during voluntary EDC contraction. There is thus at present no evidence-based reason to favour one method over the other
Control reference values
Each investigator should select an appropriate control group in order to assess in his laboratory setting the upper normal limit for mean MCD values and percentage of abnormally high single fibre jitter values and/or blocking.
SFEMG measures
From a statistical point of view, the best upper cut-off is the mean of MCD values of control subjects +3
Blinding
Complete blinding to the clinical diagnosis is recommended, but may be difficult to obtain. Partial blinding to certain phenotypic features may, however, suffice, especially in studies of migraine subgroups.
Nociception-specific blink reflex D Magis, H Kaube & J Schoenen
Definition
The nociception-specific blink reflex (nsBR) is an oligosynaptic reflex of brain stem origin. It can be obtained by a newly developed concentric surface electrode first described by Kaube et al. (70). Low intensity stimuli delivered supraorbitally by this electrode are concentrated on a small cutaneous area and result in a high current density that is able to stimulate preferentially Aδ fibres and therefore to produce a nociception-specific R2 response without inducing the R1 response recorded in routine blink reflex studies. The nociception-specificity is supported by the fact that local anaesthesia and analgesics reduce dramatically the R2 amplitude (70).
Literature data
Up to now, five studies were performed with the nsBR electrode in migraine (71–75) (Table 3). In two of them (71, 72), the R2 amplitude was found increased and its latency decreased during a migraine attack, which was considered to reflect sensitization of trigeminal nociception, predominantly on the headache side. These abnormalities were not found in sinusitis pain (71), and disappeared with acute antimigraine treatment (72). A significant interictal lack of habituation of the nsBR response in migraineurs was demonstrated in three studies (73–75). A correlation was found in migraine between the habituation patterns of nsBR and visual evoked potentials, suggesting a common underlying mechanism (74). Finally, the nsBR habituation deficit could be a trait marker of the disease, as it was also present in healthy subjects with first-degree migrainous relatives (75).
Available studies of NSBR in migraine

Interests of the method
The nociception-specific blink reflex is a simple way to explore the nociceptive trigeminal system at the level of the brain stem. Because of the selective depolarization of superficial Aδ fibres, the method could be a more practical, cheaper and safer alternative to laser stimulation, but the latter more specifically activates nociceptive afferents including C fibres. Up to now all available studies of nsBR have used the same stimulation parameters: electrical pulses delivered at 1.5 times the individual pain threshold, having a 0.3 ms duration and separated by pseudorandomized ISI from 15 to 17 s.
Limitations of the method
In their studies, Katsarava et al. (73) and Di Clemente et al. (74, 75), did not use the same method to define habituation. Both excluded the first sweep of each block to avoid contamination with the R3 component (70). In Katsarava's study, habituation was calculated as the regression coefficient of the five remaining successive R2 responses of a six-sweep block. The average habituation value was averaged on two blocks (mean regression coefficient). In Di Clemente et al.'s studies, 10 blocks of six sweeps each were recorded. Habituation was defined as the percentage change between the R2 areas under the curve (AUC) in the tenth and first blocks. The latter analysis was used to avoid variability due to inter-individual differences in R2 AUC (76), and also to permit comparison with the habituation pattern of PR-VEP (74).
Recently, it was suggested in a methodological trial that trains of three stimuli could be more reliable than single shocks to elicit the nsBR, because it induces R2 response of greater amplitude (77). However, this stimulation modality is rather painful and has not yet been applied to migraine patients.
Recommendations for improved methodology
As mentioned above, the nsBR studies published hitherto in headache patients are based on a similar methodology, except as far as calculation of habituation is concerned. As in spite of this both studies in which habituation was assessed found a similar interictal habituation deficit in migraineurs, one may assume that the difference in methodology did not play an important role. However, using mean values of habituation determined on several averaged recordings could limit variability between subjects (76). Another methodological bias with nsBR recordings could be caused by the stimulation electrode. As a matter of fact, electrodes used up to now are custom-built and not commercially available. Slight differences inevitably exist between electrodes in different laboratories and might contribute to discrepancies in results. For future studies, it seems necessary that the various research groups with an interest in nsBR come to an agreement on one and the same stimulation electrode.
The number of blocks to be averaged is an important variable with regard to the patients' comfort. We have shown in one study of 10 blocks of averaging (74) that the lack of habituation in migraineurs was significant already in the fifth block. To study habituation the procedure could thus be limited to five blocks, i.e. 50 stimuli.
The side of stimulation does not appear to be important when recordings are made interictally, as no migraine study disclosed any significant side difference (73, 74). However, interictal studies in patients with side-locked hemicrania remain to be performed. Ictal recordings should be performed on both forehead sides, as the R2 area significantly increases on the headache side during an attack (71, 72).
Finally, it remains to be decided whether the triple stimulus could increase stability and reproducibility of nsBR recordings. Studies are underway and results are expected soon.
Studies needed
There is a lack of studies on the reproducibility of nsBR data, as for most electrophysiological studies in migraine. Moreover, all available studies used a stimulus intensity set at 1.5 times the individual pain threshold. Although no significant differences in pain thresholds were found in nsBR studies between migraineurs and healthy subjects, pain perception clearly has a subjective component. In future studies it would be of interest to compare results obtained with the individually adjusted stimulus intensity and with a fixed intensity.
Acknowledgements
The leading authors, D. Magis and J. Schoenen, are grateful to Mrs P. Gerard for help with literature search and referencing. This work is supported by the EU STREP EUROHEAD (LSHM-CT-2004–5044837) (Workpackage 9).