
Abstract
Previous studies have reported dilatation of the middle cerebral artery (MCA) during acute glyceryl trinitrate (GTN)-induced headache, using imaging techniques such as transcranial Doppler (TCD), positron emission tomography (PET) and single photon emission computerized tomography (SPECT). In the present study we aimed to evaluate whether magnetic resonance angiography (MRA) may be used to examine the effect of GTN on the MCA, with respect to changes in diameter and cross-sectional area in healthy volunteers. In addition, we wanted to determine the intra- and inter-observer variation of the method. In a randomized, double blind, crossover study 12 healthy volunteers received intravenous infusion of GTN (0.5 μg/kg/min for 20 min) or placebo. Using 1.5 Tesla MRA, we recorded changes in the diameter and cross-sectional area of MCA before, during and after infusion of GTN. The MRA images were evaluated by two blinded, independent observers/neuroradiologists. The primary endpoints were the differences in the AUC for diameter and cross-sectional area of the MCA between the two experimental conditions and the intra- and inter-observer variation. The areas under the curve (AUC) of the MCA diameter and cross-sectional area were significantly greater after GTN than after placebo (P < 0.05). The intra-observer variation (day-to-day) at baseline was 8.3% and 10.9% for the two observers. The mean inter-observer variation of the cross-sectional MCA area was 15.5% and for the diameter measurements 8%. The present study shows that the MRA method gives a reliable semi-quantitative index of the vascular changes in the intra-cerebral arteries after infusion of GTN and may be useful for headache research.
Keywords
Introduction
Experimental headache models offer unique possibilities to study mechanisms responsible for head pain, including migraine (1, 2), and glyceryl trinitrate (GTN) is a widely used headache model to induce migraine attacks (3, 4). Previous studies reported dilatation of the middle cerebral artery (MCA) during acute GTN-induced headache using transcranial Doppler (TCD), positron emission tomography (PET) and single photon emission computerized tomography (SPECT) techniques (5–7). These techniques provide, however, indirect measurement of the vessels and repeated measurements during experimental headache are limited due to radiation. Magnetic resonance angiography (MRA) is a non-invasive and widely available technique used to visualize the intra-cerebral vessels directly. MRA has previously not been applied or validated to examine possible diameter changes of the MCA during GTN-induced headache. In the present study, we aimed to evaluate whether MRA could be used to examine the effect of GTN on the MCA, with respect to changes in diameter and cross-sectional area. In addition, we wanted to determine the inter-observer variation of the method.
Materials and methods
Subjects
We recruited 12 healthy volunteers for the study (seven male, five female, mean age 25 years, range 23–28 years). All participants underwent a general and a neurological examination. Exclusion criteria were: a history of migraine or any other type of headache (episodic tension-type headache no more than once a month); any daily medication apart from oral contraceptives; serious somatic or psychiatric diseases; pregnancy and all known contraindications for MRI-examinations including claustrophobia.
All subjects gave written consent. The study was approved by the ethics committee of the county of Copenhagen (KA04041) and conducted in accordance with the Declaration of Helsinki of 1964 as revised in Edinburgh in 2000.
Procedures
In a double-blind, placebo-controlled crossover design, the participants were allocated randomly to receive GTN (0.5 µg/kg per min) or placebo (isotonic saline) administered intravenously on two study days separated by at least 1 week. Randomization and preparation of study drugs was done by medical staff not involved in the study. The subjects were randomly assigned into two groups: one group (n = 6) received GTN then placebo; the other group (n = 6) received placebo first, then GTN. The randomization code remained in the hospital during the study and was not available to the investigators until the study was completed.
Experimental protocol
All subjects arrived at the clinic at 15.00 pm and were allowed to participate only if they had been completely headache-free for at least 12 h before the examination. The intake of coffee, tea, cocoa or other methylxanthine containing foods or beverages (8) was not allowed for at least 8 h before the start of the study, nor was the use of any medication, for at least four times the plasma half-life of the drug. The subjects were not allowed to take any kind of analgesic for 24 h before the examination. On arrival, the participants were placed in the supine position, and a catheter (Optiva∗2(18G), Johnson & Johnson, Ethicon, Italy) was inserted into the antecubital vein for the administration of GTN or placebo. The participants rested for 30 min before start of infusion. GTN or placebo was infused over 20 min into an antecubital vein, as allocated by the randomization code. The study solutions looked the same. A time and volume controlled infusion pump (Braun Perfusor, Melsungen, Germany) was placed outside the MRI room.
The MRA imaging sequence was performed 5 min before the start of the infusion (T−5) and then every 5 min until t = 30 min after start of infusion and then a final recording at 60 min. Nine imaging series were done for each patient on each treatment day. The MRA data were post-processed, and the following variables were measured: diameter and cross-sectional area of the MCA. The following additional variables were recorded every 5 min until 30 min and then every 10 min until 60 min after start of infusion: headache intensity on a verbal rating scale (VRS) from 0 to 10 (0 = no headache, 1 = a very mild headache (including a feeling of pressing or throbbing), 5 = moderate headache, 10 = worst imaginable headache) (1), headache characteristics, and blood pressure and pulse rate using an auto-inflatable cuff (ProPac Encore®, Welch Allyn Protocol, Beaverton, USA). Subjects with headache 60 min after the start of the infusion were allowed to take rescue medication. All subjects were asked to record details of the following on a diary card every hour for the 10 h after discharge: headache location, headache intensity, associated symptoms, any medication taken and adverse events. The diary cards were mailed to the clinic after completion.
Magnetic resonance angiography
The MRA measurements were done on a 1.5 Tesla MR-system (Sigma Horizon, GE Medical Systems, Milwaukee, Wisconsin) with a circular polarized head coil and were performed as a three-dimensional time-of-flight (TOF) sequence with a TR 10 ms, TE 3 ms, flip angle of 25° and time of acquisition of 3 min 35 s. The slice thickness was 1.6 mm with a spacing of 0.8 mm. FOV was 24 × 18 cm and the matrix size 512 × 224. In time-of-flight magnetic resonance angiography, the images are based on the difference between the signal from the stationary background tissues and the signal from the flowing blood (9). A survey scan was performed to locate the slab containing the MCA on both sides. For the analysis of the MCA, images were obtained in both the axial and coronal planes to localize the wanted proximal, horizontal segment (M1) of the MCA on both sides. Identical copies of the MRA images were distributed to the two participating radiology departments. The images were evaluated by two experienced neuroradiologists (observer 1 in Denmark and observer 2 in Spain), who were blinded with respect to experimental conditions. For each experimental day nine imaging runs were done, yielding 18 image series (nine for the right MCA and nine for the left MCA).
Observer 1: The data analysis was performed at an Advantage Workstation 4.0 from GE using the Volume Analysis program. Using the reformat analysis program the area of the cross-sectional vessel diameter was measured after contouring the lumen along the vessel wall using image magnification to carefully determine the border of the vessel. The reconstructions were made in two planes in order to be able to make an exact perpendicular sagital slice through the main segment of the MCA of 0.9 mm thickness.
Observer 2: Data analysis was conducted on a PC with an evaluation program Advanced Vessel Analysis (General Electric).
Data analysis and statistics
All values are presented as mean ±
The primary endpoints were the differences in the AUC for diameter and cross-sectional area of the MCA between GTN and placebo, and the intra- and inter-individual variation for these variables. The secondary endpoints were differences in relative changes of the cross-sectional area and diameter of the MCA (percentage from baseline) between the two experimental conditions, and changes in heart rate and middle arterial pressure. In addition, we tested the difference between the AUC for headache score in the period 0–60 min and the difference in headache score in the period 1–10 h after discharge from the hospital. To test differences between two experimental conditions we used a paired, two-way Student's t-test, except for difference in headache scores, which was tested using the Wilcoxon signed rank test. The coefficients of variation were calculated as measure of the reproducibility as the standard deviation of the difference between the results from the two series in percentage of the group mean: variation = (
To determine the agreement between the two observers for the MRA data, we used the statistical method described by Bland and Altman for comparing paired data (12). We tested for period and carry-over effects using an independent samples t-test. Headache score was tested for period effect and carry-over effect using a Mann–Whitney test. The relation between headache score and the cross-sectional area of MCA was investigated in a regression model with time changes in logarithmic area as outcome and changes in headache score as covariate in SAS (SAS Institute Inc., Cary, NC, USA, version 9.1). All other analyses were performed with SPSS for Windows 14.0 (SPSS, Chicago, Illinois, USA). Five per cent (P < 0.05) was accepted as level of significance.
Results
All 12 subjects completed the study. Imaging runs were done at nine time points, and for the bilateral reading of both diameter and cross-sectional area of the MCA on both days, a total of 864 measurements were done by each observer, thereby giving a total of 1728 measurement for the data analysis. A total of 56 measurements (3.3%) were missing from the analysis (18 from the GTN day and 38 from the placebo day, 8 from observer 1 and 48 from observer 2), all due to technical problems with retrieval of the data. We found no statistical significant difference between the right and the left MCA for any of the recorded MRA variables (P > 0.05). Therefore, measurements of the right and left MCA were grouped and we calculated the average of the two sides.
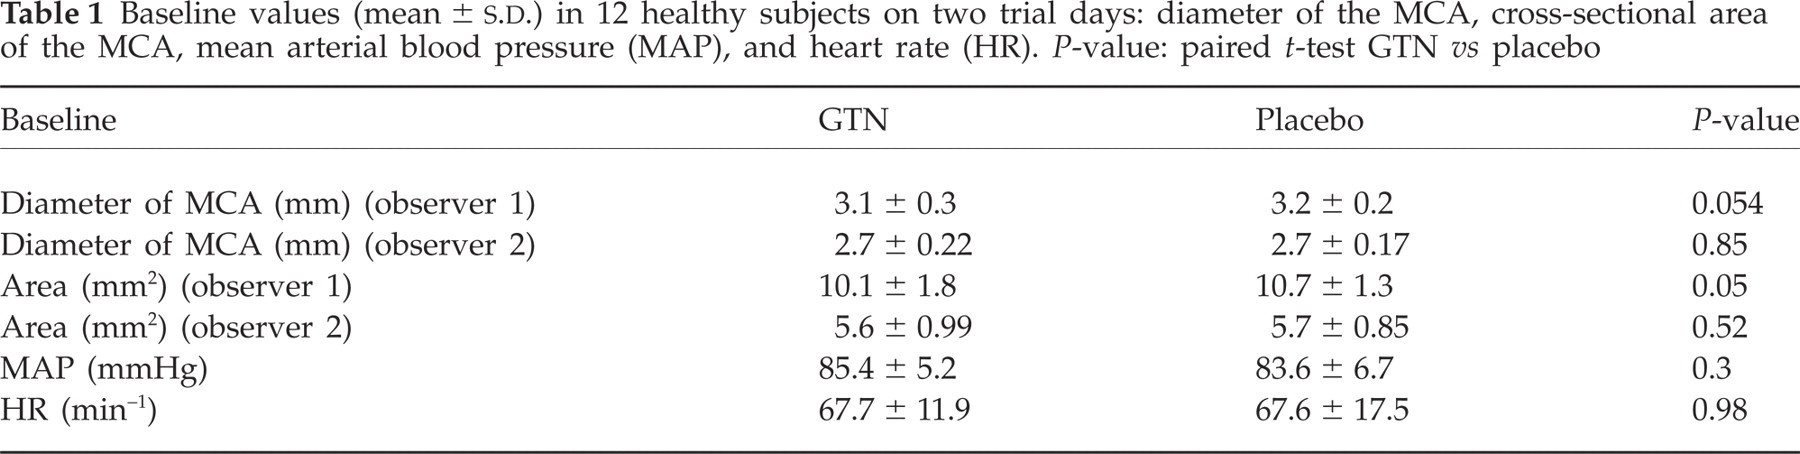
For all tested variables, there were no differences at baseline between GTN and placebo (P > 0.05) (Table 1). There were no carry-over or period effects either for headache, diameter or cross-sectional area of the MCA (P > 0.05).
Baseline values (mean ±
The diameter of MCA
Observer 1 found the AUC of the MCA diameter significantly greater after GTN (215 ± 23) than after placebo (206 ± 17) (P = 0.013) (Fig. 1a). Observer 2 also found that the AUC of the MCA diameter was greater after GTN (190 ± 17), than after placebo (176 ± 13) (P = 0.006).

(a) Diameter of the middle cerebral artery (mm) at 1.5 Tesla MRA in 12 healthy subjects. Both observers reported significantly larger diameter after GTN than after placebo (observer 1, P = 0.013; observer 2, P = 0.006). (b) Cross-sectional area of the middle cerebral artery (mm2) at 1.5 Tesla MRA in 12 healthy subjects. Both observers reported significantly larger cross-sectional area after GTN than after placebo (observer 1, P = 0.024; observer 2, P = 0.008). Thick line in figures shows mean values.
The cross-sectional area MCA
Observer 1 found that the AUC for the cross-sectional area of the MCA after GTN (745 ± 155), was significantly greater than after placebo (684 ± 87) (P = 0.024). The same results were obtained from observer 2, where the AUC for the cross-sectional area of the MCA after GTN (431 ± 76), was significantly greater than after placebo (370 ± 55) (P = 0.008) (Fig. 1b).
Intra- and inter-observer variation
The intra-observer variation (day-to-day) at baseline was 8.3% for observer 1 and 10.9% for observer 2. The mean inter-observer variation of the cross-sectional MCA area was 15.5% and for the diameter measurements 8%. The side to side variation at baseline was 10.6% for observer 1 and 10.0% for observer 2.
The Bland-Altman analysis of the MCA diameter showed an average difference between the observers of 0.38 mm after GTN and an average difference between the observers of 0.45 mm after placebo. The data for the MCA cross-sectional area revealed an average difference between the observers of 4.8 mm2 after GTN, and 4.8 mm2 after placebo. The variability of the measurements, also called ‘95% limits of agreement’ (12), (±1.96 ×
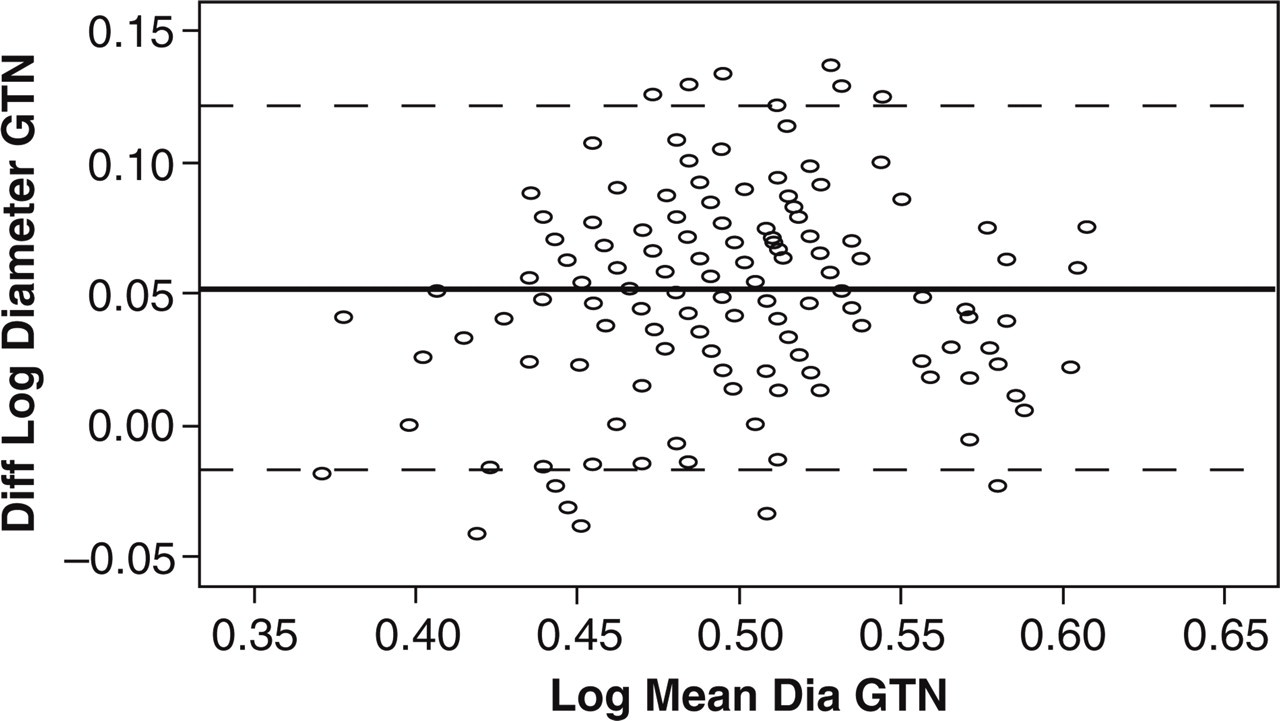
Log transformed Bland-Altman analysis of the diameter of the MCA on the GTN day. Numbers on x-axis indicate the log of the average value of diameter of the MCA on the GTN day and the y-axis shows the log of the difference between the two observers. Mean difference between observers was 0.38 mm and limits of agreement (−0.11 to 0.87 mm). Thick line is mean, and thin lines represent 95% confidence intervals (95% limits of agreement (mean ± 1.96 ×
At baseline, there were significant differences between investigators, for both cross-sectional area and diameter of the MCA on both study days (P < 0.001). There were significant differences between investigators in the measurements of the AUC for both diameter and cross-sectional area of the MCA on both study days (P < 0.001).
Relative changes of the diameter and cross-sectional area of the MCA
We found significant differences in the relative changes (percentage from baseline) for diameter and cross-sectional area of the MCA between GTN and placebo (observer 1, P < 0.001; observer 2, P < 0.05).
Both observers reported the peak increase in MCA compared with baseline 15 min after the start of the infusion on both days. Observer 1 found a peak increase in the diameter of the MCA of 10.6% ± 7.1 after GTN and 1.3% ± 4.3 after placebo. The mean difference in response between GTN and placebo at T15 was 9.4% (5.3–13.4, 95% CI). Observer 2 found a peak increase in the diameter of the MCA of 14.8% ± 7.9 after GTN and 1.2% ± 4.7 after placebo. The mean difference in response between GTN and placebo at T15 was 13.6% (8.7–18.5, 95% CI).
For the cross-section measurements, observer 1 found a peak increase in the cross-sectional area of the MCA of 23.2% ± 11.1 after GTN and 1.9% ± 7.3 after placebo. The mean difference in cross-sectional area between GTN and placebo at T15 was 21.3% (16.0–26.7, 95% CI). Observer 2 found a peak increase in the cross-sectional area of the MCA of 31.6% ± 18.2 after GTN and 2.4% ± 9.05 after placebo. The mean difference in response between GTN and placebo at T15 was 28.7% (17.8–39.5, 95% CI). Images from two subjects on the GTN day are shown in Fig. 3(a, b).

(a) Measurement of the diameter of the left MCA in one subject on the GTN day. The image on the left shows baseline recording of the diameter (2.8 mm). The image on the right shows a peak increase in the diameter of the MCA (3.8 mm) 20 min after the start of the infusion. (b) Measurement of the cross-sectional area of the left MCA in one subject on the GTN day. The image on the left shows baseline recording of the cross-sectional area (12.7 mm2). The image on the right shows a peak increase in the cross-sectional area of the MCA (18.4 mm2) 20 min after the start of the infusion.
There were no differences between investigators in the measurements of the relative changes in diameter or cross-sectional area of the MCA, either after GTN or after placebo (P > 0.05).
GTN-induced headache
In the initial 60 min, the AUC after GTN, 59 (17.5–137), was significantly higher than after placebo, 0 (0–16.3) (P = 0.005). During the GTN infusion, 11 out of 12 subjects developed a headache without associated symptoms, while 5 out of 12 subjects developed a headache during the placebo infusion. On the GTN day, the headache intensity reached its peak 15–25 min after the start of infusion (median 2), and 9 out of the 12 subjects developed a headache during the 10 h following infusion. On the placebo day, 4 out of the 12 subjects developed a headache during the 10 h following infusion. In the 10 h follow-up phase, the AUC after GTN, 1.5 (0.25–3.4), was significantly higher than after placebo, 0 (0–0.34) (P = 0.012). None of the subjects developed migraine-like headache or migraine, according to the International Headache Classification criteria (14).
Correlation analysis of headache and the cross-sectional area of MCA
We found a significant correlation between the headache and the cross-sectional area of the MCA for observer 2 (P = 0.012) after GTN, while no significant correlation was found for observer 1 (P = 0.32).
Vital signs
There were no differences in mean arterial blood pressure (P = 0.10) and heart rate (P = 0.29) between the two experimental days.
Discussion
The major outcome of the present study is that changes in diameter and cross-sectional area of the MCA during GTN-induced headache may be recorded almost continuously using MRA at 1.5 Tesla. Furthermore, the present study demonstrates that the MRA method provides a reliable quantitative estimate of the diameter changes in the intra-cerebral arteries after intravenous infusion of GTN.
Previous studies
Previous studies reported dilatation of MCA during acute GTN-induced headache using TCD, PET and SPECT techniques (5–7). MRA yields direct measurements of the intra-cerebral arteries, and the absence of ionizing radiation makes MRA preferable for repeated measurements to CT-angiogram, SPECT and PET. Repeated MRA measurements of the intra-cerebral arteries have been applied for the evaluation of stenosis of the carotid arteries (15), the risk stratification of atherosclerotic plaques (16, 17), and the monitoring of the effect of antihyperlipidemia therapies (18).
One study reported that hyperventilation did not affect the MCA diameter recorded by MRA (19). In a TCD study examining the impact of diameter changes in the basal cerebral arteries on the volume flow index, sublingual GTN was used as vasodilator and MRA was used to record the diameter of the MCA (20). The authors, however, did not report the magnitude of the dilatation recorded by MRA.
In the headache research, MRA has been used in cluster headache patients to study the diameter of the basilar and carotid arteries during GTN-induced (sublingual and inhalation) attack (21–23). These studies reported that GTN dilated the intracranial part of basilar and carotid arteries. Matharu et al. found that GTN did not dilate the extracranial part of the internal carotid artery after GTN in a cluster headache patient (24). It has been shown that unilateral application of the pain-producing compound capsaicin caused an ipsilateral dilatation of the intracranial part of the internal carotid artery of almost 40% and only a minor dilatation was seen in the extracranial part of the internal carotid artery (23, 25). Based on these data, the authors suggested that vasodilatation is a reflex response to the nociceptive input, rather than the generator of pain (23).
Present results
MRA has previously not been validated for examining possible diameter changes of the MCA during GTN-induced headache. We demonstrated that the AUC of the MCA diameter and cross-sectional area were greater after intravenous infusion of GTN than after placebo. We found differences in the measurements of diameter and cross-sectional area between observers, while there were no differences between observers when analysing the relative changes of diameter and cross-sectional area. Thus, in spite of numeric inter-observer variation the MRA method may provide a reliable semi-quantitative index of vascular changes in intra-cerebral arteries after infusion of GTN.
The variability of the MRA of the MCA in headache research has to our knowledge not previously been tested. We found the variability of the MRA method as least as good as TCD data of the MCA (11), with a day-to-day variation between 8 and 11% (TCD 16%), and inter-observer variation of between 8 and 16% (TCD 13%). The variability of MRA recordings were comparable with MR studies of the carotid arteries (16, 26, 27). Interestingly, we found a side-to-side variation of MCA between 10 and 11% (TCD 20%). Therefore, normal variation should be taken into account in future MRA studies focusing on laterality of MCA dilation during spontaneous migraine attacks (28, 29).
There are several sources for the variation between the observers, one being the difference between manual and automated measurements. Manual measurements of angiograms are as accurate as automated techniques for vessels with sizes larger than 1 mm (30). MRA studies on thoracic vessels showed significantly smaller cross-sectional areas with automated readings compared with manual recordings (31). It has been suggested that automated readings are more accurate because of a more consistent way of dealing with the partial volume problem (32). Similarly, in the present study, the automated approach also gave the smallest numeric values of the MCA.
Former studies have reported a correlation between the onset of pharmacologically induced headache and dilation of the MCA (33, 34). We did an explorative post-hoc correlation analysis of the headache score and cross-sectional MCA area for the whole observation period. The data showed a correlation between these variables for observer 2, while observer 1 found no statistical correlation. The quantitative effect is, however, rather limited even for observer 2, as a change of one in headache score corresponds to only 2.5% change (CI 0.5–4.5%) in area. This difference between observers may be due to the variability between manual (observer 1) and computer-based readings (observer 2) of MRA data.
Can the variability be improved?
The use of gadolinium contrast-media improves blood signal intensity over that of the parenchyma because the blood–brain barrier confines the contrast agent to the vascular compartment, and thereby gives a better visualization of small arterial branches and veins. Thus, it has been shown that the vessel area of the MCA demonstrated by gadolinium-enhanced cerebral 3D time-of-flight MRA is larger than without contrast (35). However, the use of contrast media carries the disadvantages of increased cost, superimposition of veins and enhanced soft tissues (36). Furthermore, experimental headache models and pharmacological studies require serial measurements of the diameter changes over time, and in most studies contrast cannot be used. In addition, the most proximal segment of the MCA is large enough to be accurately estimated without contrast and was therefore chosen for our study.
It is difficult to determine the exact diameter of an intracranial vessel by MRA but the quality of the images may improve with decreased voxel size (37). There are other factors limiting the accuracy of the MRA method, such as low resolution and saturation effects, which may lead to underestimation of the diameter measurements (38). A comparison between 1.5 and 3.0 Tesla MRI showed a superior quality at higher field strength (39). It is possible to achieve a better suppression of background signal at 3.0 Tesla compared with 1.5 Tesla. Using even higher field strengths it is now possible to visualize the more peripheral small vessels, all the way into the cerebral cortex in experimental settings (40, 41). We used 1.5 Tesla, because it is generally available, and we focused on the large intra-cerebral vessels at the base of the brain, as these vessels are most relevant to headache research (6, 42). With more sophisticated MRI methods it is now possible to study small pial arteries (40) and blood flow in the MCA using phase-contrast MRI imaging (43, 44), and to detect neuronal activation along the neuroaxis by functional MRI (45).
Acknowledgements
The authors wish to thank associate professor Lene Theil Skovgaard, Department of Biostatistics, University of Copenhagen, for help with the correlation analysis, and the radiographers Bente Sonne M⊘ller, Eduardo Hansen, Marjut Lindhardt, Jeannie Blom Hansen and Dorthe Madsen at the department of Ultrasound and Radiology, Glostrup Hospital, for their dedicated and excellent assistance conducting the MRA scans. The study was supported financially by the University of Copenhagen and the Danish Headache Soceity.