
Abstract
Some migraineurs have increased thresholds for the detection of global dot motion. We investigated whether migraineurs show consequential abnormalities in the determination of direction of self-motion (heading) from simulated optic flow. The ability to determine heading from optic flow is likely to be necessary for optimal determination of self-motion through the environment. Twenty-five migraineurs and 25 controls participated. Global dot motion coherence thresholds were assessed, in addition to performance on two simulated heading tasks: one with a symmetrical flow field, and the second with differing velocity of optic flow on the left and right sides of the participant. While some migraineurs demonstrated abnormal global motion coherence thresholds, there was no difference in performance on the heading tasks at either simulated walking (5 km/h) or driving (50 km/h) speeds. Increased global motion coherence thresholds in migraineurs do not result in abnormal judgements of heading from 100± coherent optic flow.
Introduction
Several studies have demonstrated that migraineurs have increased visual thresholds for detecting globally coherent motion within a noisy background, relative to non-headache controls (1–3). That is, given a field of dots where some are moving in a common direction and most moving in random directions, a higher percentage of dots are required to move in the common direction for the migraine group to detect that motion. These studies identified a group mean difference in performance between those with migraine and non-headache controls. Some people with migraine have particular difficulty identifying global dot motion, whereas others perform within the normal range (1). Similar levels of performance have been measured in migraine with aura and migraine without aura groups (1). It has been proposed that abnormal global motion perception may be consistent with a generalized anomaly of cortical neural function in people with migraine (1), such as identified in other studies using psychophysics (4–7), electrophysiology (for review see (8, 9)), or transcranial magnetic stimulation (10–12).
Optic flow describes the pattern of velocity vectors on the retinal image plane when an observer moves through the environment (13). Figure 1 shows an example of an optic flow field when an observer is moving on a straight path through a stable environment with no head or eye movement, or body rotation. The velocity vectors radiate outwards from the ‘focus of expansion’ (FOE). The FOE indicates the direction in which the observer is heading and it has been established that optic flow cues alone provide sufficient information to determine the direction of self-motion (14, 15). In more natural situations, rotation caused by eye or head movements, or self-motion along a curved path, results in a more complicated pattern of optic flow than the simple translation shown in Fig. 1. Psychophysical studies demonstrate that humans are able to determine heading from more complicated combinations of translational and rotational optic flow (16, 17) as would occur due to head rotation or following a curved path. In natural settings, there are also other visual cues that indicate the direction of heading, hence, in the real world additional cues such as perceived target location are also likely to contribute importantly to the determination of heading (18, 19). Nevertheless, normal interpretation of optic flow is likely to be necessary for optimal assessment of self-motion through the environment and is potentially an important visual cue for tasks such as driving.

Example of translational optic flow field. FOE, Focus of expansion.
A considerable amount of converging evidence suggests that the medial superior temporal extrastriate cortical area (MST) has the neuronal architecture capable of determining heading from optic flow (for example, see (20–22)). MST is part of the cortical visual motion pathway, which transmits information from the primary visual cortex (V1), through area V5 and subsequently to MST (23). Neurons have increasing receptive field size and complexity with ascension through this pathway (23). The ability to integrate global dot motion is a property of V5 and is considered a prerequisite for the proper determination of optic flow at MST and higher (20, 24). As migraineurs have been shown to have more difficulty detecting motion in global motion stimuli than controls (1–3), there is a possibility that migraineurs may also demonstrate abnormalities in the processing of optic flow information.
The purpose of the current study was to determine whether migraineurs perform differently from non-headache control subjects when performing tasks of simulated heading. We investigated whether people with migraine made more aberrant judgements of heading and whether they were more variable in their judgements of heading. Performance was assessed using both a standard simulated heading task consisting of a simulated ground plane of moving dots to create optic flow consistent with moving forward through the environment, and also a simulated heading task where the optic flow information was moving at a greater velocity on one side of the display relative to the other. The presence of a relative velocity difference in optic flow stimuli biases the perception of heading (25, 26). We aimed to determine whether migraineurs are influenced by differences in the velocity of simulated optic flow in a manner comparable to non-headache controls. Both tasks were performed at simulated walking speed (5 km/h) and driving speed (50 km/h).
Methods
Subjects
Twenty-five people with migraine and 25 non-headache controls participated. Migraine and control groups were approximately age matched (median age migraine = 26 years, range 18–43; median age control = 26 years, range 18–47). Fifteen of the migraineurs and 14 of the control participants were female. Migraineurs were required to meet the classification criteria of the International Headache Society (1988) for either migraine with aura (MA) or migraine without aura (MoA) (27). Thirteen of the 25 migraineurs were classified as MA. Headache severity was assessed using the Migraine Disability Assessment (MIDAS) questionnaire (28), a self-report measure that assesses an individual's migraine severity by the number of days that their headaches have prevented them from completing day-to-day activities. The MIDAS scores and classifications of subjects in the migraine groups are shown in Table 1.
MIDAS questionnaire scores for the participants with migraine

As this study involved the assessment of visual function, ocular and visual inclusion criteria were applicable to all subjects. Subjects were required to have best corrected visual acuity of 6/7.5 or better, refractive errors less than ±5.00 diopters sphere and ±2.00 diopters astigmatism, normal anterior eye and ophthalmoscopic examination, no history of systemic disease known to affect ocular function with the exception of migraine, and were not permitted to be taking medications known to affect visual field sensitivity or contrast sensitivity.
Subjects with migraine were tested at least 4 days after the cessation of their most recent attack to avoid possible transient effects on performance due to medication or fatigue. All subjects provided written informed consent in accordance with a protocol approved by the University of Western Australia Human Research Ethics Committee and in agreement with the tenets of the Declaration of Helsinki.
Global motion thresholds
The global motion task was performed using custom software developed using Matlab 6.0 (Mathworks, Natick, MA, USA) and displayed using a Cambridge Research Systems VSG 2/5 graphics card (Cambridge Research Systems, Rochester, UK) on a gamma corrected Philips (Model GD-402) 21-in grey-scale monitor (100-Hz refresh rate). Subjects viewed the monitor from 75 cm using a chinrest to maintain accurately the viewing distance. Subjects wore refractive correction if required and viewed the stimulus monocularly with foveal fixation. Performance was assessed for each subject's preferred eye.
The global motion stimulus was designed to be identical to a previous study (1) for replication purposes and consisted of 100 moving random dots within a 10° circular aperture. A percentage of dots moved downwards (signal dots) while the remaining dots (noise dots) moved in random directions. To create the motion percept, an eight-frame movie sequence was displayed, where each frame was shown for 50 ms with no interframe interval. The stimuli were constructed to remove coherent local motion signals (provided that the coherence level was low) by choosing different dots to be signal on each frame of the dot motion movie sequence. This stimulus design minimizes the utility of tracking individual dots (a local motion cue) to establish the percept of coherent global motion. Rather, it is necessary to integrate the motion information globally to perceive the coherent motion signal.
The dots were white (75 cd/m2), 8.6 min arc in diameter and were presented on a black background (0.5 cd/m2). The remainder of the screen was also black. The dots were moving at a velocity of 2.86°/s. Noise dots were displaced in random directions excluding ±10° of the signal direction (downwards). If the displacement moved the dots outside of the 10° circular aperture they were randomly replotted within the circle on the next frame. Dots were not allowed to be signal dots if the necessary displacement would move them outside the borders of the circular aperture.
Stimuli were presented in a two-interval forced choice (2IFC) design. The subject heard a tone and then a global motion stimulus was presented. After a 500-ms interstimulus interval, a second tone was heard, followed by a second stimulus presentation. One of the patterns contained coherent motion signal and the other only random motion. The subject was required to choose which of the presentation intervals contained the coherent motion. The percentage of dots moving in the signal direction was varied according to a staircase strategy. After three consecutive correct responses the signal level was decreased. The percentage of signal dots was increased for every incorrect response. This three-down, one-up design results in the staircase converging on the approximate 79% correct performance level (29). The signal level commenced at 50 dots out of the total 100 dots and the initial staircase stepsize was eight dots. This stepsize was halved on the first three reversals, resulting in a final stepsize of one dot. The staircase terminated after seven reversals, with the mean of the last four reversals determined as the staircase result. Two staircases were interleaved and the mean of the results of the two staircases was taken as the motion coherence threshold for each subject.
Heading task 1: standard simulated heading task
The optic flow stimulus was presented using a Matrox Parhelia graphics card (Matrox Graphics Inc., Montreal, Canada) that was used to drive three Sony G520 20-in monitors (60-Hz refresh rate). The three monitors were arranged so that the central monitor was touching two flanking monitors which were orientated at 20° to the central monitor. Subjects sat 1 m in front of the central monitor. The field of view of each monitor was 22.05° × 16.96°, with a 4.29° gap between the central and peripheral monitors due to the monitor casing. The display was viewed with the subject's preferred eye. The optic flow task was performed by custom software written in C++ using OpenGL. The background luminance of the screen was 0.5 cd/m2.
The display simulated the flow field of an observer moving across a ground plane as illustrated in Fig. 2. The simulated horizon was placed at 30 m. The flow field was comprised of small dots (1.65 min arc, 1 pixel, 100 cd/m2) at a density of 4 dots/m2 of the simulated ground plane. Simulated eye height above the ground plane was 1.7 m. The edges of the monitors were obscured by black tape and the equipment was situated in front of a black background in a darkened room.
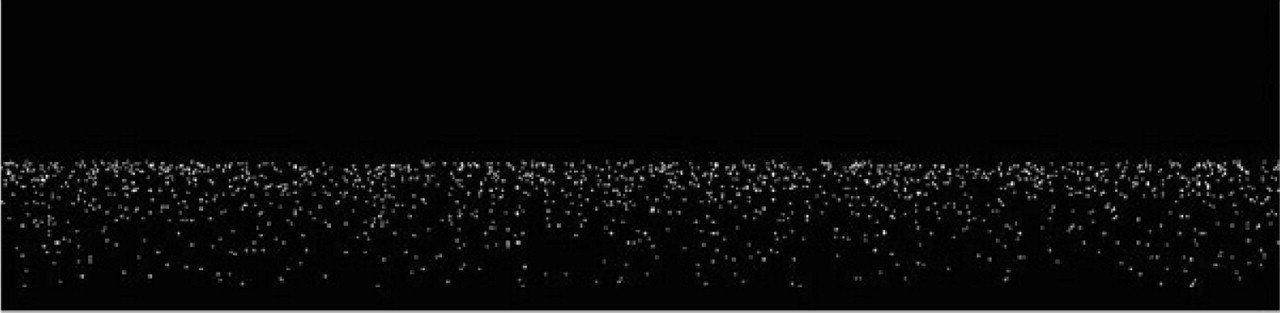
Optic flow ground plane constructed using random dots and used for heading task 1.
For each presentation, the flow field appeared for 1 s. After the disappearance of the flow field, a vertical line cursor (20 pixels high, 1 pixel wide) appeared in the centre of the middle monitor. Subjects were instructed to move the cursor using a computer mouse to indicate their perceived heading direction. Heading direction was selected at random from one of seven directions varied along the horizontal axis (±8°, ±4°, ±2° and 0°; which was the centre of the middle screen). Each of these directions was presented 10 times, resulting in a total of 70 trials per run.
Each observer performed two runs, one with the speed of the optic flow field designed to simulate walking (5 km/h) and one with the speed designed to simulate driving (50 km/h). The order of the speeds was randomized between participants and balanced between migraine and control groups. All subjects practised the task prior to commencing the experiments. The practice run was the same for all participants and consisted of an abbreviated experiment, where each of the test conditions was presented twice rather than 10 times. Subjects found the task easy to perform and all reported feeling comfortable with the procedure after this level of practice. The practice data were inspected qualitatively prior to the commencement of the main experimental runs, to ensure that the subjects correctly understood the task requirements.
Heading task 2: simulated heading task with asymmetrical optic flow velocity
Heading task 2 used a simulated ground plane constructed from a field of dots of the same size and density as used for heading task 1. For heading task 2, only three directions of simulated heading were used (±1° and 0°). On some trials, the speed of the optic flow was different on the left- and right-hand sides of the display. The speed differed from the centre of the middle display, not just on the peripheral monitors. One side was set to the base speed [either simulated walking (5 km/h) or driving (50 km/h)]. The speed of the other side of the display was set to be either the same as the base speed, double the base speed, or three times the base speed. The central 10° of the optic flow stimulus was removed (see Fig. 3) to avoid the appearance of an edge created by motion shear at the location where the faster and slower optic flow fields met in the centre of the screen. The optic flow field was presented for 1 s and then a vertical cursor appeared as for heading task 1. Subjects were instructed as follows: ‘Imagine you are traveling over the ground. You may feel that you are turning a corner. Place the cursor in the direction that you are next travelling’.
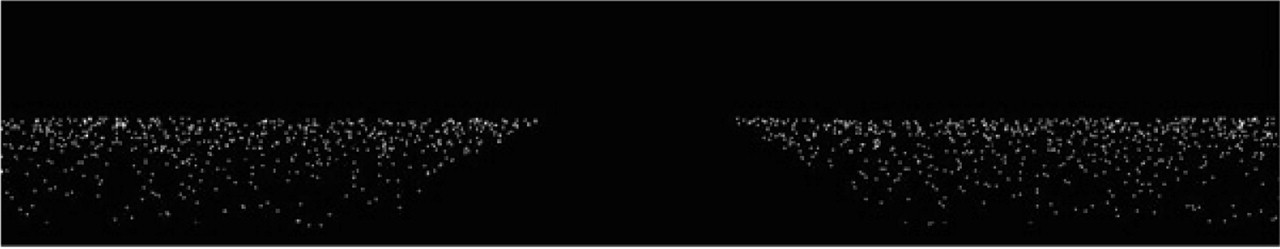
Illustration of the random dot ground plane optic flow field used for heading task 2.
The three directions of simulated heading (±1° and 0°) and five combinations of speed (same on each side, double on the right, double on the left, triple on the right, triple on the left) were combined in a single run. Ten trials of each condition were performed, resulting in 150 trials per run. Each observer performed two runs: base speed set to walking speed (5 km/h) and base speed set to driving speed (50 km/h). Each subject received practice as described for heading task 1.
Results
Global motion task
There was no significant difference in motion coherence thresholds between the MA and MoA groups (t(23) = 1.34, P = 0.19), so all migraine subjects were pooled for subsequent analysis. Figure 4 plots the distribution of motion coherence thresholds for migraine and control groups. Migraine group mean performance was significantly worse than controls (t(48) = −2.18, P = 0.03), yet there was substantial overlap of migraine and control performance. These findings are consistent with previous reports (1–3).

Distribution of motion coherence thresholds of migraine and control groups.
Heading task 1 results
Figure 5 shows data collected from two of the control subjects for heading task 1 conducted at simulated walking speed. The symbols represent the mean of the 10 measures of perceived direction collected for each simulated direction of heading. The error bars show the standard deviations of those 10 measures (a measure of individual subject variability). Both curves are well fit by linear regression; however, the slope of the curves differs markedly. These examples were chosen to represent the steepest and flattest ranges of normal performance. Both subjects demonstrated a bias towards the centre of the monitor, as indicated by the slopes of the curves being shallower than the dotted line. Central bias in heading tasks is well documented (30, 31).
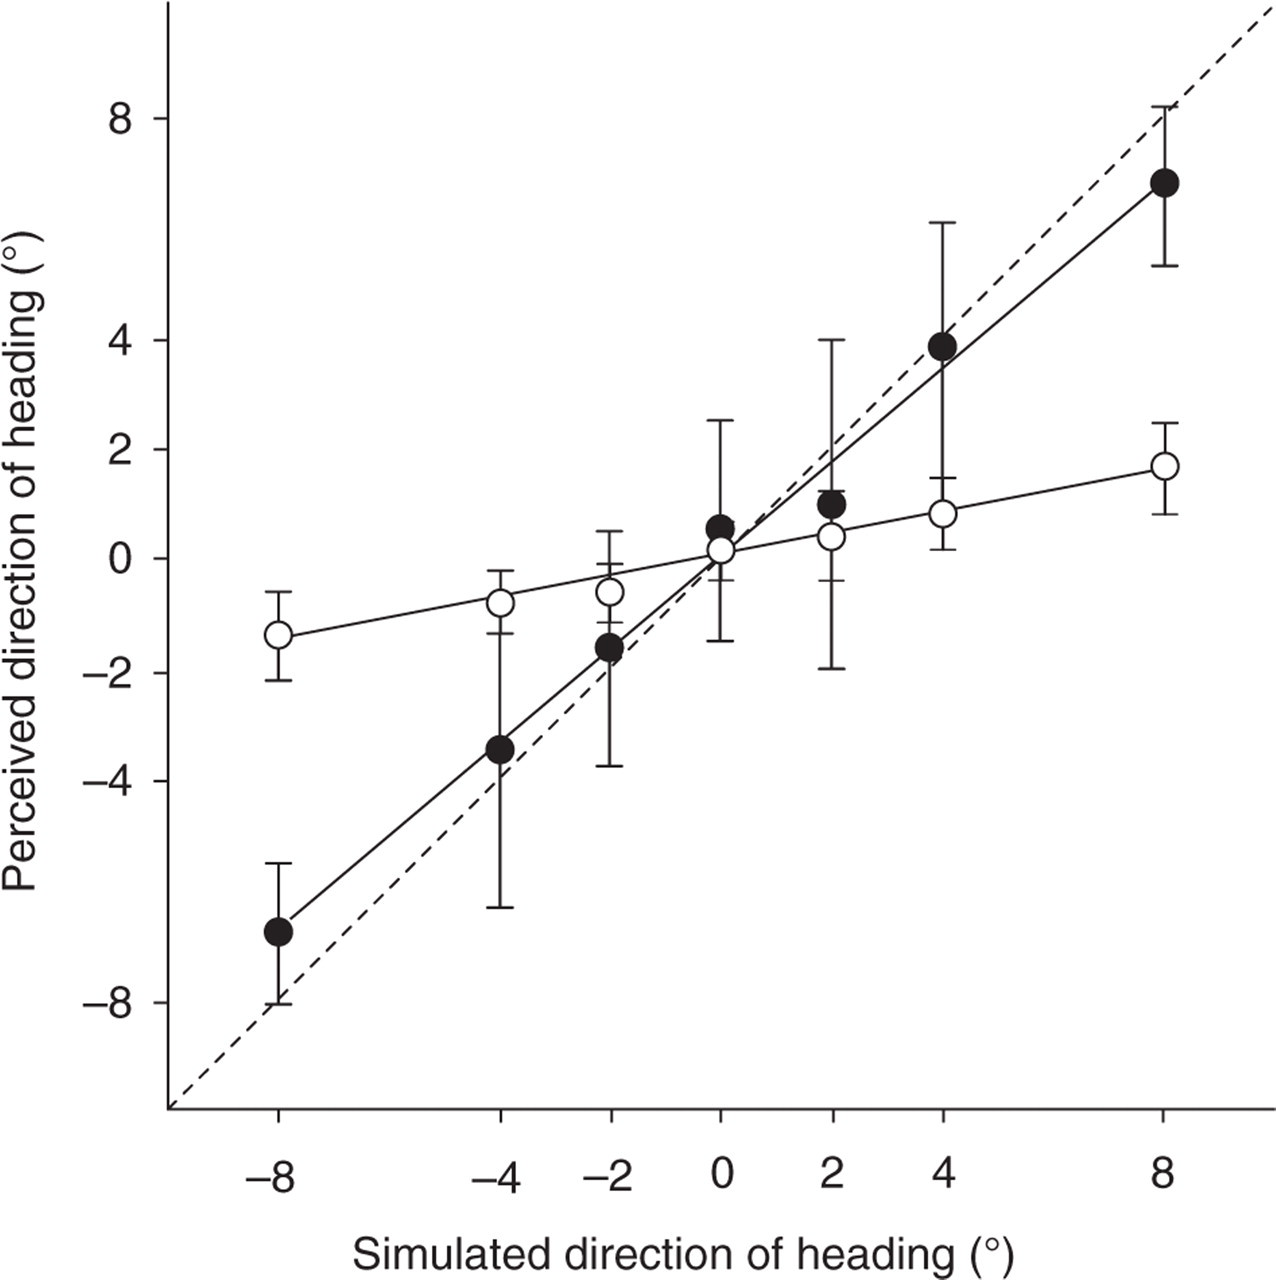
Example data collected from two control subjects (open and closed symbols) for heading task 1 where the speed of the optic flow field was set to 5 km/h. The straight lines represent the best fitting linear regressions. The dotted line demonstrates the outcome if the perceived direction of heading is identical to the simulated direction of heading.
Group mean perceived direction did not differ between migraine and control groups and is shown in Fig. 6a (walking speed) and 6b (driving speed). The data from each individual were fit with a straight line (as shown in Fig. 5) and the distribution of the best fitting slopes of these lines are shown in Fig. 6c,d for walking and driving speed, respectively. The linear regression slope was significantly steeper for driving speed compared with walking speed but did not differ between migraine and control groups (two-way repeated measures

Performance on heading task 1. (a,b) Group mean perceived direction as a function of simulated heading direction. ○, Controls; •, migraine. (c,d) Histograms of the distribution of slopes of the best fitting linear regressions for individual subjects. ▪, Migraine with abnormal global motion; □, migraine with normal global motion; ––––, controls. (e,f) The mean response variability (SD of the 10 heading judgments made by each subject for each simulated direction of heading). ○, Controls; •, migraine.
Figure 6e,f compares the performance variability of the migraine and control groups (determined for each subject as the SD of the 10 heading judgements for each condition). Migraine subjects were not more variable than control subjects at either speed and performance variability did not differ with direction of simulated heading (two-way repeated measures
Heading task 2
Heading task 2 was designed to measure whether participants’ judgements of perceived heading were altered by the simulated ground plane having faster optic flow on one side of the display relative to the other. Data were collected for three heading directions: −1°, 1° and 0°, where 0° represents the condition where the centre of the optic flow stimulus was at the centre of the three-monitor display. For each simulated heading direction, the difference between the perceived heading and the simulated heading was determined and is referred to subsequently as heading bias. As inspection of the data revealed no difference in the magnitude or direction of heading bias between the conditions (±1, 0°), heading bias for these three conditions was pooled (justified below). Hence, for each subject, 30 trials (10 for each of the three heading directions) were averaged to determine a mean heading bias for each of the five asymmetric speed conditions (same speed on both sides of the display, double speed on the left or right, triple speed on the left or right). Examples of the data obtained for two of the controls subjects are shown in Fig. 7.
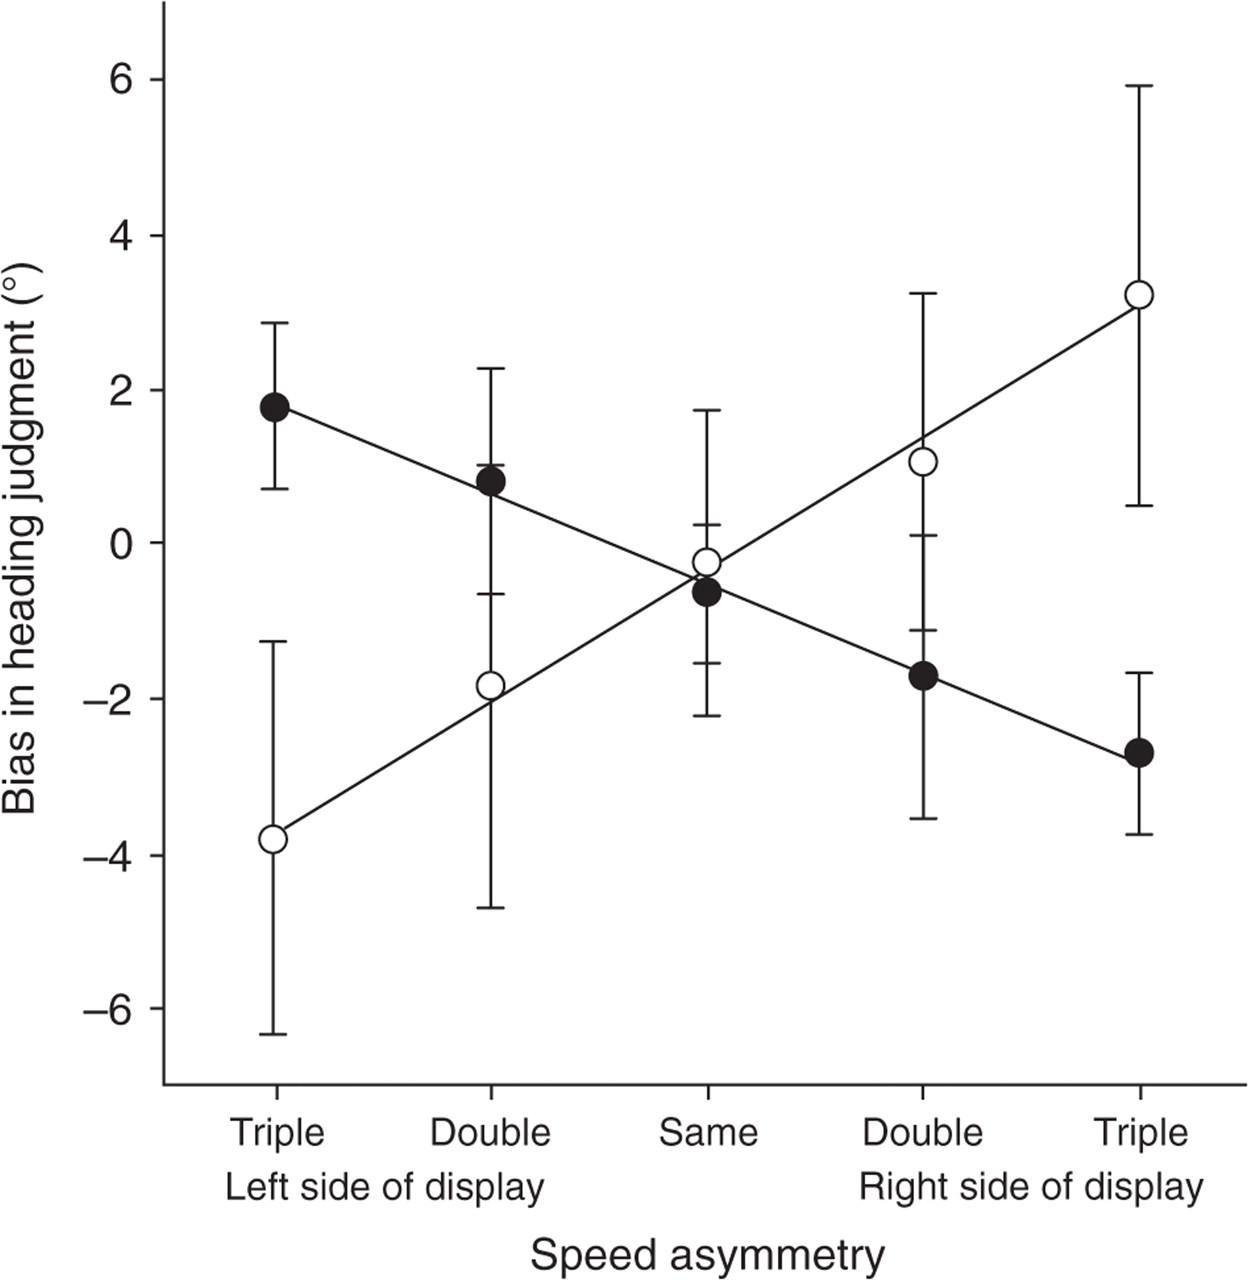
Example of heading task 2 performance for two control subjects. The symbols respresent the mean difference between the simulated heading direction and the perceived heading direction (pooled for heading directions of ±1° and 0°). The error bars represent the SD of this pooled heading bias.
Figure 7 shows that altering the speed of the optic flow on one side of the display relative to the other influences the subjects’ perceived heading direction. One of these subjects felt their perceived heading to be drawn towards the faster side, whereas the other was pulled away. Both of these are valid percepts and have been reported previously for a similar task where the observers were approximately divided evenly between these two percepts (25). Within our sample 18 of 25 migraine participants and 13 of 25 controls indicated a perceived direction closer to the faster side of the display when optic flow was presented at simulated walking speed. For simulated driving speed, 16 of 25 migraineurs and 15 of 25 controls made heading judgements biased towards the faster side of the display.
To assist in data analysis given the two possible percepts shown in Fig. 7, the data for those subjects whose estimates of heading was biased away from the faster side of the display were inverted. Prior to this inversion it was confirmed that no significant differences were present in the magnitude of the two possible percepts. For each subject, a linear regression was fit to their data and there was no significant difference in absolute value of slope between subjects grouped according to whether their heading was biased towards or further from the faster side of the display (P > 0.05). Mean heading bias for migraine and control groups is shown in Fig. 8a,b for the walking and driving speed conditions, and the distribution of the slopes of the best fitting regression lines are shown in Fig. 8c,d. Asymmetrical optic flow produced a greater bias in perceived heading when presented at a base speed of 50 km/h than 5 km/h, but this did not differ between migraine and control groups (two-way repeated measures

Performance of heading task 2. (a,b) Group mean bias in heading judgement as a function of speed asymmetry. ○, Controls; •, migraine. (c,d) Histograms of the distribution of slopes of the best fitting linear regressions for individual subjects. ▪, Migraine with abnormal global motion; □, migraine with normal global motion; ––––, controls. (e,f) The mean response variability (SD of the heading bias for the 30 judgements made by each subject for each speed asymmetry). ○, Controls; •, migraine.
Figure 8e,f compare the performance variability of the migraine and control groups for heading task 2 [determined for each subject as the SD of the 30 heading judgements (10 each for simulated heading directions of +1, −1 and 0 degrees) for each speed asymmetry condition]. There is a trend for the migraine group to have higher variability in performance but this did not reach statistical significance for either walking (F(1,48) = 3.04, P = 0.09)) or driving (F(1,48) = 0.85, P = 0.36) speeds.
Discussion
This study confirms that some migraineurs demonstrate abnormalities on global motion coherence tasks (1–3). Some migraineurs have normal thresholds but others are distinctly abnormal. Here we demonstrate that those individuals with abnormal global motion coherence thresholds do not differ in their determination of heading from simulated optic flow when compared with either other migraineurs or non-headache controls.
One possible explanation for the findings of this study is simply that the measures of heading and motion coherence did not have a similar sensitivity to detect small magnitudes of abnormality. We do not think that this explanation is valid. Prior to commencing the main experiments we pilot tested a group of 10 normal observers on heading task 1 to investigate the variance of normal performance on this task. We were hoping to find a difference between the mean migraine and control group performance of approximately 30%, as this is similar to the magnitude of difference in group mean threshold that we have found between migraineurs and controls for motion coherence tasks previously (1), and indeed in this study. A power analysis based on the variance of the initially tested normal subjects (assuming a slightly higher variance for the migraine group) demonstrated that a sample size of 25 in each of the migraine and control groups gave a power of 0.80. Hence, we consider the sample size included in this study to be sufficient to identify a deficit of a magnitude likely to be functionally important.
We found no relationship between global motion coherence thresholds and heading performance for either migraine or control groups, suggesting that performance on this task is not predictive of determination of heading from optic flow. The global motion task measures the minimum percentage of dots required to create a global motion percept. It does not measure the accuracy of global motion direction discrimination, which may be a more critical measure predicting heading performance. Alternately, our optic flow stimuli were created with 100% of dots conforming to the optic flow pattern. It may be that individuals with impaired global motion perception have more difficulty in determining heading from optic flow if noise dots flowing in random directions are included in the optic flow stimulus. Such low-coherence optic flow stimuli are rarely applicable to natural viewing conditions, so were not employed here. The current study suggests that threshold problems in determining global motion direction do not convert to suprathreshold problems with determining heading direction.
A further possible explanation for our findings is the fact that MST neurons have very large receptive fields (20–22). This large spatial pooling is likely to make the optic flow system robust to mild abnormalities. If motion coherence deficits are patchy across the visual field (1), MST neurons may largely recruit from areas of normal performance. The determination of heading from optic flow has been shown to be robust to large constrictions of visual field provided that the stimulus duration is no shorter than approximately 1 s (30). Observers are able to compensate for field deficits by making eye movements. Our migraine subjects may have had more difficulty than controls if the stimulus duration had been reduced.
In this study we deliberately chose to explore heading performance using stimuli where the only significant cue to heading direction was optic flow. This is not a situation that is likely to occur in many real world settings. There are typically other visual cues to direction such as fixed objects within the field of view, and it has been shown that positional direction strategies contribute significantly to our ability to determine direction of heading (18, 19). Furthermore, real world heading strategies enable continuous updating of heading position, whereas our experiments required a static judgement of heading at a single instant in time. We pilot tested a continuous heading task version of task 2 in normal observers where the subjects used a steering wheel to ‘drive’ along the ‘road’ which included both steep and shallow corners. We were hoping that this task would result in misjudgements of heading, particularly as people steered around corners when there was also an asymmetrical change in the velocity of optic flow on either side of the track. Instead, we found that subjects were no longer influenced by changes in velocity on either side of the track once they had a continuously presented road that could be used as a reference to steer towards. In the continuously presented task, subjects were able to update their steering using positional cues created both by the edges of the road and referenced to the horizon. This type of updating is not possible using the discrete, instantaneous version of the task. Consequently, in this study as a first step we decided to determine whether heading judgements obtained from optic flow cues alone are normal in people with migraine. Our finding of normal performance on these tasks does not preclude an abnormality with driving but suggests that, if such an abnormality exists, it is unlikely to be due to a gross disability in the interpretation of suprathreshold optic flow information.
It is reassuring that those individuals with migraine who demonstrate difficulties with global motion coherence tasks do not demonstrate abnormal heading perception for the tasks employed in this study. Subjects were able to make normal heading judgements at driving speed even when the optic flow velocity was unequal on either side of the display. Asymmetries in velocity of optic flow are a common situation in driving, e.g. when being overtaken by a faster vehicle. While this study does not directly assess whether our subjects demonstrated difficulties with driving, the findings imply that those with migraine are unlikely to have difficulties determining direction from optic flow that are of a magnitude sufficient to influence performance on everyday tasks. Our study was performed interictally, so does not preclude abnormalities being present during or immediately after migraine events.
Acknowledgements
A.M.M. is supported by a NHMRC Australian Clinical Research Fellowship (no. 139150). The project was supported by a University of Western Australia Research Grant (A.M.M.) and Australian Research Council Discovery Project no. 0346084 (D.R.B.).