
Abstract
Background: There are conflicting reports concerning the ability of people with migraine to detect and discriminate visual motion. Previous studies used different displays and none adequately assessed other parameters that could affect performance, such as those that could indicate precortical dysfunction.
Methods: Motion-direction detection, discrimination and relative motion thresholds were compared from participants with and without migraine. Potentially relevant visual covariates were included (contrast sensitivity; acuity; stereopsis; visual discomfort, stress, triggers; dyslexia).
Results: For each task, migraine participants were less accurate than a control group and had impaired contrast sensitivity, greater visual discomfort, visual stress and visual triggers. Only contrast sensitivity correlated with performance on each motion task; it also mediated performance.
Conclusions: Impaired performance on certain motion tasks can be attributed to impaired contrast sensitivity early in the visual system rather than a deficit in cortical motion processing per se. There were, however, additional differences for global and relative motion thresholds embedded in noise, suggesting changes in extrastriate cortex in migraine. Tasks to study the effects of noise on performance at different levels of the visual system and across modalities are recommended. A battery of standard visual tests should be included in any future work on the visual system and migraine.
Introduction
Research on visual perception in migraine has shown differences between migraine and control groups using diverse visual tasks, which have been attributed to anomalous processing at various stages within the visual system. Some studies have highlighted anomalies within retinal or subcortical retinofugal pathways (1,2), however, much of the research has concentrated on anomalous processing within the primary visual (striate) cortex and, more recently, within higher (extrastriate) visual cortical areas. For example, global motion tasks have been employed to assess differences in extrastriate cortical excitability between migraine and control groups. Several studies have reported impaired global motion discrimination in migraine (3–6), which has been explained by a general cortical hyperexcitability. On the other hand, there is a report that the perception of global motion in the dynamic motion after-effect is not impaired in migraine (7).
None of these global motion studies has adequately considered other visual parameters that might affect performance on a global motion task. Apparently impaired global motion discrimination could, for example, reflect dysfunction that occurs earlier in the visual pathways than in the extrastriate cortex. The importance of taking into account explanations of deficits in migraine at all levels of the visual system, even as early as the retina, has been emphasised by the recent findings of Karanovic et al. (8). They investigated detection and discrimination of flicker contrast in migraine, and compared these data with measures of visual discomfort, binocular acuity and refractive errors in each eye. They found different results between the migraine and control groups, dependent upon the underlying contrast in the blurred, flickering spots of light, which were in turn related to the amount of visual discomfort the individuals were suffering. They concluded that the heightened sensitivity in migraine that they had found may lie at many levels of the visual pathway, including as early as the retina (see also (2)).
One group did include assessments of global motion together with other visual tasks that were proposed to reflect activity in precortical pathways (3,4). They concluded that precortical visual dysfunction is likely to contribute to impaired global motion discrimination in migraine. They provided, however, only a qualitative assessment of deficits for individual observers across the different tasks, with no consistent pattern across observers. They did not provide quantitative correlations between patterns of deficits on the different tasks. Therefore, they could not determine to what extent a deficit in global motion perception could really be attributed to an abnormality in extrastriate cortical areas that code for global motion, or to an abnormality earlier in the visual system. The present study was designed to examine coherent motion-direction detection, global motion-direction discrimination and relative motion-direction discrimination in migraine and control groups, and to include potentially relevant covariates. To this end, tests of contrast sensitivity, visual acuity, stereo acuity, visual discomfort, visual stress, visual triggers and a dyslexia questionnaire were completed by all participants and formally correlated with performance on the motion tasks. Each of these measures taps into different levels of processing within the visual pathways, from the eye, to precortical and cortical visual and cognitive areas. They were included to assess the functioning of visual pathways other than the motion processing streams in extrastriate cortex.
Global/coherent motion perception in random dot displays
Much of the research on global motion perception has employed random dot kinematograms (RDKs). In RDKs, a number of dots move in a target direction (signal dots) and they can be interspersed with other dots moving in random directions (noise dots). The overall motion-direction signal is a function of the signal-to-noise ratio (coherence). The ability to perceive coherent motion depends upon the integration of information about the motion of individual dots (from local, first-stage, oriented, spatial and temporal frequency tuned filters) into a global motion percept, attributed to activity within extrastriate cortex (MT/V5, see (9)). Perceptually, as the coherence of the moving pattern increases, so does the ability to reliably discriminate the direction of the global motion.
Global/coherent motion perception and migraine
A curious feature of the coherent/global motion literature with RDKs is that the performance of the migraine participants appears to be a function of display duration. Antal et al. (5) found that their migraine participants’ detection of completely coherent motion-direction (all of the dots moved coherently in one direction) to be superior to their control group using brief displays (48 ms). On the other hand, impaired discrimination of coherent/global motion (when coherently moving dots are interspersed with dots moving in random directions) has also been reported, regardless of display duration (72 ms: (5); 400 ms: (4,6)). In these studies, the migraine groups needed a higher proportion of dots to be moving coherently for the global motion direction to be reliably discriminated against a background of randomly moving dots. This pattern was reported both when the dots moved relatively smoothly, changing their positions every 12 ms (5), or when the dots changed their positions every 50 ms, which would create the impression of ‘jerkiness’ (4,6). The similarity between the results using different motion-direction discrimination displays is consistent with a general visual deficit, as there is a difference in the visual processes underlying each of these percepts (10). Global motion-direction discrimination impairments were observed in both migraine with and without aura, suggesting similar underlying deficits.
To summarise, there are indications that the pattern of differences between migraine and control groups may depend on the task employed (detection vs. discrimination) and on display duration, but they come from different groups of researchers each using somewhat different displays. There are also indications that the pattern of differences between migraine and control groups on global motion discrimination tasks may reflect, at least in part, an abnormality in earlier visual pathways. These issues could be resolved if display duration was assessed using the same experimental stimuli, apparatus and participants, and if other lower and higher level potential deficits were measured. In this study, brief (50 ms) and longer (70 ms) display durations were included in coherent motion-direction detection trials to try to replicate the results reported by Antal et al. (5) and to determine performance for longer display durations. Global motion-direction discrimination was assessed with 300 ms displays. A battery of other standard tests of visual function was also included (see Methods).
Models of cortical function in migraine and global/coherent motion discrimination performance: Cortical neuronal hyperexcitability and display contrast
Both Antal et al. (5) and the McKendrick group (4,6) suggested impaired global motion-direction discrimination could reflect a general cortical neuronal hyperexcitability, which reduced the ability to distinguish signal from noise dots. There were, however, subtle differences between each account. McKendrick and Badcock (4) considered increased internal or endogenous background neural noise (spontaneous random neural firing unconnected to any visual stimulus) interfered with the coherent motion signal by interfering with the processing of both signal and noise dots. Rather than increased internal background neural noise, Antal et al. (5) suggested an elevated response to the noise dots interfered with an elevated response to the simultaneously presented signal dots.
Shepherd (7,11,12) suggested display contrast could be useful to tease apart predictions from different models of neural function in migraine, such as the two models described above. For example, if there is increased internal background neural noise compared to those without migraine, the signal-to-noise ratio would be lowered in migraine if there is not, in addition, a concomitant increase in the neural response to the signal dots. Motion-direction detection and discrimination with either low or high contrast displays should, therefore, be impaired in migraine, as the weak threshold signals that code motion direction would be lost in the elevated background noise. Detection and discrimination thresholds should also be impaired to a greater extent with low contrast displays than with high contrast displays as the weaker signal with low contrast displays would be more readily eclipsed by the elevated internal neural noise.
On the other hand, if a heightened sensitivity results in elevated activity to a stimulus, without an increase in the internal background noise, the neuronal response in migraine may be comparable to someone without migraine viewing a higher contrast pattern. The migraine group may then perform better at low contrasts on motion detection trials, compared to the control group, and group performance differences may decrease as contrast increases. A greater response to incoming signals, however, without increased background noise, may broaden the tuning curves of cortical neurons, which could lead to impaired discrimination thresholds, particularly at high contrasts (see 5,13).
Both of the earlier coherent motion studies used relatively high contrast displays ((5): 0.67 Michelson contrast, (3): 0.98 Michelson contrast). In this study, both high and low contrast displays were used. The dot density of the displays was also manipulated, using displays of either 50 or 300 dots, to test whether the spatial density of the moving pattern affects either group’s performance.
Relative motion perception in random dot displays
Relative motion thresholds were also obtained for the migraine and control groups. Sensitivity for detecting and discriminating relative motion is far greater than sensitivity to absolute motion, up to an order of magnitude more so (14,15), perhaps because relative motion is ecologically important in order to differentiate an object moving against a background. Relative motion is processed in the extrastriate cortex, in MST cells dedicated to this type of motion (16,17). Here, only the dots within a central region of a densely populated random dot display moved coherently up or down, and the motion discrimination needed to be performed in the context of added external noise. The external noise consisted of additional dots that were either surrounding, or surrounding and interspersed amongst, the central signal dots (after (18)). Thresholds for discriminating motion direction were determined as the speed of the dot motion in the central region decreased.
Relative motion perception and migraine: Noise and stochastic resonance
Relative motion thresholds have not previously been compared in migraine and control groups. They were included to examine the effects on performance of adding different types of external noise to a display and, specifically, to determine whether increasing the level and type of noise in the display would improve performance on the threshold task in either group. If a display presents a just sub-threshold signal, adding relevant, low-level external noise to that signal may raise it above threshold and thereby improve performance. This phenomenon is described as stochastic resonance. It increases the likelihood of detecting weak signals and there is growing evidence that it is involved in human sensory processing (19–21). For example, there is evidence that adding noise to a display can improve the processing of large-scale motion signals used in computing self-motion (20). Stochastic resonance is best seen for visual tasks where the threshold signal is particularly small compared to either internal or external noise; hence, relative motion is a better task than coherent motion detection or discrimination to show such effects.
Here, there were three levels of external noise presented together with the same coherently moving central display: (i) stationary surround only (no noise dots interspersed amongst the moving dots in the central display), to provide an anchor for the relative motion judgements; (ii) stationary surround with stationary noise dots interspersed amongst the moving dots in the central display; (iii) dynamic twinkling surround with dynamic twinkling interspersed noise dots. There are various ways to produce noise for motion-selective systems within the visual pathways (22), and the interspersed dynamic noise that was selected has been shown to be more potent in producing stochastic resonance effects near threshold than the interspersed static noise (21). It was, therefore, anticipated that (regardless of group differences) participants would have lower thresholds with the dynamic background noise than with the stationary background noise.
Models of cortical function in migraine that involve a heightened neuronal response would predict different stochastic resonance effects for migraine and control groups: largest effects would occur in the group whose neural response to the external noise adds to and boosts, rather than masks, the threshold motion-direction signal present in the central part of the display. The size of stochastic resonance effects depends not just on the intensity of the external noise in the image, but also on the level of endogenous, or internal, neural noise (23). Clearly, models of cortical hyperexcitability that entail higher levels of endogenous neural noise in migraine, compared to those without migraine (4,6), also predict different stochastic resonance effects for relative motion thresholds.
Methods
Participants
Participant details in the form of group means (±SD, and ranges (in parentheses) for each measure

F: female; M: male; VA: migraine with aura; MO: migraine without aura; C: control group.
No participant had taken any acute medication within the 48 hours preceding the test and none was on any daily medication (e.g. migraine prophylaxis, antidepressants or beta blockers). None reported experiencing migraine 48 hours either side of the test session. Ethical approval was obtained from the Human Research Ethics Committee of Griffith University, and informed signed consent was obtained in accordance with the Declaration of Helsinki (1991).
Auxiliary screening measures
In addition to visual acuity, the following measures were also recorded for each participant to assess the functioning of visual pathways other than in the motion processing streams in extrastriate cortex: (i) contrast sensitivity using the Cambridge Low Contrast Gratings (CLCG, (28)); (ii) stereopsis using the Titmus test, to screen for anomalies of binocular function; (iii) pattern sensitivity/pattern glare using high-contrast striped patterns; (iv) a migraine trigger inventory, which included potential visual triggers; (v) a visual discomfort questionnaire (29); (vi) the revised adult dyslexia test (30).
Visual acuity, contrast sensitivity and stereopsis were assessed under the recommended illumination. Visual acuity was assessed at 3 m, contrast sensitivity to the CLCG was assessed at 6 m, stereopsis was assessed at 40 cm.
The CLCG measures contrast thresholds for gratings with a spatial frequency of 4 cycles per degree (cpd), close to the maximum of the normal human visual system. They include 10 plates that display a horizontally oriented square wave grating with Michelson contrasts that range from 13% to 0.14%. The plates are presented to participants in pairs, each presentation consisting of a grating and a blank plate that has the same mean reflectance as its grating pair. Participants must make a two-alternative forced choice when they indicate which of the two plates contains the grating. The test was completed in order of decreasing contrast. Each time an error was made, the sequence was restarted at three plates preceding the error. The plates where errors were made were recorded on three runs through the sequence.
The Titmus circles stereo test displays nine polarized stereograms each consisting of four sets of annuli. One set is constructed from two orthogonally polarised images consistent with a particular retinal disparity when the test is viewed through congruent polarised lenses so that each eye sees a different image. The test was oriented to present crossed retinal disparities, so that the inner circle of one of the four sets of concentric circles appeared to float above the rest. The nine stereograms are consistent with retinal disparity angles ranging from 800 to 40 arc sec.
Pattern sensitivity/pattern glare refers to the discomfort and illusions that can be experienced when viewing repetitive patterns such as stripes (2,29,31–34). Pattern sensitivity was ascertained by gauging participants’ responses to a series of high-contrast horizontal square-wave gratings presented within a square window (width 7.8°) on the CRT and viewed at 60 cm. The light and dark bars of the gratings had luminances of 36.5 and 2 cdm–2, respectively, giving a Michelson contrast of 0.9. The gratings were presented with spatial frequencies of 0.5, 3 and 12 cpd. Each stimulus was presented three times for 10 sec. After each presentation, participants were asked whether they experienced any illusions and, if so, whether they saw (i) motion, (ii) colour or (iii) shape. A general illusion index (GII) was calculated, reflecting overall pattern sensitivity (2,13). First, the frequency with which colour, motion and shape were seen was determined for each pattern (minimum zero of three presentations; maximum, three of three). These were then averaged across the patterns and finally summed to give the GII.
The questionnaire contained a migraine trigger inventory that included visual stimuli (flickering light, striped patterns, alternating light and shade, and other visual stimuli, e.g. lattices, glare, computer use or television). Participants were asked whether each item commonly, occasionally, or never triggered migraine. ‘Commonly’ was scored as 2, ‘occasionally’ as 1, and ‘never’ as 0.
The Conlon et al. (29) visual discomfort scale consists of 23 questions each with a 4-point rating scale to quantify the severity of symptoms, coded 0 to 3. Scores can therefore vary between 0 and 60. Conlon’s discomfort survey principally assesses discomfort during reading (e.g. ‘Do you ever get a headache from reading a newspaper or magazine with clear print?’ ‘Do the letters on a page of clear text ever go blurry when you are reading?’ ‘When reading, do the words on a page of clear text ever appear to fade into the background then reappear?’ ‘Do you ever have difficulty reading the words on a page because they begin to flicker or shimmer?’ ‘Does the white background behind the text ever appear to move, flicker, or shimmer making the letters hard to read?’). A dyslexia inventory was, therefore, also administered to assess discomfort from reading, and reading proficiency, separately.
Average scores (±SD), and range of scores (in parentheses) for the auxiliary measures

CLCG: Cambridge Low Contrast Gratings; M contrast: Michelson contrast; GII: general illusion index. VT: visual triggers (stimuli such as flicker, stripes, patterns of light and shade, lattices, glare, computer use or television) were coded as commonly (2), occasionally (1) or never (0) triggering migraine for each participant and an average score created for each participant.
denotes a significant group difference (MO, or VA, vs. control) at p < 0.05, **p < 0.005.
Motion displays
Global/coherent motion-direction detection and discrimination
Following McKendrick and Badcock (4) and Antal et al. (5), the coherent motion detection and discrimination stimuli were RDKs presented within a 10° by 10° circular area. McKendrick and Badcock (4) used RDK motion stimuli presented within 10° by 10° areas at one of 17 locations: 16 locations were tiled across the central ±20° of each visual field, with an additional test location centred at fixation. Antal et al. (5) also used RDK motion stimuli within a 10° by 10° area, but its midpoint was presented 10° to the left of fixation, to be consistent with an earlier study on the modulation of global motion perception following TMS stimulation over V5 in healthy participants (25). In a pilot study, the motion stimuli were located either 10° to the left or right of fixation, selected at random on each trial, but performance was at chance for each group (VA: 56% correct, MO: 54%, C: 54%). Here, therefore, the motion stimuli were presented within a circular region, diameter 10°, with the midpoint presented at central fixation, which was marked with a 20 arc min fixation point.
During the motion sequences, 5% of the dots were extinguished after each frame and new dots randomly repositioned within the central 10° circular region (i.e. the dots had a limited lifetime) to minimise the chance that participants could try to do the tasks by tracking the motion of individual dots. Dots were also deleted and repositioned if their trajectory would traverse the outer diameter of the central 10°, or cross into the central 1° (so as not to obscure the fixation point). Each dot was 2 pixels square.
Each dot had a luminance of either 3 cdm–2 (low contrast) or 9 cdm–2 (high contrast) and was presented on a dark background (2 cdm–2). All dots moved with a speed of 5 degs–1 at a viewing distance of 60 cm. The dots changed position with each new frame (10 ms), producing smooth rather than jerky motion (after (5), cf (4,6)). For the motion detection trials, the display was presented for either 50 or 70 ms in separate blocks of trials. For the motion discrimination trials, the display was presented for 300 ms.
Each of the coherent motion detection and discrimination tasks used a single-interval, two-alternative forced choice (2AFC) procedure, in which participants were instructed to press one of two labelled keys positioned one above the other (‘g’ or ‘v’) to indicate whether the dots were moving coherently in an upwards or downwards direction, respectively. Auditory feedback was given if a mistake was made. Each trial consisted of a fixation point displayed for 1000 ms followed by one of the coherent motion conditions (motion-direction detection or discrimination presented in separate blocks of trials, see below). The fixation point then remained on screen until a response was made.
For motion detection trials, all of the dots moved in the same direction (up or down, 100% coherence). Each condition (display density (30 or 500 dots), display duration (50 or 70 ms), display contrast (low or high)) was presented in a separate block of trials. The order of blocks for dot density was counterbalanced, and within each of these, the presentation of the remaining conditions was randomised. Sixty practice trials (15 for each condition) were then followed by 140 experimental trials (35 for each condition).
For motion discrimination trials, a percentage of the dots moved in a coherent direction (up or down) for 300 ms while the remainder moved in random directions. On consecutive trials, the percentage of dots moving coherently was either decreased or increased, depending on whether the preceding response had been correct or incorrect. A two-down, one-up staircase procedure was used to converge upon a threshold coherence corresponding to a 71% correct discrimination rate (35,36). The two-down, one-up staircase procedure, and the resulting 71% threshold discrimination rate, were chosen to achieve a reasonable estimate of threshold without needing an excessive number of trials. Two staircases were interleaved, both starting at 70% coherence. An initial step size of 10% was reduced to 1% after three staircase reversals. The practice blocks of trials terminated after a minimum of two reversals for each staircase in the four conditions. For the experimental trials, each block of trials was terminated after a minimum of eight reversals for each staircase in the four conditions. Condition order (display density (50 or 300 dots) and display contrast (low or high)) was randomised for each participant. The percentage of dots that needed to be moving coherently in either direction for a correct discrimination rate of 71% was calculated from the mean of the last four reversals on each staircase in each condition.
Relative motion-direction discrimination displays
Following Wood (18; personal communication), the relative motion stimuli were presented for 1000 ms within a central 4° circular area viewed at a distance of 3.2 m. The central region, where 1263 moving signal dots were displayed, subtended 2.9°. In the stationary surrounding noise condition, an annulus (inner diameter 2.9°, outer diameter 4°) contained 1151 randomly positioned noise dots. This condition provided a baseline measure for the slowest speed needed to be able to judge motion direction. In the other two noise conditions, 2414 randomly positioned noise dots appeared throughout the 4° display (1151 in the surrounding annulus, the remainder within the central 2.9°) and, therefore, noise dots were interspersed with signal dots in the central region. In the stationary background condition the noise dots were stationary, whereas in the dynamic background condition they ‘twinkled’ (appeared, disappeared, and reappeared at different locations) at a rate of 20 Hz. Perceptually, the centrally moving signal dots appeared to transparently glide over both types of interspersed noise.
Each dot comprised 1 pixel and had a luminance of 35 cdm–2, the background luminance was 2 cdm–2. Similar to the other motion tasks, the centrally moving dots had a limited lifetime and were deleted and repositioned if their trajectory would either traverse the outer diameter of the central 2.9° or cross over the fixation point.
The central region displayed signal dots that moved up or down with an initial speed of 0.05 degs–1. On consecutive trials, the speed of the moving dots was either decreased or increased, depending on whether the preceding response had been correct or incorrect. A two-down, one-up staircase procedure was again used, with two staircases interleaved. An initial step size of 20% was reduced to 10% after a minimum of three reversals for each staircase. The practice block of trials terminated after a minimum of two reversals for each staircase in the three conditions. The threshold speed that was needed for a 71% correct discrimination threshold was calculated from the mean of the last four reversals on each staircase in each condition.
Each trial consisted of a fixation point displayed for 1000 ms followed by one of the relative motion conditions (stationary surround, stationary background, dynamic twinkling background), displayed for 1000 ms. The fixation point then remained on screen until a response was made. The order of presentation of each block of trials was randomised.
Apparatus
The motion stimuli were created using experimental scripts developed in Matlab 7.7 (The MathWorks, Natick, MA) in conjunction with routines from the Psychophysics Toolbox (26,27). The stimuli were presented on a 21-inch CRT monitor (Hitachi) connected to an Apple Macintosh computer running MacOS X. The CRT monitor had a spatial and temporal resolution of 1280 × 960 pixels, and 100 Hz, respectively. The CRT monitor was the only source of light in an otherwise dark room.
Procedure
The visual discomfort questionnaire and dyslexia inventory were completed as part of a class exercise, or sent to potential participants to be completed before the experimental session. The headache questionnaire and the tests of acuity, contrast sensitivity and stereopsis were assessed at the beginning of the experimental session. The coherent and relative motion tasks were then presented in counterbalanced order. Pattern sensitivity was assessed at the end.
Results
Auxiliary measures
The statistical analyses were performed using PASW statistics version 17.0 (SPSS Inc., Chicago, IL, USA). Most of the auxiliary measures were normally distributed for each group (Komolgorov–Smirnov tests, p > 0.05), so group differences were assessed with a priori t-tests (Table 2). Stereopsis was not normally distributed, which reflected a ceiling effect (Komolgorov–Smirnov tests, p < 0.05). Group differences for this measure were, therefore, assessed with Mann–Whitney U-tests.
There were significant group differences for four of the auxiliary measures (Table 2). Both migraine groups had significantly higher CLCG contrast thresholds than the control group (VA vs. C: t(26) = 2.3, p = 0.03; MO vs. C: t(26) = 2.4, p = 0.02, one-tailed tests). They also had larger GII scores than the control group, but the difference was only significant for the group with visual aura (VA vs. C: t(26) = 3.4, p = 0.002; MO vs. C: t(26) = 1.3, NS, one-tailed tests). Both migraine groups reported significantly more visual triggers than the control group (VA vs. C: t(26) = 2.8, p = 0.009; MO vs. C: t(26) = 3.1, p = 0.005, one-tailed tests). Finally, both migraine groups had significantly higher discomfort scores on the visual discomfort scale (29) (VA vs. C: t(26) = 3.2, p = 0.003; MO vs. C: t(26) = 2.5, p = 0.02, two-tailed tests). The only significant difference between the two migraine groups occurred for the GII: the VA group experienced more illusions than those with MO (t(26) = 2.3, p = 0.03; two-tailed tests). None of the rest of the comparisons (stereopsis, total dyslexia score, partial dyslexia score) were significant (two-tailed tests).
Motion experiments
The data from the three motion experiments were all normally distributed (Kolmogorov–Smirnov tests, p > 0.1). Group differences were, therefore, assessed with mixed analyses of variance (ANOVA). For the global/coherent motion detection data, group was the between-subjects factor (VA, MO, C) and contrast (high or low), display duration (50 or 70 ms) and dot density (50 or 300) were within-subjects factors. For the coherent global/coherent motion discrimination data, group was again the between-subjects factor and contrast (high or low) and dot density (50 or 300) were within-subjects factors. For the relative motion discrimination data, group was the between-subjects factor and type of noise (stationary surround, stationary background or dynamic twinkling background) was the within-subjects factor.
Global/coherent motion-direction detection rates in random dot displays
Coherent motion-direction detection data: the average proportion of correct responses for each group (±SE) when only coherent motion was presented in each condition (display density: 50 or 300 dots; contrast: low or high; display duration: 50 or 70 ms)

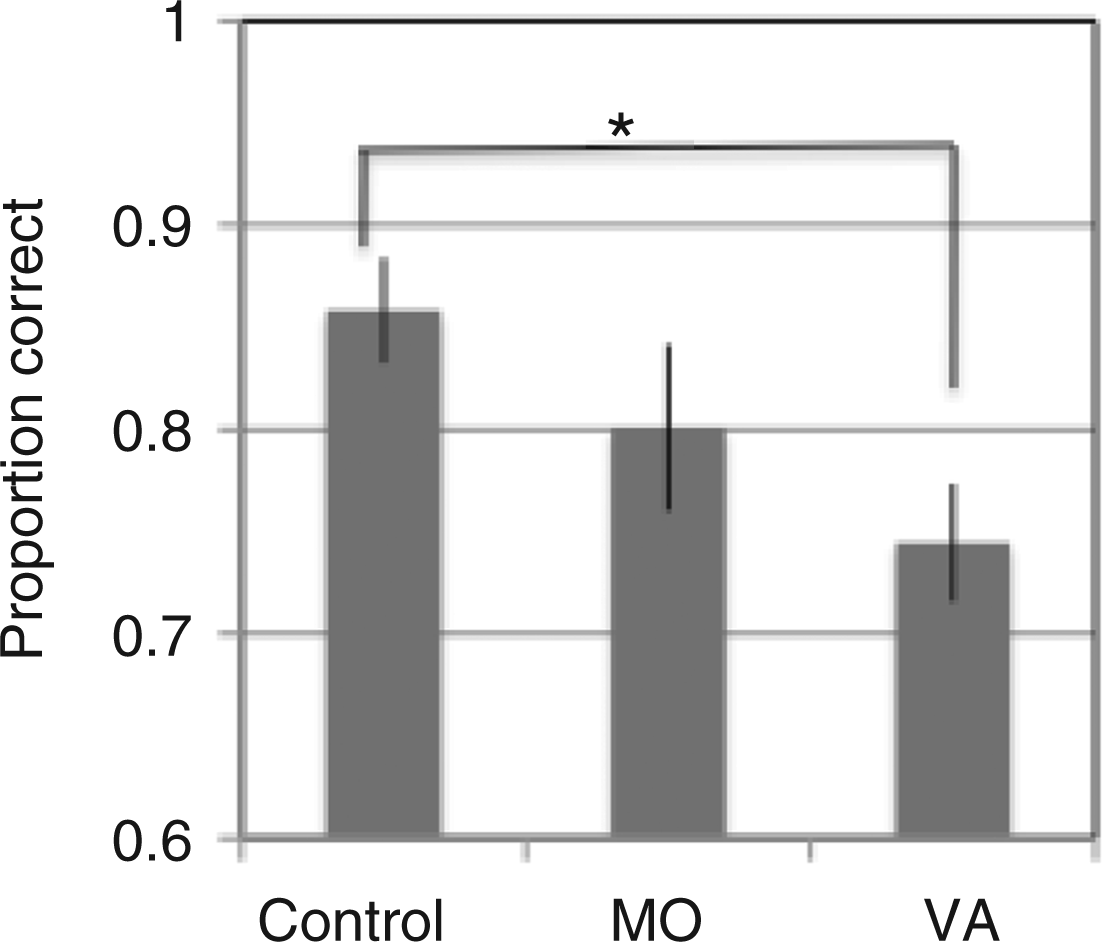
Motion-direction detection data with completely coherent motion: the main effect of group (see also Table 3). When the data from the different conditions are combined (high- and low- contrast displays, 50 and 70 ms presentation times, display densities of 50 and 300 dots), the control group obtained the highest proportion of correct responses, overall, and the VA group the lowest.
Global/coherent motion-direction discrimination in random dot displays
Coherent motion-direction discrimination data: the average proportion of dots that needed to be moving together coherently to achieve a 71% accuracy rate for each group (±SE) when displayed with randomly moving noise dots. The data are presented separately for each condition (contrast: low or high; display density: 50 or 300 dots)


Motion-direction discrimination data for partially coherent motion (see also Table 4). A. The significant interaction between group and display contrast. B. The significant interaction between group and display dot density. Thresholds were calculated as the proportion of dots that needed to be moving together coherently to achieve a 71% accuracy rate. See text for further details.
These interactions were linked to a significant main effect of group: overall, the control group needed fewer dots to be moving coherently together to be able to judge the direction of motion (F(2,39) = 9.4, p < 0.001; mean ± SE: VA: 57 ± 3%; MO: 52 ± 4%; C: 38 ± 2%]. Finally, there was a significant main effect of contrast: a higher proportion of dots needed to be moving coherently with the high-contrast displays than with the low-contrast displays (F(1,39) = 6.4, p = 0.015; low contrast: 47 ± 2%; high contrast: 51 ± 2%). There were no other significant main effects or interactions (all Fs < 1.7).
Relative motion-direction discrimination
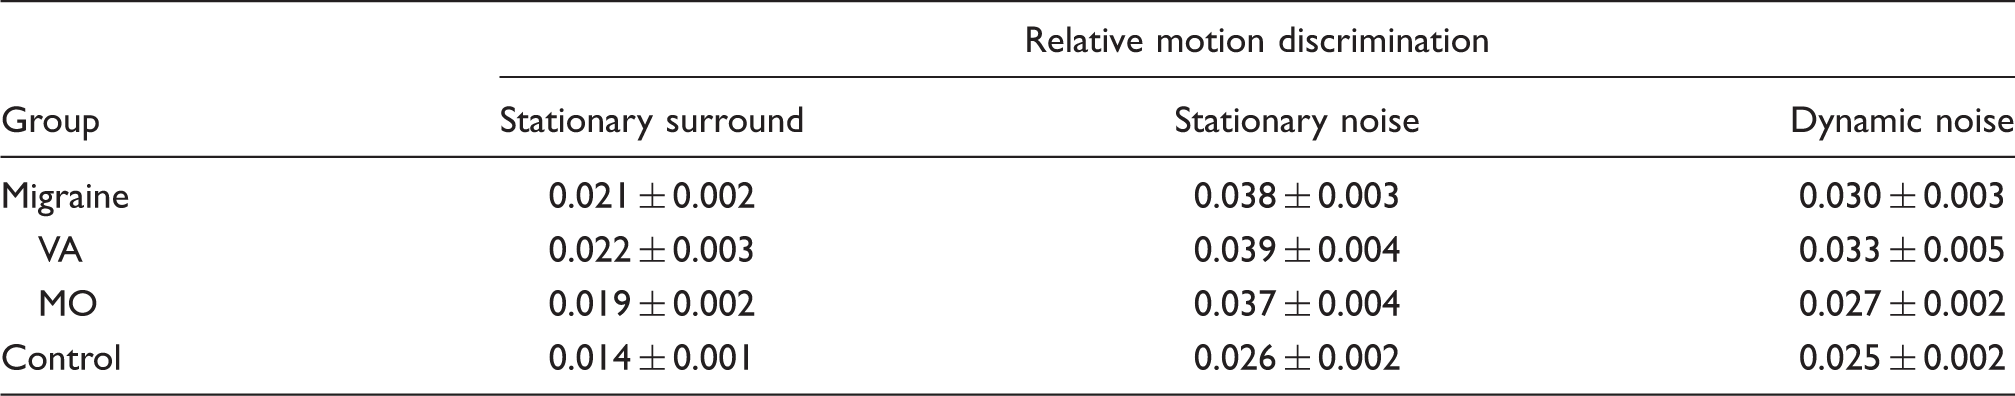
Relative motion-direction discrimination data: the average dot motion speed (deg s–1) needed to achieve a 71% accuracy rate for each group (±SE) in each noise condition
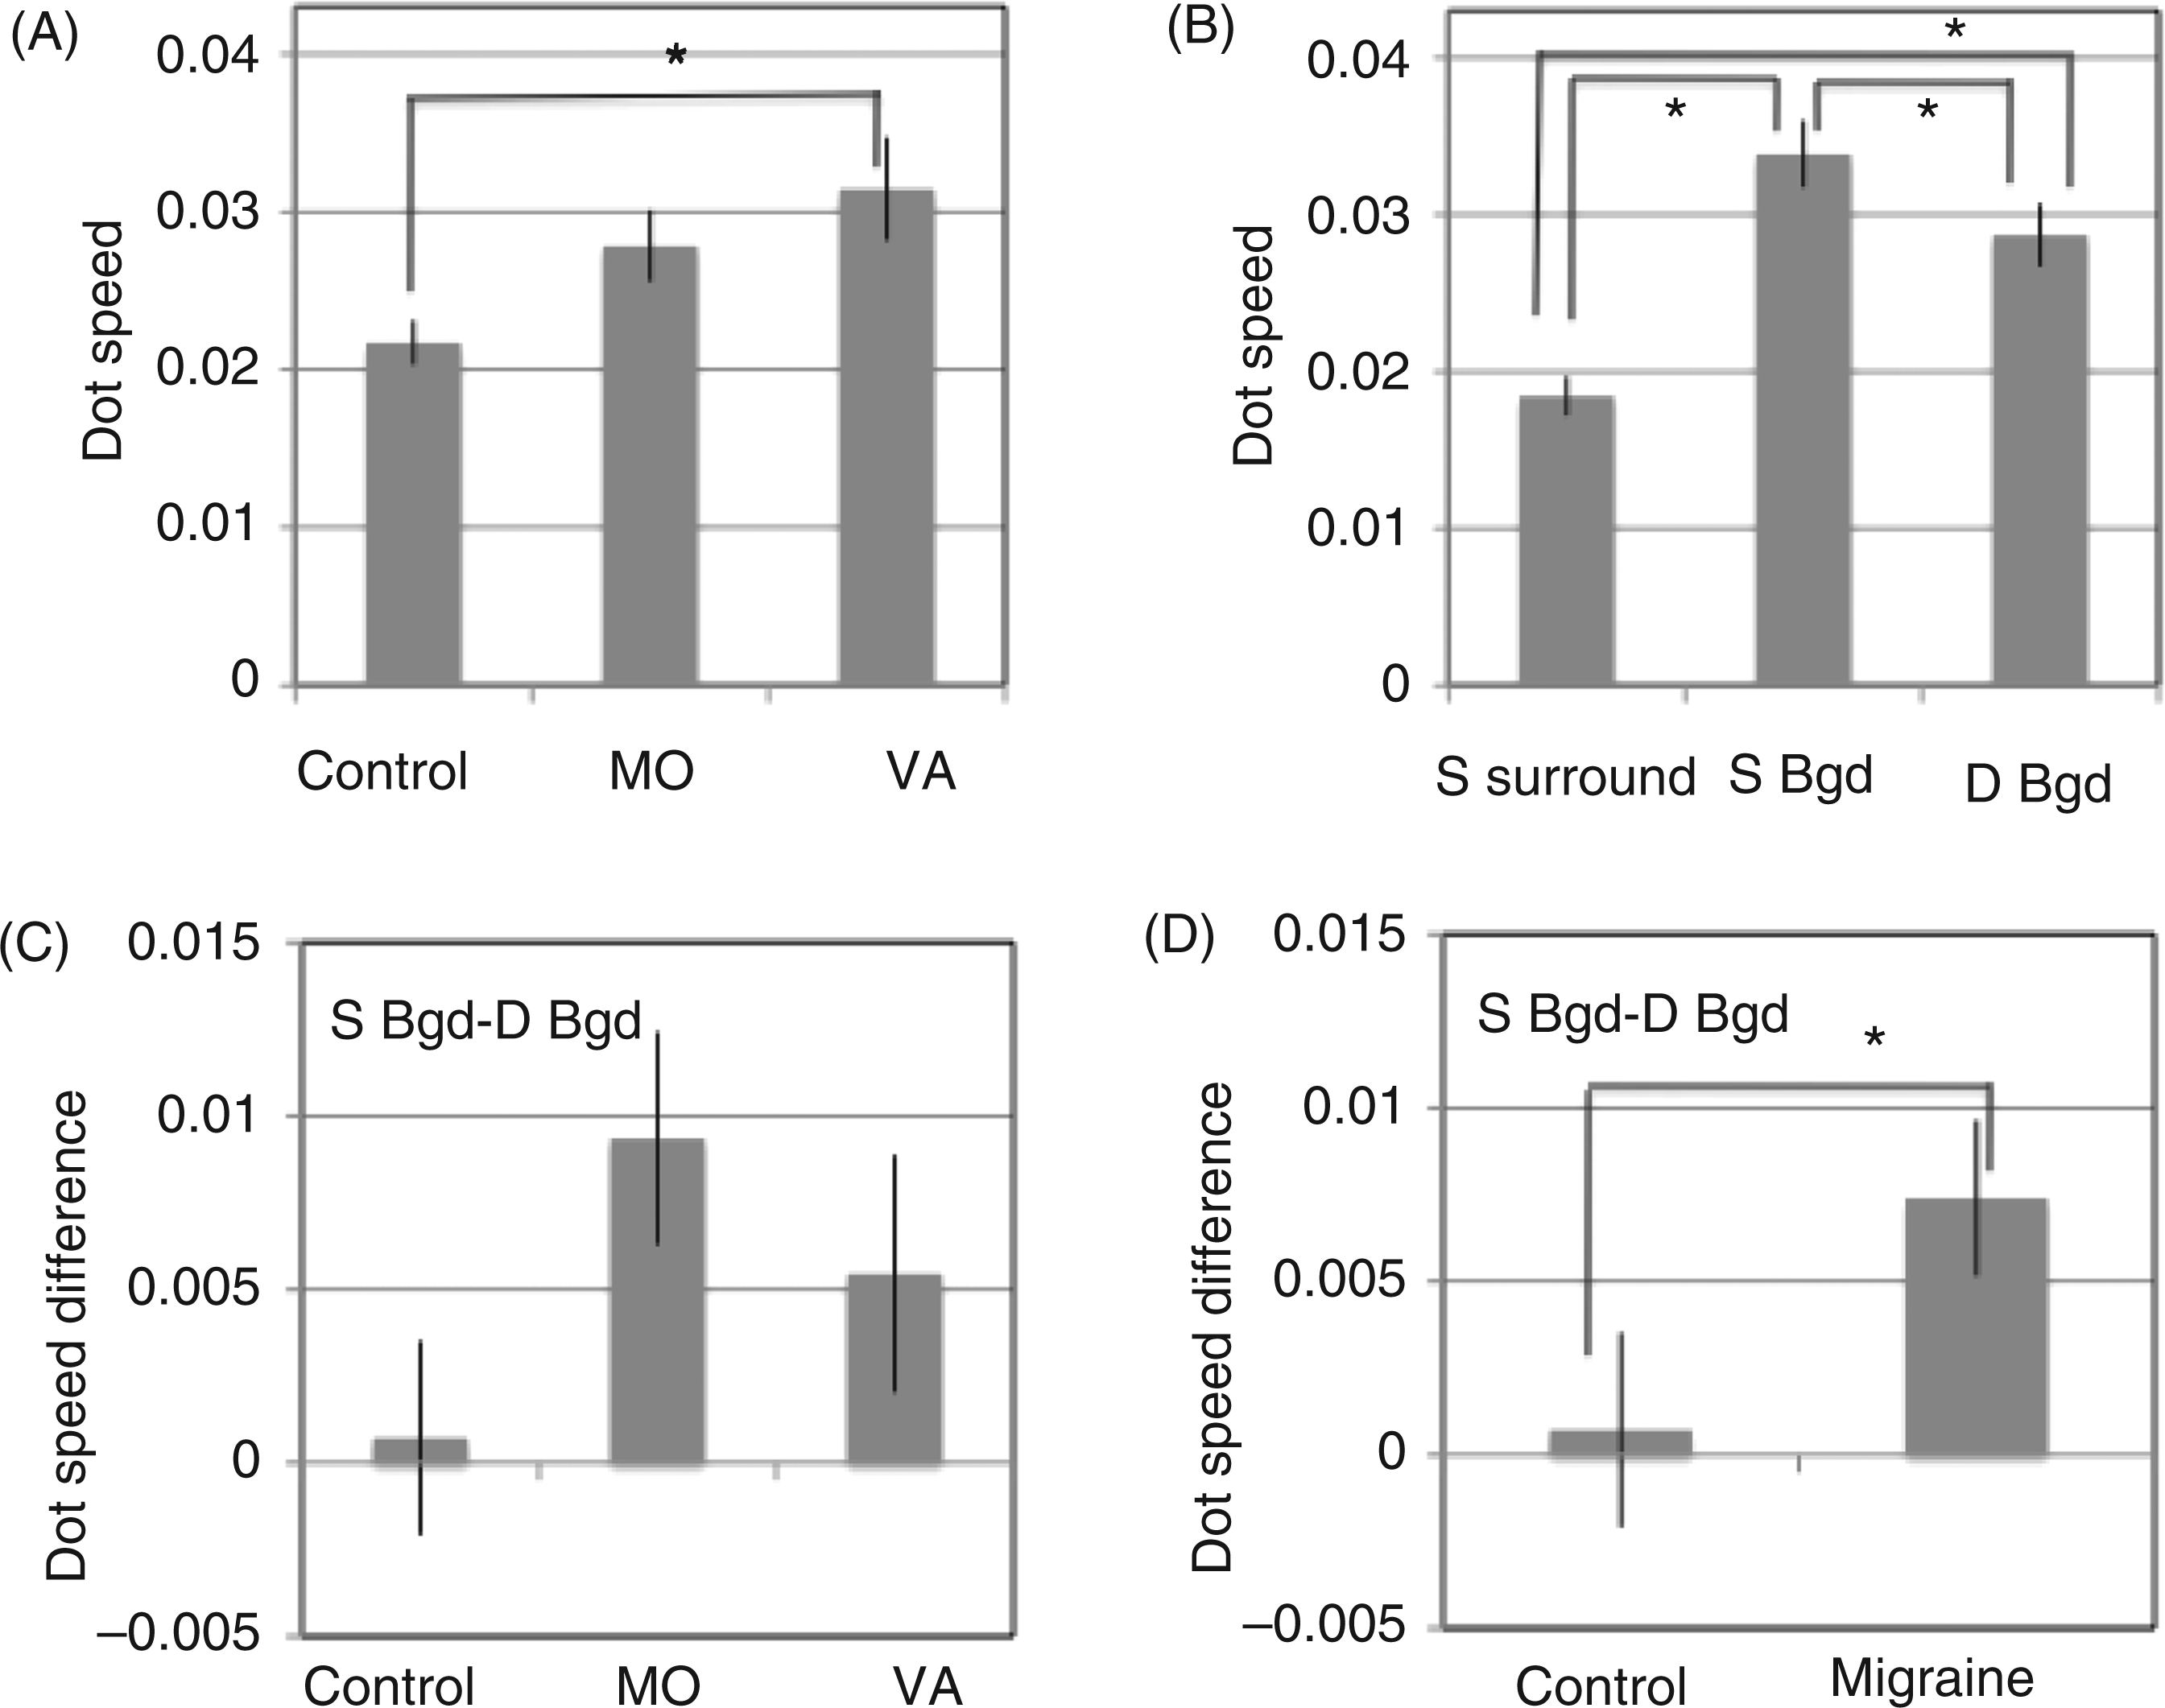
Relative motion-direction discrimination data (see also Table 5): the average dot motion speed (deg s−1) needed to achieve a 71% accuracy rate for each group (±one standard error). A. The main effect of group; VA = migraine with visual aura, MO = migraine without aura. B. The main effect of type of noise. S surround = stationary surrounding noise; S Bgd = stationary background noise; D Bgd = dynamic background noise. C, D. Stationary background – dynamic background difference scores revealed differences between these two conditions for the migraine groups when combined (D), which is consistent with stochastic resonance with these displays in migraine only. See text for further details.
There was also a significant main effect of type of noise (F(2,78) = 35, p < 0.001; mean ± SE: stationary surround: 0.018 ± 0.001 degs–1; stationary noise: 0.033 ±0.002 degs–1; dynamic noise: 0.028 ± 0.002 degs–1) (Figure 3B). The slowest thresholds occurred for the stationary surround condition (i.e. the most sensitive thresholds), the fastest occurred for the stationary background noise condition, and the dynamic background noise condition lay in between. Three pairwise comparisons revealed each noise condition differed significantly to the other two (Tukey HSD, p < 0.005). The improvement in threshold for the dynamic background noise condition, compared to the stationary background noise, is consistent with stochastic resonance occurring with dynamic noise, however the group by type of noise interaction was not significant (F < 1).
To explore the difference between performance with the stationary and dynamic noise backgrounds for each observer, the threshold for the dynamic background noise condition was subtracted from the threshold for the stationary background noise condition. These difference scores represent the relative increase in sensitivity to the direction of relative motion with the dynamic background noise, compared to the stationary background noise (Figure 3C). A one-way ANOVA on these difference scores, with group (VA, MO, C) as a between-subjects factor, was not significant (F(2,39) = 2.1, p = 0.14], however the trends were similar for both migraine subgroups and the sample size in each group, and hence power, was relatively small. When the migraine groups were combined and their performance compared to that of the control group, there was a significant effect of group (t(40) = 1.9, p = 0.03, one-tailed test, Figure 3D). Moreover, a paired t-test on the data from the control group and, separately, on the data from the combined migraine group, revealed thresholds decreased significantly with the dynamic background noise for the migraine group only (dynamic vs. stationary background noise; control: t(13) = 0.3, NS; migraine: t(27) = 3.3, p = 0.002, one-tailed tests, Bonferroni corrected for multiple comparisons).
Covariates and secondary analyses
As each motion task produced a significant main effect of group, and performances in each condition within each task were highly inter-correlated, an overall motion score was calculated for each task and each group to look for correlations with each of the auxiliary measures. The only measure that correlated with performance on all three motion tasks was contrast sensitivity assessed by the Cambridge Low Contrast Gratings (motion-direction detection: r = –0.34, p = 0.014; motion-direction discrimination: r = 0.41, p = 0.004; relative motion: r = 0.32, p = 0.02, Pearson’s r, one-tailed tests). As expected from previous work, these correlations show that poorer contrast sensitivity (i.e. needing a higher contrast to see the gratings) was associated with fewer correct responses on the detection task and poorer performance (higher thresholds) on the global and relative motion discrimination tasks. Therefore, CLCG contrast sensitivity was added as a covariate and each ANOVA analysis was repeated. Note that the CLCG contrast sensitivity correlated significantly with the overall relative motion discrimination task, not the dynamic/stationary background noise difference scores (r = 0.09, NS).
With CLCG contrast added as a covariate, the coherent motion detection analysis produced only one significant effect, the main effect of display duration (F(1,38) = 8.2, p = 0.007). There was no longer a significant main effect of group (F(2,38) = 2.1, p = 0.13) or any other significant effects.
The global motion discrimination analysis, with CLCG included as a covariate, resulted in only two significant effects, the main effect of group (F(2,38) = 7.1, p = 0.002) and the group × contrast interaction (F(2,38) = 3.9, p = 0.03]. The interaction between group and dot density was no longer significant, nor were there any other significant effects.
The relative motion discrimination and CLCG analysis produced only one significant effect, the main effect of type of noise (F(2,76) = 10.7, p < 0.001). The main effect of group was no longer significant, nor was the interaction between group and noise.
Several of the other auxiliary measures (Table 2) and migraine characteristics (Table 1) correlated with the relative motion thresholds: migraine frequency (r = 0.38, N = 28, p = 0.04), years suffered (r = 0.43, N = 28, p = 0.02), migraine triggered by striped patterns (rpb = 0.48, N = 28, p = 0.009) and visual discomfort as assessed by the Conlon et al. (29) scale (r = 0.37, N = 42, p = 0.02). The only auxiliary measure that correlated with the dynamic/stationary background noise difference scores for relative motion was whether flicker was cited as a visual trigger (rpb = –0.49, N = 28, p = 0.009).
There were no significant associations between performance on the coherent motion detection or global motion discrimination tasks and any of the migraine characteristics (Table 1) or auxiliary measures other than CLCG contrast (Table 2). Furthermore, there was a strong negative association between performance on the coherent motion detection and global motion discrimination tasks (r = –0.85, N = 42, p < 0.001). Those with the lowest motion-direction detection rates (poorest performance) needed the greatest number of dots to move together coherently in the discrimination task (again, the poorest performance). There was not, however, any significant correlations between the two motion-direction detection and discrimination tasks and performance on the relative motion task (detection: r = –0.27; discrimination: r = 0.29, N = 42, NS). This pattern of correlations suggests that the coherent and relative motion tasks tap distinct, rather than shared, neural processes.
Finally, several of the auxiliary measures were inter-correlated and were correlated with migraine characteristics. Some were expected, such as: the correlations between age and the number of years migraine had been experienced (r = 0.81, N = 28, p < 0.001); the frequency of migraine and the days elapsed since the last migraine attack (r = –0.34, N = 28, p = 0.03); and between different visual triggers (stripes, flicker, patterns of light and shade, other visual triggers such as computer overuse, smallest r = 0.31, p = 0.048, largest r = 0.48, p = 0.001, N = 28 for both). There was no significant association between the number of years migraine had been experienced and contrast sensitivity (r = 0.12, NS).
The GII correlated with the number of years migraine had been experienced (r = 0.44, N = 28, p = 0.02): those with the longest duration migraine saw the greatest number of illusions. The GII also correlated with reports of any visual migraine triggers (r = 0.29, N = 28, p = 0.03). The responses to the Conlon et al. (29) visual discomfort questionnaire also correlated significantly with reports of visual migraine triggers (r = 0.50, N = 28, p = 0.001) and with the total and partial revised dyslexia questionnaire scores (30): those with the greatest discomfort also had the highest scores on the dyslexia questionnaire (total dyslexia score: r = 0.46, p = 0.002; partial dyslexia score: r = 0.42, p = 0.006, N = 28 for both).
Discussion
To summarise, the highest motion-direction detection rates, and the lowest global and relative motion discrimination thresholds, were set by the control group. Conversely, the migraine group with visual aura set the lowest motion-direction detection rates, and the highest global and relative motion discrimination thresholds. For each task and condition, the performance of the migraine without aura group was either the same as the group with visual aura, or their performance lay in between those of the visual aura and control groups. This is consistent with previous research (e.g. 2,7,37,38) and suggests that the migraine subgroups, with and without aura, are not two distinct entities but rather share a common underlying pathophysiology that varies in degree. The other main result was that a measure of contrast sensitivity (CLCG contrast) correlated significantly with performance on all three motion tasks, and mediated performance on these tasks, but it was not related to the relative motion difference scores. So, a loss of contrast sensitivity can contribute to an apparent deficit in motion perception but there is, in addition, evidence for extrastriate involvement and indications that a study exploring ‘relevant noise’ (e.g. stochastic resonance) at different levels of visual processing would be informative to understand neural function in migraine. Several studies have now indicated that there are multiple stages of neural dysfunction in migraine (1–8,12,13,39–41), which leads to the suggestion that it may be useful to study sensory modalities other than vision, as well as cross-modal interactions, and this would tie the research to patient reports of their aura where the symptoms are not restricted to vision. Furthermore, a standard set of screening tests (at a minimum visual acuity, contrast sensitivity, and an assessment of visual discomfort and migraine triggers) should be included before conclusions about cortical function or dysfunction are drawn.
Group differences on each measure
1. Auxiliary measures
There were significant group differences for four of the auxiliary measures (Table 2), three of which are consistent with previous reports (2,13,31–34). Both migraine groups had poorer contrast sensitivity and more visual headache triggers. Both migraine groups saw a larger number of illusions in striped patterns, but this was only significant for the group with VA when compared to either the MO or control groups.
A new result was the elevated scores, for both migraine groups, on the visual discomfort scale developed by Conlon et al. (29), which asks about visual discomfort and distortions experienced while reading text. There were, however, no group differences on the dyslexia questionnaire scores (30). Thus, there were group differences on the Conlon et al. visual discomfort scale when reading text, and printed text can be seen as a black on white striped pattern, but no group differences on the dyslexia questionnaire scores, which asks about reading and comprehension.
Taking these results altogether, several disparate measures of visual discomfort (GII from striped patterns, endorsement of visual triggers including stripes and flicker, visual discomfort and distortions experienced while reading) all indicate elevated discomfort levels in migraine, which are related to particular characteristics of the visual patterns: stripes, repetitive geometric shapes and flicker. There were also significant positive correlations between these separate discomfort measures. Contrast sensitivity, however, was not significantly associated with any of these discomfort measures, and performance on this test alone was associated with performance on each motion task.
2. Coherent motion-direction detection rates in random dot displays
There was a significant group difference for the coherent motion-direction detection task in RDK displays in the first ANOVA analysis: the control group had the highest proportion of correct scores, and the VA group had the lowest. In the second ANOVA analysis, however, with contrast sensitivity added as a covariate, this group difference disappeared. There was also an expected significant effect of display duration in both analyses (50 vs. 70 ms), with each group performing better with the longer displays. Manipulating display contrast (high or low), or dot density (50 or 300 dots), surprisingly, did not significantly affect performance differences between the groups or across the conditions in either analysis (Table 3). Dot density perhaps made no difference between groups or conditions as the task was relatively simple. The non-significant result for display contrast is discussed below, together with the global motion-direction discrimination data.
Finding impaired motion-direction detection in migraine in the first analysis is congruent with impaired performance for motion-direction discrimination with (high-contrast) RDK displays lasting between 72 and 400 ms (4–6). It does not, however, replicate the original report on which this part of the study was based, which used 48 ms (high-contrast) motion-direction detection RDK displays and reported better performance in the migraine group (5).
In the present study, the high-contrast 50 ms displays were matched to those used by Antal et al. (5) and the only differences were the central location of the display and the use of limited lifetime dots. Antal et al. (5) presented their motion stimuli within a 10° by 10° area whose midpoint was 10° to the left of fixation. Peripheral presentation may have made the motion detection task easier, however, it would need to be easier selectively for the migraine groups as the detection rates for the control groups in the two studies are remarkably similar (here: 76% correct, Antal et al.: 81%). Moreover, McKendrick et al. (3,4) compared performance on a coherent motion discrimination task when it was presented centrally and at various eccentricities and found no consistent group differences.
What explanation can be offered for the differences in results between the current study and Antal et al. (5)? If there is impaired temporal resolution in migraine, then it is possible that the use of limited lifetime dots accounts for the poorer performance of the migraine groups in the present study (here, VA: 60%, MO: 68%; Antal et al., VA: 93%, MO: 89%). But this is at odds with performance on the high-contrast 70 ms global motion-direction discrimination task, which was similar in the two studies (here, 300 dots, limited lifetime, high-contrast VA: 58%, MO: 61%, C: 41%; Antal et al., 300 dots, without limited lifetime, VA: 64%, MO: 57%, C: 36%). Thus, methodological differences in the motion-direction detection experiment do not explain the variance in results. The key to an explanation of the latter may lie in our finding that when contrast sensitivity is added as a covariate, the group difference for the detection task is no longer statistically significant. So, sampling differences in contrast sensitivity between the participants in the two studies may have occurred and this would warrant further investigation. For example, participants could be recruited where contrast sensitivity is equated between the migraine and control groups.
Impaired motion-direction detection associated with impaired contrast sensitivity is consistent with earlier reports that precortical spatial and temporal mechanisms have impaired resolution in migraine (1,33,39,40,42). Impaired contrast sensitivity from precortical dysfunction could, therefore, account for the migraine groups’ poorer performance on the motion-direction detection task, rather than a deficit in motion processing per se, as it is the simplest of the motion tasks and the one most vulnerable to anomalies in early visual pathways. Thus, reduced activity in thalamo-cortical connections, from an impaired precortical organisation, could result in impaired motion-direction detection. The cause of any impaired resolution in precortical pathways cannot be derived at this stage – it could reflect elevated noise in these pathways masking the detection of the motion signals, or it could reflect a reduction in the likelihood of neurons in these pathways to fire, consistent with hypoexcitability, or a decrease in neural activation or arousal (42).
3. Global/coherent motion-direction discrimination in random dot displays
There was a significant group difference for the coherent motion-direction discrimination task in RDK displays in the first ANOVA analysis: the control group needed the fewest number of coherently moving dots to judge their motion direction reliably, and the VA group needed the greatest. There was also a significant group by contrast interaction and a significant group by dot density interaction (Table 4). When contrast sensitivity was added as a covariate, however, the significant group by dot density interaction was no longer significant, whilst the significant group difference and group by display contrast interaction remained. Thus, dot density does not appear to be a particularly relevant factor to manipulate in a global motion detection or discrimination task, compared to the effects of contrast and contrast sensitivity.
In both analyses, the low-contrast displays, which provided weaker stimulation, discriminated among the three groups: the control group had the lowest required coherence and the VA group the highest. The high-contrast displays, which provided stronger stimulation, only discriminated between the control and the combined migraine groups: the control group again had the lowest required coherence, but the two migraine groups did not differ from each other.
For the global motion discrimination task, the significant group difference that remained once contrast sensitivity (CLCG) was factored out partly replicates the results reported by Antal et al. (5) and McKendrick et al. (4) and extends them to include lower contrasts. V5/MT, a mid-level extrastriate cortical area, is involved in global motion discrimination. This result suggests that, in addition to impaired contrast sensitivity (probably resulting from low-level, precortical anomalies), there are cortical variations that result in impaired global motion discrimination thresholds in migraine, perhaps at the level of MT/V5.
4. Global/coherent motion-direction detection and discrimination as a function of display contrast and models of cortical function in migraine
As described in the Introduction, Shepherd (7,11,12) suggested display contrast could be useful to tease apart predictions from different models of neural function in migraine, such as proposed by Antal et al. (5) or the McKendrick group (3,4,6). Neither the current motion-direction detection data nor the motion-direction discrimination data are consistent with a model of neural function that entails simply increased internal background neural noise (uncorrelated with any visual input), which lowers the signal-to-noise ratio (3,4,6). This model predicts motion-direction detection and discrimination should be impaired in migraine. Here, however, there were no significant effects of display contrast for the motion-direction detection task once contrast sensitivity was taken into account. This model also predicts that detection or discrimination thresholds with the low-contrast displays should be affected more compared to high-contrast displays. The opposite trend was found here, however: generally, slightly greater motion-direction discrimination thresholds occurred for the high-contrast displays (Table 4).
An alternative model of heightened sensitivity/elevated activity to a stimulus (both signal and noise dots), without an increase in the internal background noise (5), predicts that the migraine group may perform better at low contrasts on motion detection trials, compared to the control group, and group performance differences may decrease as contrast increases. A significant interaction supporting this prediction was not found although, as mentioned above, it would be worthwhile to test migraine and control groups on this task who have been equated for contrast sensitivity.
This model, however, is consistent with impaired discrimination thresholds (see 5,13) and especially the trend for higher thresholds for the high-contrast displays. A heightened response to all motion directions present in the display may enable the high-contrast, incoherently moving, noise dots to mask the coherently moving signal dots more effectively than the low-contrast, incoherently moving, noise dots can mask the low-contrast signal dots. This trend was principally seen for the MO group (Figure 2A), and would warrant further investigation with a study using a wider range of display contrasts. It is also possible that a heightened response to repetitive stimuli grows over time (42). This study was not designed to test this model, however: there were too few detection trials, and the use of a double staircase procedure in the discrimination experiment yielded too few identical stimulus presentations to show reliable trends for repetitive stimuli. This model could be tested using a fixed set of near-threshold stimuli and tracking performance over repeated presentations.
Our impaired global motion discrimination results do not accord with other reports of enhanced global motion perception in migraine as assessed by the duration of the dynamic motion after-effect following adaptation to motion (MAE, 7). Certainly, perception following visual adaptation differs to normal perception and, in the MAE test display used in (7) where every pixel twinkled, the number of dots seen to be moving together coherently was unknown as it depended on the effects of adaptation on motion-selective cells in each individual’s visual system. That is, it was not a stimulus variable, but rather a perceptual one dependent upon the adaptive state of motion-selective cells. Conversely, with global motion discrimination tasks, it is the stimulus variable of the number of coherently moving dots that is used to determine the threshold. Future research could explore the differences between performance on global motion discrimination tasks, and perception of the global MAE, by manipulating dot density with each task.
When comparing the two tasks, it is noteworthy that impoverished contrast sensitivity in migraine could result in the percepts of the test stimuli in both the present study, and the prior motion after-effect studies, appearing lower contrast than for the control group. This is relevant as the perception of the MAE is maximised with low-contrast test patterns (43–45). Impaired contrast sensitivity resulting from low-level, precortical anomalies could enhance, rather than impair, the discrimination of global motion that relies on later cortical processes when those later processes are maximally sensitive to low contrasts. Future research could explore this issue by looking at contrast, contrast sensitivity, and local and global motion perception with both the MAE and discrimination thresholds.
5. Relative motion-direction discrimination in random dot displays
There were three noise conditions in the relative motion study: a stationary surround, a stationary background, and a dynamic or twinkling background. The highest relative motion thresholds occurred for the stationary noise background (noise added throughout the display), the lowest for the stationary noise surround, and the thresholds with the dynamically twinkling background noise lay in between. Once again, when contrast sensitivity was added as a covariate, the group differences disappeared, leaving just a significant main effect of type of noise. There was, however, evidence of improved thresholds for the migraine groups with the dynamically twinkling background, compared to the stationary noise background, which is consistent with stochastic resonance. The difference scores for the migraine groups combined (Figures 3C and 3D) were significantly larger than those for the control group, and they were not correlated significantly with contrast sensitivity. General elevated internal neural noise models cannot accommodate this relative improvement.
The association between the relative motion difference scores and whether flicker was cited as a visual trigger (coded as yes, no) should be replicated. The negative association was relatively strong (rpb = –0.49) and indicates that those whose migraines can be triggered by flicker had the smallest difference between the stationary and dynamic noise conditions and, by implication, the smallest effects of stochastic resonance. This cannot be attributed to the presence (N = 9 endorsed flicker as a trigger) or absence (N = 8) of visual aura. This result provides further support for the relevance of classifying migraine participants according to the presence or absence of visual triggers, rather than the presence or absence of aura (7,11,33,34), but it requires substantiation with a larger number of participants.
MST/MT+ is a moderately high-level extrastriate cortical area that has cells dedicated to processing relative motion (16,17). The evidence for stochastic resonance effects in migraine with the relative motion thresholds suggests that, in addition to impaired contrast sensitivity (probably resulting from low-level, precortical anomalies), there are cortical functional variations in migraine, compared to control participants, perhaps at the level of MST/MT+. The dynamically twinkling external noise appears to have added to, or boosted, the threshold-relative motion signal that was presented in the central part of the display for the migraine groups only.
The addition of external noise and the question of what is noise for the visual system are relatively new areas of research. The display conditions chosen were based on research on visual function in elderly drivers (18) and used their stimulus parameters. The present study was a preliminary one to look for any evidence for differences in stochastic resonance in migraine and control groups. Because such differences have occurred, this paradigm appears promising to refine models of neural function in migraine and would warrant a more systematic comparison of the effects of adding various types of added external noise in varying amounts after the methods of Simonotto et al. (21). Typically, however, the size of stochastic resonance effects are also reported to depend on the level of endogenous, or internal, neural noise (23). Future research could also explore whether external noise adds to neural responses and/or internal neural noise in similar ways at different levels of the visual system in migraine and control groups.
Migraine characteristics (migraine frequency, years suffered) and performance on two of the auxiliary measures (striped visual triggers, visual discomfort from reading) correlated to a limited extent with performance on the relative motion task only. This was surprising as, in earlier work, both the GII, visual discomfort, the presence or absence of visual triggers, the time elapsed since the last attack and migraine duration (years suffered) have correlated with performance on various psychophysical tasks, including motion tasks (2,7,11,13,32–34,41).
It is worth noting that the participants in this study were mostly undergraduate students and therefore relatively young (Table 1). Previously, when a loss of contrast sensitivity has been associated with migraine duration (years suffered), the recruitment of participants included a sufficient number who had experienced migraine for more than 30 years so they could be compared to those who had experienced it for less than 10 years (41). Our sample did not include such a wide range of migraine durations to be able to explore this issue adequately. Furthermore, each group reported more visual triggers than is usually encountered with older participants; indeed, all but six reported at least one visual trigger (these six constituted four control participants, one MO and one VA). Computer use or overuse was cited as a trigger in seven control participants, nine migraine participants without aura, and six migraine participants with visual aura. It is more usual to have stripes, flickering light, glare, high contrasts and abrupt transitions from dark to light cited as visual triggers. A more detailed assessment of lifestyle factors is warranted in further research into visual triggers of headache and migraine. Here, it is probable that the relative motion is a more sensitive task, compared to the motion-direction detection and discrimination tasks, which enabled it to reveal subtle associations between migraine characteristics and performance in this particular, young, migraine sample.
Footnotes
Acknowledgements
Thanks are due to Professor Steven Dakin at the Institute of Ophthalmology, UCL, London, who provided a Matlab script for the coherent motion detection and discrimination tasks, which was modified for these studies.
Funding
The Royal Society (UK) provided funding for Dr Shepherd to take up a visiting fellowship at Griffith University, Brisbane, Australia, while on sabbatical, which enabled these studies to be completed. Some of the research costs were funded by a Behavioural Basis of Health, Griffith Health Institute, internal grant to Dr Hine.