
Abstract
Objective: Differences between people with and without migraine on various measures of visual perception have been attributed to abnormal cortical processing due to the disease. The aim of the present study was to explore the dynamics of the basic interictal state with regard to the extrastriate, motion-responsive middle temporal area (MT-complex) with functional magnetic resonance imaging (fMRI) at 3 tesla using coherent/incoherent moving dot stimuli.
Method: Twenty-four migraine patients (12 with aura [MwA], 12 without aura [MwoA]) and 12 healthy subjects participated in the study. The individual cortical folding pattern was accounted for by using a cortical matching approach.
Results: In the inferior-posterior portion of the MT-complex, most likely representing MT, control subjects showed stronger bilateral activation compared to MwA and MwoA patients. Compared with healthy controls MwoA and MwA patients showed significantly stronger activation mainly at the left side in response to visual stimulation in the superior-anterior portion of the MT-complex, representing the medial-superior temporal area (MST).
Conclusion: Our findings strengthen the hypothesis that hyperresponsiveness of the visual cortex in migraine goes beyond early visual areas, even in the interictal period.
Introduction
Migraine is a common disorder in which a dysfunction of the brain has a pivotal role. Abnormal visual cortical excitability has been suggested to play an important role as a possible factor predisposing sufferers to the cortical spreading depression that is thought to represent the pathological basis of the aura during the migraine attack (1). However, whether this altered cortical excitability is due to cortical hyperexcitability, to decreased inhibition or to an abnormal responsivity of the cortex as a consequence of a decreased preactivation level remains heavily disputed. Indeed, in the last 20 years similar methodological approaches have many times led to contradictory results, and even similar results have led to opposing explanations.
Transcranial magnetic stimulation (TMS) is a widely accepted method to study the excitability of the visual cortex. By measuring TMS-induced phosphene thresholds (PTs), differences in visual cortical function between migraineurs and controls have been revealed. However, studies of TMS-induced phosphenes in migraineurs have produced conflicting results: some studies (2,3) demonstrated an increased excitability of the visual cortex in migraine with aura (MwA) patients while other studies suggested decreased excitability (4,5) or no differences between migraineurs and controls concerning PTs (6).
It has been suggested that in migraine patients, not only the primary visual cortex but also extrastriate areas, including the human motion sensitive area, called V5 or the motion-responsive middle temporal area (MT-complex), display altered excitability or sensitivity (7). Furthermore, 1-Hz repetitive TMS, which has an inhibitory effect in healthy subjects, sped up the reaction times on illusory contour perception in migraineurs (8), supporting the view of a failure of inhibitory circuits in extrastriate areas. Psychophysical studies have also reported abnormal motion processing, for example, prolonged motion after-effects (9) and decreased ability to detect coherent motion (10,11) in a “noisy” motion environment in migraine patients.
With regard to electrophysiological studies performed in the visual cortex, it was observed that cortical evoked potentials tend to habituate with increasing stimulus repetition in healthy subjects, but not in migraine sufferers (12). In the last years several papers reported a contradiction concerning the explanation of this phenomenon: lack of habituation can be due to a decreased preactivation level of the visual cortex (5), but can also be a result of hyperexcitability or impaired inhibitory processes in cortical circuitry (13). Nevertheless, even the correctness of the term “cortical hyperexcitability” is extensively discussed with regard to migraine (14). The cortex is hyperexcitable if it produces a response to a stimulus that is defined as “subthreshold” in a healthy subject or if its response to a suprathreshold stimulus is increased in amplitude. Concerning migraine, patients are more sensitive to any kind of sensory overload than to a single sensory stimulus, and therefore the definition hyperreactivity or hyperresponsivity is better suited for characterizing the response pattern of the (migraineous) brain to repeated stimulations.
In addition to the aforementioned approaches, functional magnetic resonance imaging (fMRI) allows for a characterization of brain activation changes at high spatial resolution. However, the number of studies using fMRI to investigate the interictal excitability of the visual areas in migraine patients is limited and controversial. Increased responsiveness of the visual cortex (15,16) and in contrast, less activation of the occipital areas (17) of migraineurs in the interictal period was observed. As specific fMRI data regarding the motion processing areas is lacking, the present experiment was designed to address the responsiveness of the extrastriate, motion-responsive MT-complex of the migraineur’s brain to moving visual patterns. According to previous results, related primate neurophysiology/anatomy and human imaging data (18), it is widely acknowledged that the relatively large motion-sensitive region that was originally labeled V5 (or MT, MT+) in humans is a complex of several areas. Some suggestions have been made regarding possible subdivisions; however, the anatomical location of the different areas is still a topic of debate among studies. For example, the definition of subdivisions can be based on the specificity of motion stimulus type (18,19) or on presence/absence of retinotopic organization and ipsilateral activation (20,21). According to the most frequently used classification, the superior-anterior part of the MT-complex is often called the medial-superior temporal area (MST) and the inferior-posterior portion is the middle-temporal area (MT).
In our study we have described this area as the MT-complex in line with the mean coordinates from several neuroimaging studies given by Wilms et al., (22) and hypothesized that a subdivision of this complex shows increased responsiveness in migraine patients compared to controls. Furthermore, we evaluated if differences exist between MwA and migraine without aura (MwoA) subjects.
Methods
Subjects
Main properties of the patient population
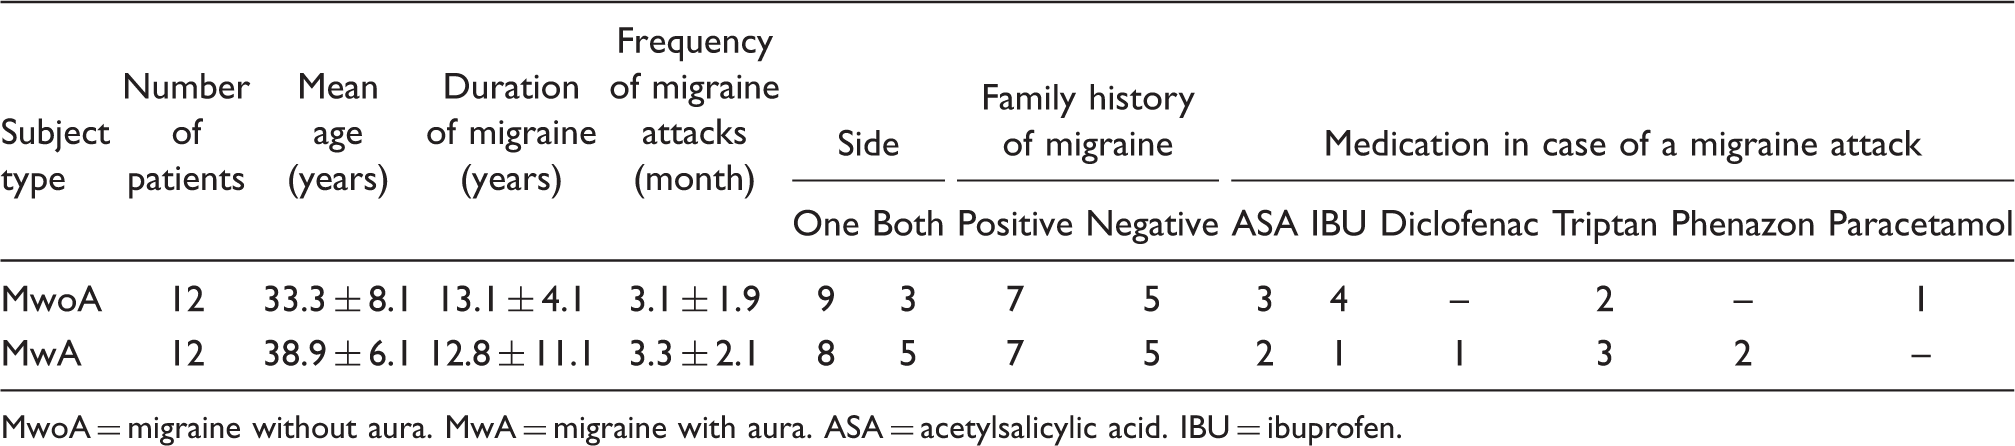
MwoA = migraine without aura. MwA = migraine with aura. ASA = acetylsalicylic acid. IBU = ibuprofen.
None of the patients was on any prophylactic medication. Migraineurs were studied between attacks, at least 72 hours after the last and before the next migraine attack.
Written informed consent was obtained from all subjects. The study conforms to the Code of Ethics of the World Medical Association (Declaration of Helsinki) and was approved by the Ethical Committee of the University of Göttingen.
Visual motion paradigms
To assess the characteristic responses to basic types of visual motion stimuli, subjects were shown five different kinds of white moving dot patterns on a black background. Two tasks consisted of simple linear vertical and horizontal moving dots, respectively. In addition, a more complex rotational dot pattern, rotating around the center of the screen, and a radial pattern, imitating in-depth motion, were used. These four coherent types of motion were complemented by an incoherent random moving dot pattern. All moving dot patterns reversed direction at a frequency of 0.7 Hz. The central 14° of the visual field was masked, leaving only a central stationary dot which the subjects had to fixate throughout the experiment. Further details such as size, number and speed of the moving dots have been given previously (23).
In all tasks the motion stimulation phases (12 sec) were interleaved with control phases (18 sec) consisting of a static version of the dot pattern. With an additional control condition at the beginning and 10 repetitions of stimulation and control phases this resulted in 5 minutes 18 seconds total measuring time. The order of the five visual motion experiments was pseudo-randomized between subjects. Stimuli were presented with the use of “Presentation” Software (Neurobehavioral Systems, Albany, NY, USA) and a set of MR-suited LCD glasses covering a visual field of 20° in the vertical and 30° in the horizontal direction (Resonance Technology, Northridge, CA, USA).
As the assessment of respective visual motion types did not result in significant activation differences in the MT-complex in a cohort of healthy control subjects (23), the five different visual motion experiments were pooled and the differences between the patient and control groups investigated.
Magnetic resonance imaging
MRI was performed at 3 tesla (Magnetom Trio, Siemens Healthcare, Erlangen, Germany) using the standard eight-channel phased-array head coil. Subjects were placed supine inside the magnet bore and wore headphones for noise protection. With regard to the safety of the subjects, vital functions such as heart rate and blood oxygen saturation were monitored throughout the experiment. Initially, an anatomical T1-weighted MR data set covering the whole head at 1 mm3 isotropic resolution was acquired (3D Turbo FLASH, repetition time [TR]: 1950 msec, inversion time: 1100 msec, echo time [TE]: 3.93 msec, flip angle: 12°). For blood oxygenation level–dependent (BOLD) functional imaging a T2*-sensitive gradient-echo echo planar-imaging (EPI) technique with an in-plane resolution of 2 x 2 mm2 was used (TR: 2000 msec, TE: 36 msec, flip angle: 70 degrees, acquisition matrix: 96 x 128). Sixteen consecutive sections of 4 mm thickness angulated in an axial-to-coronal orientation, roughly parallel to the calcarine fissure, covering the brain areas of interest, including the occipital lobe and especially MT and MST, were acquired. For each of the five different visual stimulation tasks a total of 159 volumes were recorded.
Data analysis
Group analysis and visualization were achieved using FSL (http://www.fmrib.ox.ac.uk/fsl/) and Freesurfer (http://surfer.nmr.mgh.harvard.edu). Preprocessing included 3D motion correction, slice scan time correction, linear trend removal and spatial smoothing with a Gaussian kernel (full width at half maximum 4 x 4 x 4 mm3). Subsequently, functional data sets were co-registered to the anatomical data set and transformed to the MNI 305 T1 brain. To improve the spatial correspondence between subjects, the multisubject statistics were carried out in a standard spherical surface space instead of the normal 3D space, thus possibly eliminating a large source of intersubject variability (variations in cortical folding across subjects). The MNI coordinates were transformed into Talairach coordinates.
Visual motion stimulation in the five different experimental runs was defined as predictor (MOTION). Per subject group, global activation maps of MOTION were generated. Furthermore, group differences in response to MOTION were assessed by contrasting MwA versus MwoA, MwA versus controls as well as MwoA versus controls. Resulting activation maps were overlaid onto the averaged cortex-based aligned hemispheres of all subjects applying a cluster size threshold of 25. The obtained p values were corrected for multiple comparisons using false discovery rate (FDR) correction with p < 1*10−15 for the main effects and p < .05 for the group differences.
To functionally define the area of the middle temporal cortex containing the MT-complex, we performed a random effects analysis across all 36 subjects using the predictor MOTION defined above. Applying an FDR-corrected threshold of p < 5*10−15 yielded a very circumscribed activation cluster in the middle temporal area (Figure 1). The center of this cluster was used as a seed point for generating patches of interest with the maximum area limit set to 1000 mm2 for the left and 1500 mm2 for the right hemisphere, motivated by the fact that the right MT-complex has been shown to be larger than the left one (22). The resulting Talairach coordinates of the seed point (left hemisphere: x = −45; y = −67; z = 4; right hemisphere: x = 43; y = 68; z = 3) are in very good agreement with the mean values from twelve functional imaging studies reported previously (left hemisphere: x = −44; y = −70; z = 1; right hemisphere: x = 43; y = −67; z = 3) (22). Table 2 lists the Talairach coordinates and statistical values of the most significant voxels of the superior-anterior (MST) and inferior-posterior (MT) portion of the MT-complex.
Lateral views onto the group-aligned reconstructions of the cortical surface of the left and right hemisphere. The resulting activations from a random effects analysis across all participants are overlaid in orange/yellow (p < 5*10−15; FDR-corrected). The different gray values denote the former folding pattern with dark gray representing former concave structures (i.e. sulci), and light gray representing former convex structures (i.e. gyri). Talairach coordinates and the maximum t-values of the MST and MT areas

Results
Group analysis revealed bilateral activation in the MT-complex in response to visual MOTION stimulation in the three subject groups. For each group, there was significant bilateral activation in the MT-complex, even though differences in the extent and the strength of activation were visible.
The assessment of differences between subject groups (Figure 2) revealed stronger activation mainly in the left hemisphere in the superior-anterior portion of the MT-complex, most likely representing MST, in MwoA and MwA patients compared to controls. In the inferior-posterior portion of the MT-complex, most likely representing MT, control subjects showed stronger bilateral activation compared to MwA and MwoA patients. Comparing MwA against MwoA patients revealed no difference in activation in the left and right hemisphere. Table 3 lists the Talairach coordinates and the t- and p values of the most significant voxels of the respective comparisons in the superior-anterior (MST) and inferior-posterior (MT) portion of the MT-complex.
Activation maps projected onto the group-aligned reconstructions of the cortical surface of the left and right hemisphere resulting from the contrast of (top) migraine patients with aura vs controls as well as (bottom) migraine patients without aura vs controls. The activation maps were thresholded at p < .05 (FDR-corrected). Orange to yellow coloring indicates stronger activation in the migraine patients and blue to green coloring indicates stronger activation in controls. The differential activations in the inferior-posterior and superior-anterior portions most likely reflect effects in the middle-temporal (MT) and medial-superior temporal (MST) areas. Talairach coordinates and the maximum t-values of the comparisons between MST and MT

Discussion
The present study demonstrates for the first time significant differences in the BOLD response of visual area MST in migraine patients compared to control subjects. Indeed, we have observed that MwA and MwoA patients exhibit increased responsiveness to moving visual stimuli in the superior-anterior part of the MT-complex that probably corresponds to MST, in the interictal period compared to control subjects. On the other hand, the inferior-posterior part of the MT-complex was less active in patients compared to controls. These results strengthen the notion that not only the primary visual cortex, but also higher-order visual areas are affected in the interictal phase of the disease.
Previously only a limited number of studies investigated visual processing using fMRI with regard to migraine patients. Vincent et al. (16) found increased responsiveness of the visual cortex of migraineurs with aura in the interictal period, using white bars as visual stimuli. Similarly, Huang et al. (15), using square-wave gratings at different spatial frequencies, observed an increase in BOLD response in MwA patients. In contrast, Bramanti et al. (17), using a chessboard stimulation, found less activation of the occipital areas in migraine patients when compared to controls. In this study a significant inverse correlation was observed between the frequency of the attacks and the size of the activated brain area. Even though both MwA and MwoA patients participated in this study, they were not analyzed separately.
Also, there is only limited previous research that has explicitly assessed the integrity of extrastriate cortex in migraine patients using other methods than fMRI. TMS studies focusing on the human MT region (7,8) between migraine episodes are consistent with the conclusion that extrastriate cortex is affected in migraine. Similar results have been provided by psychophysical research using tasks that indirectly evaluate the abnormal functioning of the motion-related areas and can reflect processing in particular cortical regions. For example, motion coherence thresholds have been reported to be impaired in migraine (10,11). These results have been explained by cortical hyperexcitability (7,11,16) and/or a failure of intra-cortical inhibition (8). However, Shepherd (9,24) has reported prolonged motion–aftereffects in migraine that suggest an extended suppression of intracortical excitation.
Our results are in agreement with former reports regarding the abnormal functioning of the motion-related areas in migraine patients. Moreover, our data suggest that MST is differentially affected by the disease than MT. The extrastriate cortex of the human brain encompasses a substantial portion of the cerebral cortex and is devoted to the higher-order processing of visual signals and their dispatch to other parts of the brain. Neuronal selectivities present in the various extrastriate areas support many diverse representations of the scene in front of the subject (25). It has been observed that MT is activated almost equally by all moving dot patterns, including random motion, suggesting that it has little sensitivity to global flow structure. This region shows strong signs of retinotopic organization and is only weakly activated by stimuli confined to the ipsilateral hemifield. In human MST, located immediately anterior to MT and strongly driven by ipsilateral stimuli, activation might vary with optic flow structure (18). Additionally, the list of the known neuronal selectivities includes the coding for pattern direction and speed gradients in MT and for heading in MST. Indeed, the dorsal subdivision of MST is a strong candidate to mediate the integration of visual and vestibular signals for heading perception (26). Why do migraine patients when compared to controls show significantly more activation following visual stimulation in MST? A first possible explanation is the structural abnormality of the MT-complex described recently in migraine (27), where an increased cortical thickness of motion processing related areas was found. A thicker cortex might respond with stronger functional activation to visual stimulation. Additionally, it was observed that one area of thickening corresponded to the region previously identified as the source of cortical spreading depression (V3A) during migraine aura (28). Similarly to our functional results, no difference was found in cortical thickness between MwoA and MwA subjects (29).
A second possible explanation is the abnormal visual adaptation or habituation observed in migraine, independently from the presence or absence of aura. Habituation is regarded as a fundamental, possibly protective mechanism of cortical processing. It has been shown to be present in visual, auditory, somatosensory and nociceptive domains. Cortical evoked potentials tend to decrease with increasing stimulus repetition in healthy subjects. In migraineurs, evoked potential experiments have revealed lack of habituation in all of the studied domains (29–31). The most common explanation in this context is hyperexcitability or impaired inhibitory processes in cortical circuitry. However, lack of habituation has also been interpreted as the result of a low baseline excitability in which stimulus repetition does not cause decreased response amplitudes due to a floor effect (12), or as recently suggested, cortical hyperresponsiveness to external stimuli (14). Because there is a relationship between the amplitude of the BOLD response and the metabolic demand of the neurons, in our study we suppose that the heightened functional response in migraine patients to repeated visual stimuli reflects the exaggerated metabolic demand, and demonstrates more a hyperresponsiveness in migraine than a hyperexcitability. However, in our study it could not be clarified whether this dysfunction is due to a deficiency in cortical inhibition or a low preactivation level (or both).
A third possible explanation concerning the stronger functional response in MST is the ocular motor disturbance observed in migraine subjects (32). Our subjects were instructed to fixate on the middle of the screen; however, small pursuit eye movements might have occurred during the visual stimulation. Visual-tracking neurons can be found in MST (33). Therefore, faster eye movements might produce stronger MST activation in migraine. However, a recent study suggested that the activity of MST neurons is mostly correlated with the motion of the image on the screen independent of pursuit eye movements, whereas the responses of MT neurons are mostly correlated with the motion of the image on the retina (34). Therefore, MST neurons are more likely than MT neurons to distinguish between external and self-induced motion. According to this idea, MST codes visual motion in the external world though compensating for the counter-rotation of retinal images due to pursuit eye movements.
It should also be mentioned that when compared to MST, the MT area was less active in patients compared to controls. Although both MT and MST are important stations in the cortical motion processing system, they have partially different feed-back and feed-forward cortical/subcortical connections that might be differentially affected in migraine: MST has dominant widespread connections with visual and polysensory areas in posterior prestriate, parietal, temporal and frontal cortex (35). MT mainly has prevailing reciprocal connections with the visual areas V1–V4 and higher order visual areas such as the ventral intraparietal, superior temporal, parieto-occipital, and MST areas (36). In our study the weaker activation in migraine patients might be due to a feed-back inhibition from the overactive MST.
We have found no significant difference in the BOLD response of MST and MT between migraine subgroups classified according to the presence or absence of visual aura, similarly to other studies addressing the degree of habituation, motion aftereffect and the thickness of cortical areas using MRI (12,27,29). However, future works are warranted in order to study cortical excitability, not only in the visual cortex and in larger patient groups, but also separating MwA patients from MwoA patients. Many of the previous studies mixed these two patients groups or investigated only one of them. Nevertheless, it is possible that these groups of migraine patients differ in neuronal functionality.
In conclusion, we have observed a stronger response to visual motion stimuli in MST of migraine patients compared to control subjects. This finding strengthens the hypothesis that hyperresponsiveness of the visual cortex in migraine goes beyond early visual areas, even in the interictal period. Furthermore, it may provide clinicians with a non-invasively acquirable, objective biomarker for migraine. Although significant, these findings were derived from a small number of subjects and should be confirmed in a larger series of patients.
Footnotes
Funding
AA and WP were supported by the German Ministry of Research and Education within the Kompetenznetz Schmerz (FKZ: 01EM0519). CM was supported by the graduate school of the Deutsche Forschungsgemeinschaft through Grant No. GRK 632 (Neuroplasticity: From Molecules to Systems Graduate Program). JB and PD were supported by the VolkswagenStiftung.
Acknowledgements
We thank Leila Chaieb for the English-language corrections.