
Abstract
It is common for clinical trials designed to compare treatments for migraine to incorporate a component for estimating onset. Our objective is to describe a stopwatch method for collecting data on time to meaningful relief and a conceptual framework for describing and analysing the results. The survival distribution of onset is modelled in two parts: the probability that onset does not occur, and the survival distribution conditional on its occurrence. Using data from a clinical trial comparing an active treatment and placebo, we illustrate the method and find that the distributions of onset among those with onset do not differ, but the probabilities that onset occurs are substantially different. We illustrate how the model can be used to help determine how long patients without onset should wait before further intervention, how patients interpret the phrase meaningful relief, and how baseline clinical characteristics affect the onset.
Introduction
One of the most vexing aspects of studying agents for treating acute migraine is the lack of direct objective measures of their effect. Patients have to translate subjective perceptions of the intensity of their pain or relief into qualitative measurements, such as mild, moderate or severe pain, or a little or a lot of pain relief. In current practice, such categorical items are translated into somewhat arbitrary numeric values for statistical analysis. Means of these values, intended to estimate the average responses of study participants, are used to appraise the relative efficacy of the treatments in clinical trials, but the magnitude of these numbers, apart from their ranking, has no intrinsic clinical meaning and conveys little or no therapeutically useful information. Similarly, the International Headache Society's definition of headache response (1) as reduction in pain intensity from severe or moderate at baseline to mild or none provides only a binary indicator of whether a treatment has produced an effect in an individual. In a previously popular clinical trial design, a single observation taken at 2 h post-dosing provides the basis for deciding if a treatment is active. The criterion is the percentage of patients with headache response at 2 h among those receiving the treatment, which must statistically exceed the same percentage among those receiving placebo. Patients and clinicians can learn little about the properties of a treatment from these clinical trials, other than that it is more effective than placebo at 2 h.
In contrast, measures that characterize pain relief in terms of time events, such as onset of pain relief, duration of analgesia, and time to remedication are understood by everyone who has ever experienced pain. The clinical implications of these parameters are easily appreciated and knowledge of their probability distribution in the population enables a patient and a clinician to anticipate when pain relief will begin and when it might be appropriate to administer additional medication, either because the treatment has not worked or because its effect has begun to wear off.
Patients questioned in population-based studies ranked fast onset for relieving the pain of migraines of highest priority amongst a list of properties that they find desirable (2), a fact not lost on clinical researchers nor on the pharmaceutical industry. As a result, in the last few years most clinical trials in which migraine treatments are compared incorporate a component that attempts to estimate onset.
A clinical trial design with a single observation at 2 h cannot generate enough information to characterize the onset of a treatment. To estimate onset, a commonly used approach is to take frequent observations at specified points in time after baseline during which patients report the intensity of their pain, categorized on a four-point scale (none, mild, moderate or severe). Onset is defined as the time of the earliest observation at which the patient reports no or mild headache pain. Since the event may have occurred at some time between observations, some form of interpolation is often used to estimate onset for the patient. This approach is problematic because it depends critically on the specific times of observation and on the validity of the interpolation algorithm. The data from such clinical trials can be analysed using survival methods for interval censored data (3, 4), but these approaches are more crude than those based on an assessment of the actual time to the event.
A more satisfactory approach, the ‘stopwatch’ technique introduced by Laska, Siegel and Sunshine (5, 6) measures actual time to onset. A stopwatch is started at the time a treatment is administered and the patient is asked to stop it when meaningful pain relief is first experienced. This time is considered to be the point at which onset occurs. Typically, a period of time is specified within which onset is expected to occur. Patients who have not had onset within the period are considered to be non-responders to the treatment. The data or these time points are used to estimate the distribution of onset, the probability that onset occurs by time t, or its complement, the survival distribution of onset—the probability that onset occurs after t.
The availability of a widely used new paradigm for studying onset raises a series of questions as to how to characterize and interpret the resulting data. What information best summarizes the onset of a treatment? How can the data be used to help determine how long a patient should wait until further intervention is appropriate? What should the speed of onset of a treatment be relative to placebo? What models and statistical methods should be used and what should be done with the data of patients who withdraw from the study before they achieve onset? How do patients interpret the phrase ‘meaningful relief’? How do demographic or clinical characteristics affect onset?
To address these questions and to illustrate the methods we propose, we utilized an existing clinical trial that was designed to examine the onset of a subcutaneously administered test drug, T, compared to placebo, P, for the acute treatment of moderate to severe migraine.
Methods
Clinical trial design
In a multicentre phase III clinical trial, T was compared with P with respect to onset of meaningful relief, change in headache severity, and the relief of associated migraine symptoms in patients presenting to an Emergency Department of a Hospital.
The study was conducted in 12 centres in the USA. Patients who appeared for treatment of moderate or severe migraine met pre-established eligibility requirements and gave their written informed consent before study enrolment. Medical and migraine histories were documented, a diagnosis of migraine with or without aura as defined by the International Headache Society was made, and migraine symptoms were assessed. Patients were given a physical examination, and their sitting and supine blood pressure, heart rate, and respiratory rate were measured. Among women of childbearing potential only those who used an acceptable method of contraception and who tested negatively on a blood or urine pregnancy test were eligible to participate.
After randomization, a subcutaneous injection of one of the study treatments was administered to a patient on a double-blind basis. No other medication was allowed for 90 min post-dose. If patients did not obtain meaningful relief within 90 min, they were allowed to take rescue medication. To measure time to meaningful relief onset, each patient was given a stopwatch that was started at baseline when the treatment was administered. Patients were instructed in the methodology and were asked to stop the watch when they felt they had achieved meaningful relief of their headache pain. Patients rated headache severity and clinical disability at the following time points: prior to dosing at baseline, when meaningful relief occurred, or if it did not occur, prior to receiving rescue medication, and at discharge. Pain intensity was measured on a four-point scale ranging from no pain to severe pain.
Statistical methods
The probability that a patient had meaningful relief of headache pain, the distribution of onset for all participants in the trial, and the conditional distribution of onset for those who experienced meaningful relief were determined. These calculations were based on a cure model (5, 7, 8) for each treatment of the form H i(t) = Probability {onset occurs after time t} = P i + (1 – P i)S i(t), where i is either T or P. H i(t) is the (unconditional) survival distribution of onset, and it includes the possibility that onset is never achieved. The probability that onset does not occur is denoted by P i, and the probability that onset does occur is its complement, 1 –P i. S i(t) is the (conditional) survival distribution of onset given onset is achieved. That is, it is the probability that onset occurs after time t, among those that will experience onset.
In clinical trials of cancer treatments, S(t) usually represents the survival distribution of time to death, and P is called the cure rate. In other applications, P has represented the surviving or the immune fraction.
From the statistical model of the survival distribution H i(t), the probability of achieving onset at some later time given that at time t it has not yet occurred, Qi(t), is given by: Qi(t) = Probability {onset occurs after time t given onset has not occurred prior to t} = (1 − P i)S i(t)/(P i + (1 − P i)S i(t)). Since S i(t) is a decreasing function of time, this probability decreases as t increases, and eventually becomes zero.
Either non-parametric or parametric survival methods can be used to obtain estimates of P i and S i(t). Both methods incorporate the possibility that patients' observations are censored because they drop out or are lost to follow up, and hence use the data from all patients. While the non-parametric model requires less assumptions, the parametric model permits the use of covariates. For its didactic value, both non-parametric and parametric methods are used below.
In the non-parametric procedure, the Kaplan–Meier product limit estimator (9) was used to obtain estimates of the survival distributions for the total population, and the null hypothesis of equality of the onset distributions of T and P, i.e. H T(t) = H P(t), was tested using a Wilcoxon rank statistic. Both the estimated probabilities P i and the estimated survival distributions of those with onset, S i(t), are obtained from the Kaplan–Meier estimates. Also, Laska and Meisner's non-parametric test (10) of the null hypothesis that the probabilities, P i, of the two treatments are equal and Orazem's test (11) of the equality of the conditional survival distributions, S i(t), were carried out.
In the parametric analysis, P i was assumed to follow a logistic function, and S i(t) a Weibull distribution (8). In the parametric representation, covariates were included in the logistic portion of the model to study their effect on the probability of onset as well as in the Weibull portion of the model to study their effect on the survival distribution of onset. The covariates included in both portions of the model were the baseline measures of pain severity, presence of nausea, vomiting, photophobia and phonophobia. Because of the high correlation between overall clinical disability and pain severity, the former was excluded from the analysis.
All statistical tests were performed at the 5% level of significance.
Results
Background demographics and symptoms at baseline (Tables 1 and 2)
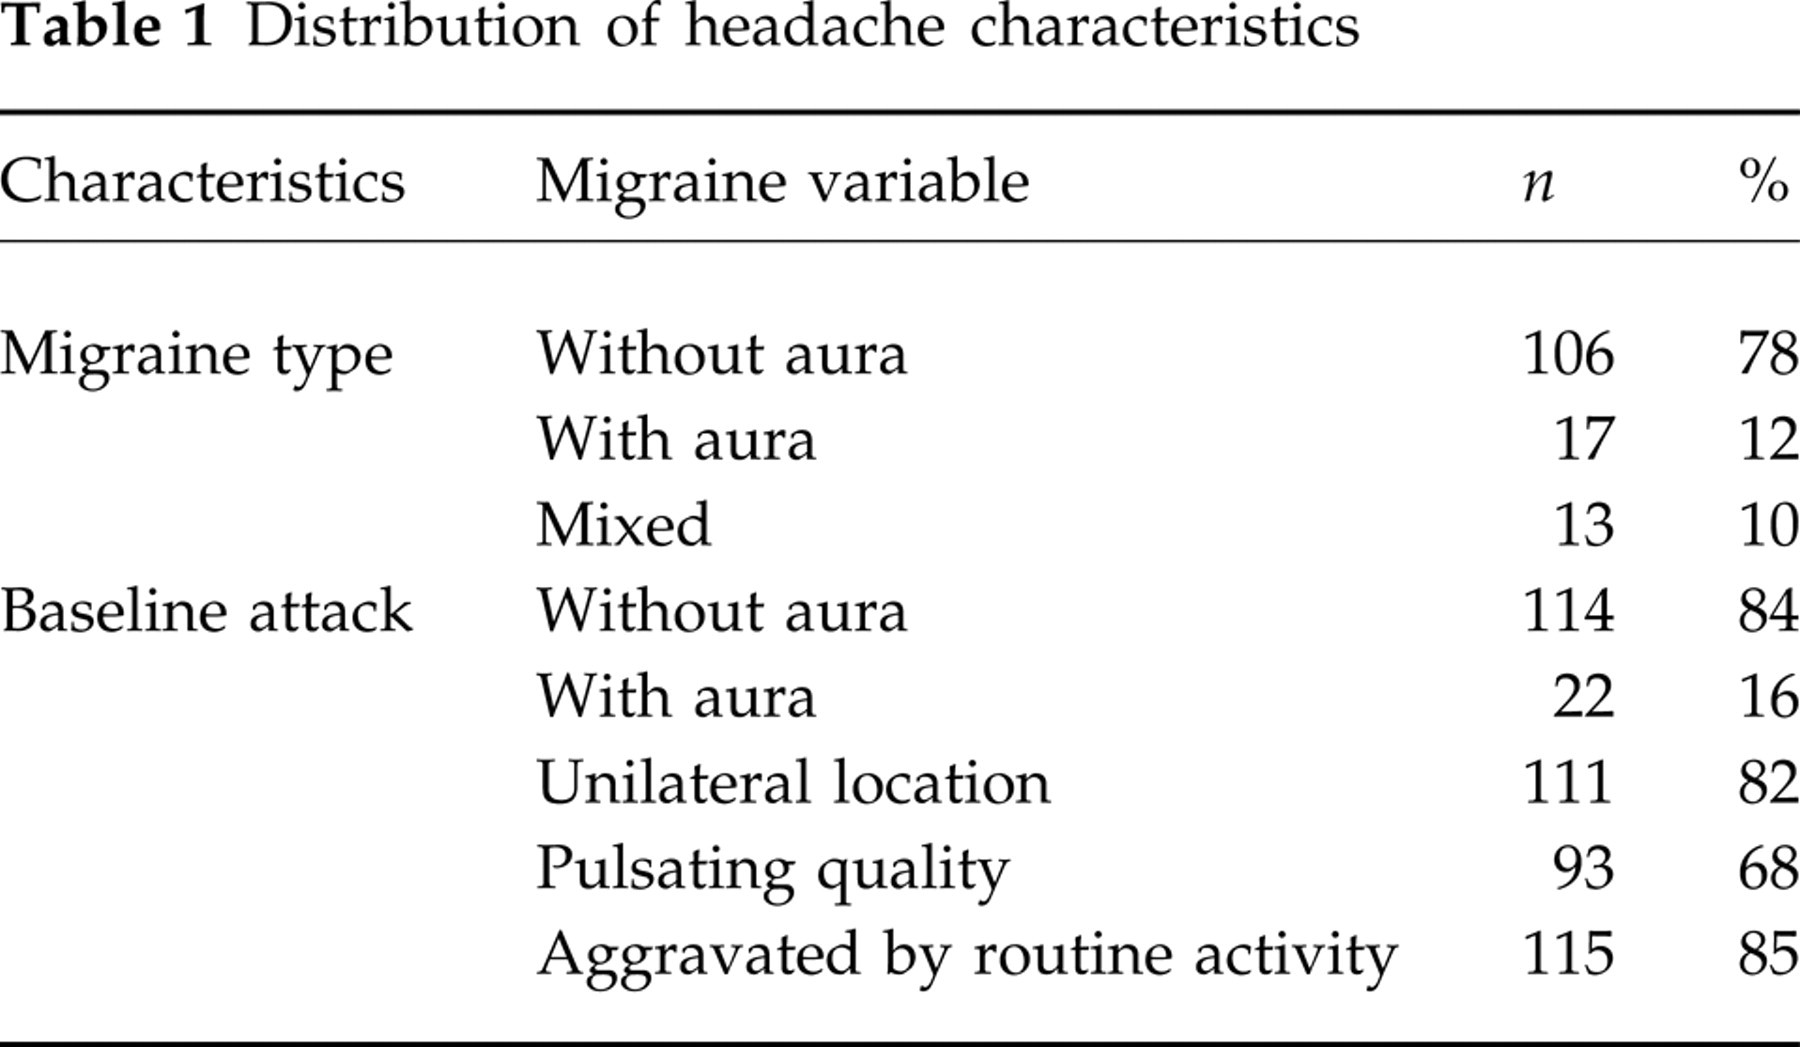
Distribution of headache characteristics
Baseline assessments

One hundred and thirty-six patients received study medication, 88 received T and 48 received P. There were 119 females and 17 males in the study population, with a mean age of 39.8 years, and the group was 90% white. The majority of patients had a history of migraine without aura (78%), their baseline pain was unilateral (82%), and aggravated by routine activity (85%). At baseline, more than half of the patients reported severe headache pain (60%) and most had symptoms of nausea (76%), photophobia (95%) and phonophobia (85%). Most patients (84%) were severely impaired or required bed rest.
The probability of onset, the survival distribution and testing equality of the treatments; without covariates (Table 3)
Estimated probability of onset and conditional median onset

Laska–Meisner non-parametric test of equality of the probability of onset of T and P. Significant at P ≤ 0.05.
Orazem test of equality of the survival distributions of T and P. Not significant.
Parametric test of equality of the probability of onset of T and P in logistic portion of the cure model. Significant at P ≤ 0.05.
Parametric test of equality of the survival distributions of T and P in the Weibull portion of the cure model. Not significant.
Parametric test of whether baseline pain intensity affects the conditional survival distribution of onset. Not significant.
Parametric test of whether baseline pain intensity affects the probability of onset across treatments. Significant at P ≤ 0.05.
Non-parametric analysis
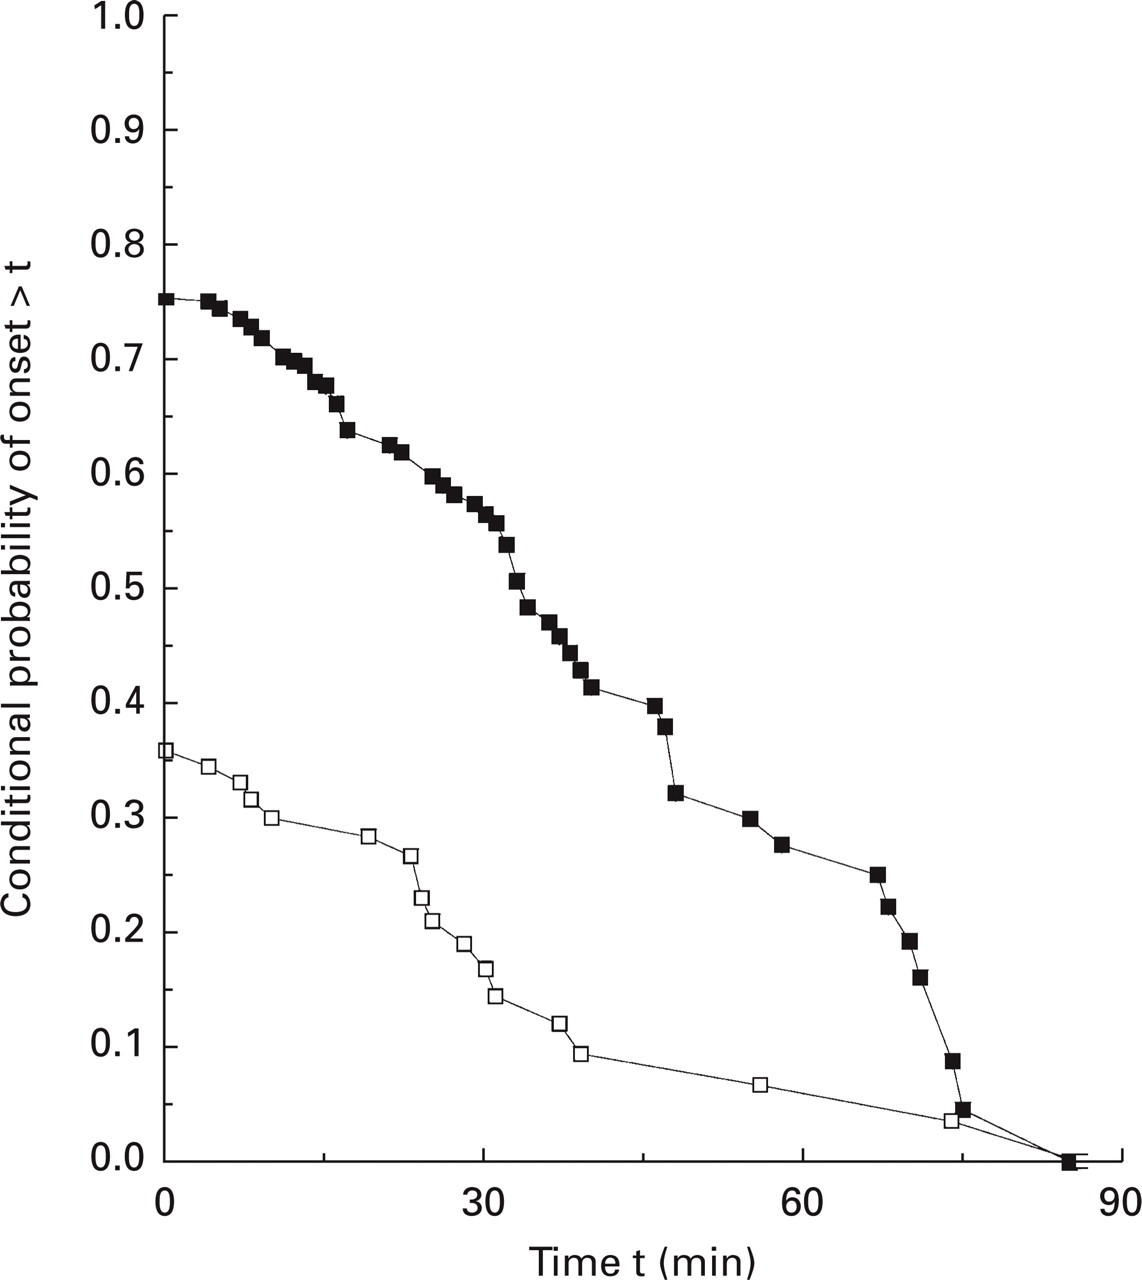
Figure 1 displays H i(t), the unconditional survival distributions of onset for the total sample for treatments T and P. The sample median onset is 33 min for T, but it is not estimable for P since less than half of the patients achieve onset within 90 min of baseline. The unconditional survival distributions of the two treatments were significantly different based on the Wilcoxon test. The probability of onset was 0.36 for those receiving P and 0.75 for those receiving T, and this difference was statistically significant by the Laska–Meisner test. Figure 2 displays the non-parametric conditional survival distributions of onset, S i(t), for T and for P, and these were not statistically different by the Orazem test. The median onset conditional on achieving onset was about 25 min for both treatments. For T, the full population median time (33 min) is approximately 8 min (33 − 25) later than the conditional median onset (25 min). This is true because the probability of obtaining onset after receiving T is relatively large. The same comparison cannot be made for P as it had no unconditional median onset. That is, fewer than 50% achieved onset within 90 min, so the most that can be said is that the median time, if there is one, is greater than 90 min.

Survival distribution H(t) of time to meaningful relief, parametric and non-parametric analysis. □, Placebo non-parametric; ▪, test non-parametric; ○, placebo parametric; ●, test parametric.

Survival distribution S(t) of time to meaningful relief, parametric and non-parametric analysis. □, Placebo non-parametric; ▪, test non-parametric; ○, placebo parametric; ●, test parametric.
Parametric analysis
Figure 1 displays H(t), the unconditional survival distributions of onset for the total sample, and Fig. 2 displays the conditional survival distributions of onset, S i(t), for T and for P. The parameter estimates of P i and S i(t), and the results of hypothesis testing in the parametric analysis were similar and essentially overlap those obtained in the non-parametric analysis.
The effect of covariates on the probability of onset and on the survival distribution; parametric analysis (Table 3)
The effect of baseline pain
The conditional survival distributions of onset of P and T (the Weibull component, S i(t), of the cure model) were not statistically different, and baseline pain was not a statistically significant covariate. However, the difference between treatments in the probability of obtaining meaningful relief (the logistic function component, P i, of the cure model) was statistically significant, and baseline pain severity was a significant covariate. A patient with moderate pain at baseline who receives P has a probability of onset of 0.48 in contrast to 0.86 for a patient receiving T. A patient with severe baseline pain who received P has a probability of obtaining onset of 0.26 compared with 0.70 for one who received T. As severity increases, there is a substantial decrease in the probability of onset for P and to a lesser extent for T as well.
The effect of nausea, photophobia, and phonophobia
As in the preceding paragraph, the conditional survival distributions of onset for P and for T did not differ statistically, but baseline nausea was a significant covariate that had an impact on the survival distribution of onset. For those who had nausea at baseline, onset occurred on average 1.5 times (95% confidence interval ([1.04, 2.27)) later than those who did not.
The intensity of pain at onset (Table 4)
Pain severity at onset of meaningful relief
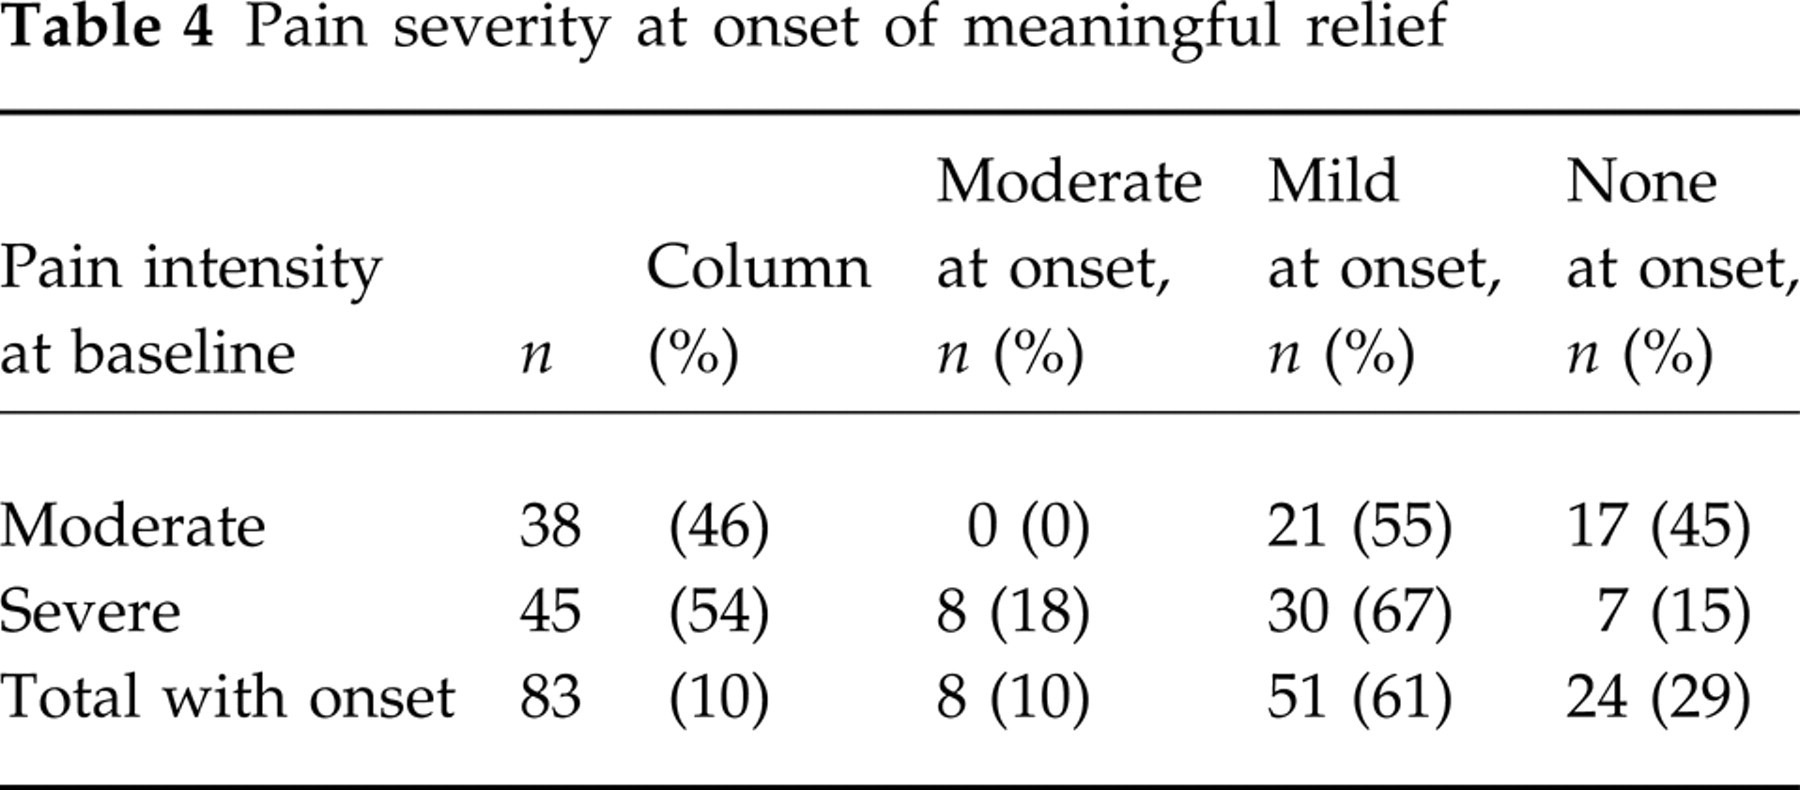
The distribution of pain intensity at the time patients stopped the watch and reported meaningful relief varied as a function of baseline pain. For those with moderate pain at baseline, 55% reported onset when their pain was mild, a one unit change in pain intensity, while the remainder waited until their pain was gone. Of patients with severe pain at baseline, 82% reported onset of meaningful relief when pain was mild or none, representing a change of two or more units. The remaining 18% reported meaningful relief at the time their pain intensity level was moderate. Despite their subjective assessment, these patients are not considered to have had headache response according to the International Headache Society's definition (1).
The probability of onset in the future given it has not yet occurred
Figure 3 displays, as a function of time, the conditional probability of onset given that onset has not occurred by time t based on the Kaplan–Meier non-parametric estimator; Fig. 4 displays the same information, with the addition of stratification by baseline pain intensity, based on the parametric analysis. The non-parametric (Fig. 3) and the unstratified parametric conditional probability of onset (Fig. 4) are essentially identical. Clearly, the probability rapidly decreases as t increases for patients who received P, reaching only about 0.18 by 30 min after baseline and only about 0.05 at 1 h. For those with moderate pain, the probability at 30 min is about 0.31 compared with only 0.13 for those with severe pain. Among patients receiving T, the probability of onset at 30 min is about 0.57 and at 1 h about 0.25. At 30 min, those with moderate pain have a probability of onset of about 0.74 compared with 0.49 for those with severe pain.
Probability onset will occur given that it has not occurred by time t, non-parametric analysis. □, Placebo; ▪, test.

Probability onset will occur given that it has not occurred by time t, parametric analysis.
Discussion
Based on the unconditional (all patients whether or not onset occurs) survival distributions for T and for P, displayed in Fig. 1, T appears to have faster onset than P. It is certainly true that when all patients are considered, the rate over time at which onset is reported is much higher in the group receiving T. However, Fig. 2 demonstrates that the conditional onset rates (given onset occurs) for T and for P are essentially identical. The difference between Figs 1 and 2 is due to the fact that the proportion of patients who obtain onset in the two groups is different, the proportion on P being smaller. Should one conclude that T is faster (Fig. 1) or that the onset is the same (Fig. 2), but T has a higher probability of onset?
Two examples by analogy might provide useful insight. Ten cars from each of two manufacturers, A and B, race to see which cross the finish line faster. Three cars from A and six cars from B fail to finish the race. The four cars from B that are able to cross the finish line do so much sooner than it takes the seven cars from A that finish the race. If cars that fail to finish the race are considered to have large finish times, then one could conclude based on a calculation of median finish time that A's cars are faster. But this would badly misrepresent the actual situation. Clearly, the proper interpretation is that A's cars are more reliable but slower than the cars made by B.
A migraine treatment, C, provides relief of all migraine symptoms within 20 min, but it is only effective in 40% of the patient population. For patients who do not obtain meaningful relief within the 20-min period, the chance of onset is zero. The median onset is not calculable since less than half of the patients obtain onset. Because of its formulation and pharmacokinetics, a second treatment, D, has onset that commences only after 30 min, but it is effective in 85% of the patient population. Based on a plot of the data as in Fig. 1, one might conclude that D has faster onset than C. However, this characterization is not only misleading, it obfuscates the facts. By examining the conditional distributions of onset it is apparent that among those who respond, the onset of treatment C is faster than the onset of treatment D. A rational treatment approach, try C first and if it does not produce onset within 20 min, switch to another treatment, cannot be determined unless the conditional survival distribution is examined.
Is it surprising that among patients who obtain onset, T is not faster than P? Whether the placebo response is psychological, physiological or both, neither formulation nor pharmacokinetics can play any role in onset. If a patient is going to respond to placebo, there is no biochemical mechanism produced by the agent that needs to occur before the event begins. Suggestibility, anticipation, expectation, clinical milieu, doctor–patient relationship and so on may all have an influence on the probability, timing and magnitude of the effectiveness of an agent. However, in a properly conducted clinical trial, such factors should equally affect all study treatments, including placebo.
In addition to the non-specific factors mentioned above that might affect the probability of onset, the clinical state of the individual may play an important role as well. Using the data collected on covariates in parametric models can be clinically informative. In Table 3, we saw that the more severe the intensity of the pain at baseline, the smaller the probability that the treatment, whether T or P, will produce the desired effect. Other factors are important as well, and these may differentially affect the probability and the survival distribution of onset. We found that baseline nausea had a significant affect on the survival distribution of onset, but only the choice of treatment and baseline pain affected the probability of onset. More studies are needed to understand how and the degree to which such factors alter the effectiveness of an agent. The results of such research, which can be carried out with little extra effort during the course of comparative clinical trials, can help clinicians make more informed treatment choices.
The data from this trial suggest that compared with a placebo, an active treatment alters the probability of a response. Can an active treatment also alter the conditional survival distribution? The following conceptual example demonstrates that it can. Two treatments are identical except that as a consequence of their formulation, the absorption of one commences 10 min after the commencement of the absorption of the other. The delay causes little or no alteration in the probability of onset, but the conditional survival distribution of one is a translation by 10 min of the conditional survival distribution of the other. The statistical task of distinguishing between the two might require a rather large sample size and should be considered in power calculations when a study is being designed.
The function Q(t) that describes the chance that a treatment will begin to work at time t given that it had not yet provided meaningful relief (Figs 3 and 4) can serve as a clinical tool that can help rationalize treatment decisions and hence contribute to evidence-based practice. To illustrate, suppose at the time treatment D is administered to a patient with severe migraine pain, it has a probability of onset of 0.7, at 30 min the probability is 0.5 and at 1 h the probability drops to 0.15. Suppose further that the probability of onset of meaningful relief for treatment E at baseline is 0.5, and that it has the same conditional survival distribution of onset and adverse event profile as does treatment D. While treatment D is the right choice to use first, after 1 h, it would seem sensible to change to treatment E because the probability of achieving onset with E is 3.33 (0.5/0.15) times greater than it is with D. (The ratio is calculated under the assumption that the prior administration of D does not change the probability that onset is achieved after the administration of E. It also assumes that the patient is a non-responder to D and a repeat dose would yield the same unsuccessful outcome.) Of course, other factors such as the potential for drug interactions, adverse effects, and the personal probabilities and preferences of the patient may influence the decision as to the course of action.
The odds of obtaining onset after taking treatment i is (1 − P i)/P i, the probability of obtaining onset divided by the probability of not obtaining onset. The relative odds of obtaining onset after receiving T compared with P, called the odds ratio, is (1 − P T)P P/(1 − P P)P T, which is the ratio of the odds of the two treatments. For the present data, the odds for T are about 3, and the odds for P are about 0.56. Therefore, at the beginning of the trial, the odds ratio was 3/0.56, which is about 5.4.
What is the odds ratio for obtaining onset at time t if onset has not occurred? Recalling that the probability of achieving onset at some time after t given that it has not yet occurred is Q(t), the odds ratio is given by QT(t)(1 − QP(t))/(1 − QT(t))QP(t). If the conditional survival distributions of two treatments T and P are the same but they have different probabilities of onset, then for any value of t, simple algebra reduces this odds ratio to (1 − P T)P P /(1 − P P)P T, for all values of t. That is, the odds ratio is a constant (5.4) for all values of t. Thus, the data from the study support the hypothesis that the relative odds of obtaining onset at any time during the 90 min of the clinical trial are 5.4. Note that if the conditional survival distributions of the two treatments are not equal, the odds ratio would vary as a function of time even if the probabilities of onset were the same.
Patients who drop out before they have achieved onset (censored patients) may actually be treatment failures, or they may simply not have waited long enough for the treatment to work. It seems reasonable for a patient who does not achieve meaningful relief after waiting a reasonable period of time to be declared a treatment failure. In the statistical analysis of a cure model, information on censored patients is not treated the same as information on treatment failures. A trial that is too short makes it difficult to distinguish a failure from a censored observation.
Both the parametric and the non-parametric statistical methods described take the experience of the entire sample into account in the estimation procedure. Unless there are no dropouts, it is incorrect statistical practice to examine the data from the subset that actually achieve onset to estimate the probability of onset and the conditional survival distribution. The total sample must be used in the statistical procedure to properly estimate the components—the probability that onset occurs and the survival distribution of onset given onset is achieved—of the cure model.
It has been proposed that Cox proportional hazards (PH) models (3) be used to analyse onset in migraine trials (4). The validity of such an analysis depends on whether the assumption that the hazards of the two treatments are proportional (i.e. at every time point their ratio is a constant) is indeed true. Notably, in the form presented here, it can be shown that the cure model does not satisfy this condition. Hence, if a cure model does represent the data, then the proportional hazards approach cannot be used. On the other hand, it is possible for a PH model to have a surviving fraction, which is analogous to the probability of not obtaining onset. However, the PH assumption must be true at all times. This is a rather strict demand that imposes a considerable constraint on the ability of the model to fit sometimes diverse data. For example, in the clinical trial described above, the surviving fraction of T is considerably larger than P, but because a Cox model assumes that the hazards are proportional, T has a substantially larger weight in the estimation of the parameters of the model. As a consequence, for treatment P, the fit of the data under a PH model (which must take into account the data from treatment T) cannot be as good as it is under a Kaplan–Meier cure model (which independently fits the data for each treatment).
Recently, a Bayesian model for survival data with a cure component has been proposed (12) that can be put into a proportional hazards framework, but evaluation of its applicability to migraine trials remains to be carried out.
Because patients participating in a clinical trial voluntarily subject themselves to experimental treatments and to placebo, investigators have an obligation to obtain and disseminate the maximum amount of information possible. One of the most valued properties of a treatment is the time that it takes to become effective. Periodic assessments of pain intensity provide only crude estimates of the actual time that a patient experiences onset, so the use of a stopwatch is much preferred. The experience of many investigators confirms that the logistics of this approach do not compromise the ability of patients also to make assessments at scheduled observation times. The data collected must be analysed statistically so that inferences about the relative effectiveness of the treatments rule out chance occurrences. It is a well-established scientific principle that model assumptions should be kept to a minimum. The cure model is a natural one that seems to be consistent with the data from many clinical trials and with clinical conceptualizations about the pattern of patient responses. In particular, information as to the probability of obtaining onset and the conditional distribution of onset provide guidance for determining which treatment to use and how long to wait before making additional interventions if the treatment is unsuccessful. The value of the information gained from a clinical trial for rational clinical decision making emphasizes the importance of proper experimental design and statistical analysis for ascertaining the properties of a treatment for migraine.
Footnotes
Acknowledgements
The authors wish to thank Joseph Wanderling and Gayla P. Putman for their critical insights and helpful assistance, and Glaxo Wellcome for making their data available to us. Financial support for this research was provided in part by Glaxo Wellcome Inc., Research Triangle Park, North Carolina. The funding agreement ensured the authors' independence in interpreting the data and writing and publishing the report.