
Abstract
Microangiopathic end-organ injury is common in type 1 diabetes. However, the pathophysiology of diabetic encephalopathy is poorly understood. The authors studied 10 normotensive patients with type 1 diabetes with retinopathy, autonomic neuropathy, but without nephropathy, and 10 healthy subjects. Proton magnetic resonance spectroscopy was performed at 1.5 T in the frontal cortex, thalamus, and posterior frontal white matter. There was no change in N-acetyl–containing compounds (NA), but choline-containing compounds (Cho) were increased in the white matter and in the thalamus; myo-inositol was increased in the white matter, glucose excess was found in all brain, and water intensity was increased in the cortical voxel in the patients. Calculated lifetime glycemic exposure correlated inversely with Cho and NA in white matter and with Cho in thalamus. Concentrations of soluble intercellular adhesion molecules and vascular cell adhesion molecules were increased in the patients. In conclusion, in patients with type 1 diabetes, the increase in adhesion molecules and an association between altered brain metabolites and glycemic exposure suggest the presence of a vascularly mediated, progressive metabolic disturbance in the brain.
Microangiopathic and macroangiopathic complications are common in patients with type 1 diabetes. Emerging evidence exists that the brain is a target for diabetic end-organ damage. However, the pathophysiology of diabetic encephalopathy (i.e., cognitive, neurophysiologic, and structural changes in the brain) is poorly understood. Both vascular and metabolic disturbances have been suggested to impair the integrity of the brain in diabetes (McCall, 1992).
Diabetes is a well-known risk factor for ischemic stroke. In patients with type 1 diabetes, stroke is often related to cardiovascular disease, hypertension, and proteinuria (Fuller et al., 2001), although it can appear even in the absence of these risk factors (Chukwuma and Tuomilehto, 1993). Risk of death from nonhemorrhagic stroke is especially high in young adults with type 1 diabetes and has been suggested to be of ischemic origin (Laing et al., 2003). Widespread diabetic angiopathy, ischemic lesions, and diffuse degenerative abnormalities have been described postmortem in the brains of patients with type 1 diabetes who are younger than 40 years old (Reske-Nielsen et al., 1965). Diffuse brain atrophy is a common finding of magnetic resonance imaging in patients with type 1 diabetes, and is associated with microvascular and macrovascular complications, hypertension, age, and recurrent hypoglycemias (Perros et al., 1997). Furthermore, type 1 diabetic patients without a history of cerebrovascular disease are prone to subclinical abnormalities in cerebral blood flow, as assessed by single photon emission tomography (Quirce et al., 1997).
Proton magnetic resonance spectroscopy (1H-MRS) is a sensitive, noninvasive technique that can provide information on neuronal condition and membrane metabolism of areas of interest within the brain (Ross and Bluml, 2001; Ross and Michaelis, 1994). The N-acetyl–containing compounds (NA) N-acetylaspartate (NAA) and N-acetylaspartate glutamate (NAAG) are synthesized primarily in neurons and act as major osmolytes (Baslow, 2002). NA have been used as a neuronal marker, although astrocytes and oligodendrocytes are also involved in their metabolism (Baslow, 2002). Decreased levels of NA reflect axonal or neuronal dysfunction, or loss in neuronal density, such as seen in stroke, hypoxia, neoplasm, epilepsy, multiple sclerosis, and dementia (Burtscher and Holtås, 2001). Consequently, increased levels of NA can represent axonal recovery (Jackson and Connelly, 1999). Crt, a sum of creatine and phosphocreatine, serves as an indicator of oxidative metabolism, and Crt decreases in hypoxia and trauma (Katsura et al., 1996). Choline-containing compounds (Cho) provide an insight into the metabolism of myelin and other phospholipid cell membranes (Burtscher and Holtås, 2001). Of the cerebral metabolites, NA and Crt are reduced and Cho are increased in chronic ischemia (Constans et al., 1995). myo-Inositol (mI) is a membrane constituent that reflects proliferation or activation of glia. It is also a cell messenger that has an osmoregulatory function. Increased mI can be seen in hyperosmolar states, such as hypernatremia, renal and hepatic failure, and alcohol toxification, where it is thought to stabilize the intracellular environment (Schweinsburg et al., 2000). Increased glucose (Glc) concentrations have been found in patients with diabetes (Kreis and Ross, 1992).
This study was conducted to search for possible changes in brain metabolites with 1H-MRS in patients with type 1 diabetes. No previous reports exist on brain metabolism of type 1 diabetic patients with chronic severe hyperglycemia. The spectroscopic results were related to clinical data to investigate the putative relationship of brain metabolic abnormalities with other diabetic end-organ injuries.
MATERIALS AND METHODS
Subjects
Ten patients with type 1 diabetes and 10 healthy subjects volunteered to participate in the study. The patients were recruited from the outpatient clinic according to the following criteria: (1) age at diagnosis of diabetes of less than 15 years, (2) undetectable fasting C-peptide concentration (<0.1 nmol/L), (3) normotension (systolic blood pressure < 130 mm Hg and diastolic blood pressure < 80 mmHg), (4) no proteinuria (urinary albumin excretion rate < 20 μg/min), (5) no present or past cerebrovascular and cardiovascular symptoms or disorders, and (6) no severe hypoglycemias during diabetes duration. The healthy subjects and the patients were matched for age, gender, height, and weight (Table 1). Histories were taken and physical examinations and laboratory tests were performed in all subjects to exclude diseases other than diabetes. All patients and subjects had normal blood counts, serum creatinine and electrolyte concentrations, and electrocardiograms (data not shown). The subjects did not use antihypertensive, anticoagulative, or lipid-lowering drugs. The patients with diabetes were using a combination of intermediate- and short-acting insulins (Table 1). The Ethical Committee of the Helsinki University Hospital approved the study. Informed written consent was obtained from the participants.
Characteristics of the study groups (mean ± SD)
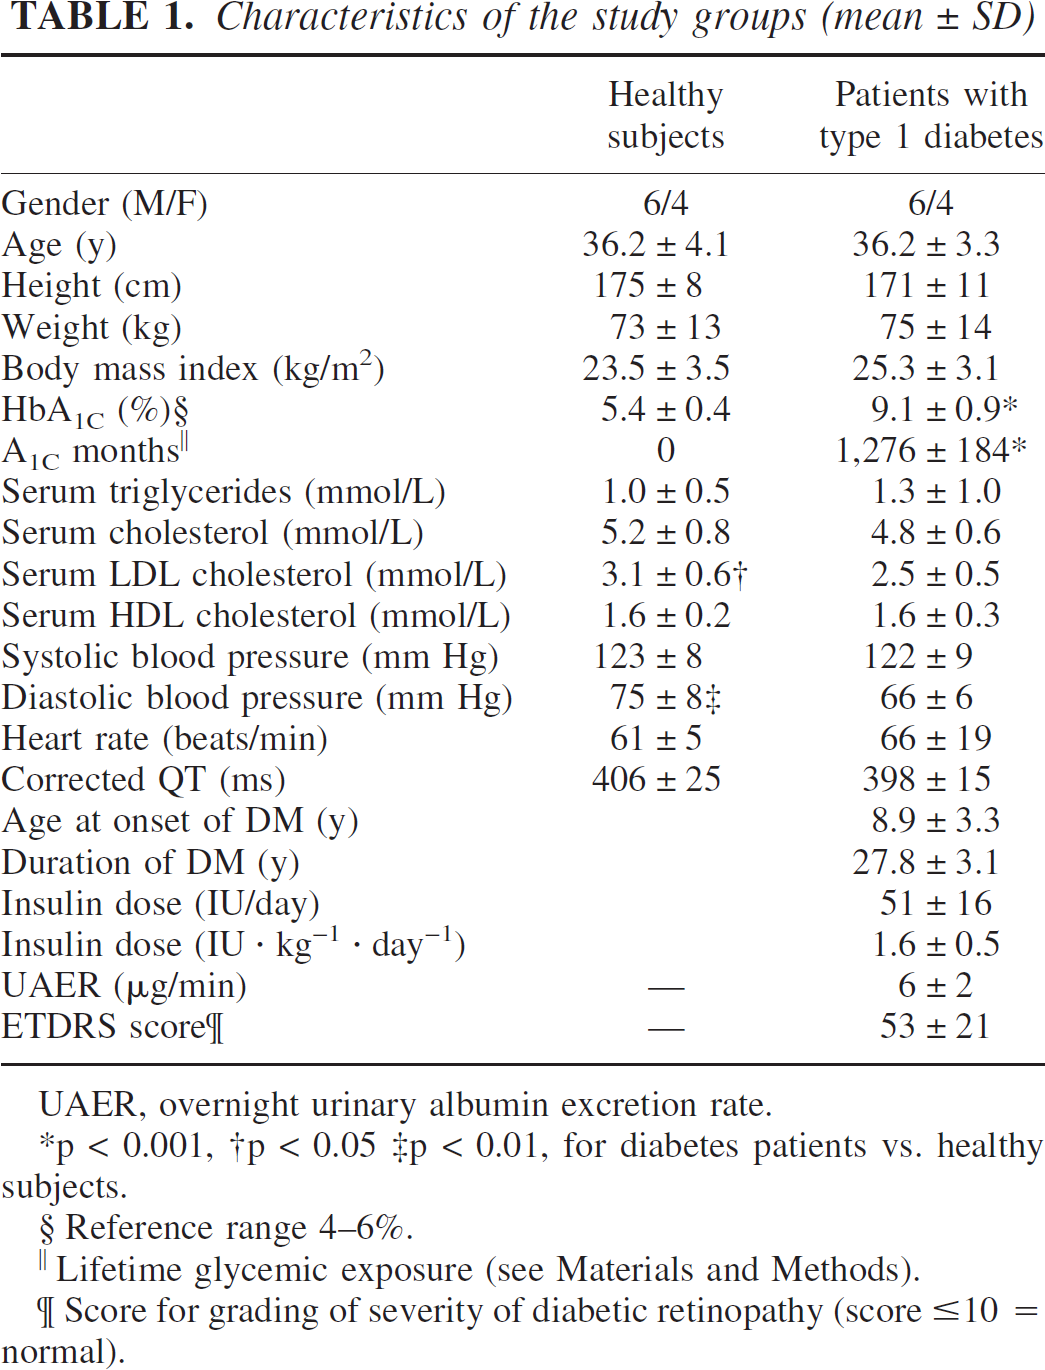
UAER, overnight urinary albumin excretion rate.
p < 0.001
p < 0.05
p < 0.01, for diabetes patients vs. healthy subjects.
Reference range 4–6%.
‖Lifetime glycemic exposure (see Materials and Methods).
Score for grading of severity of diabetic retinopathy (score ≤ 10 = normal).
Magnetic resonance imaging and spectroscopy
A 1.5-T magnetic resonance imager (Signa Horizon LX Echospeed; GE Medical Systems, Milwaukee, WI, U.S.A.) with a standard quadrature birdcage head coil was used. Axial, coronal, and sagittal brain images were taken using T1, T2, and FLAIR sequences. Magnetic resonance images were evaluated in terms of presence of atrophy and white matter hyperintensites by a neuroradiologist (O.S.) blinded to clinical data. All brain images were in the normal range, excluding one suspected cavernoma in the right parietal region in a control subject.
Localized 1H-MRS was performed using PRESS sequence, with an echo time of 35 milliseconds, a repetition time of 3,000 milliseconds, 64 to 94 excitations, and an eight-step phase cycle. Water-suppressed metabolite spectra were collected from a 6-mL to 8-mL volume. This voxel was placed bilaterally in the frontal cortex, in the left thalamus (deep gray matter), and in left posterior frontal white matter. Non–water-suppressed spectra were collected using 16 acquisitions from the same volumes. The spectral bandwidth was 2,500 Hz and 2,048 points were acquired. The data were postprocessed and analyzed with automatic PROBE-program (GE Medical Systems) including onefold zero-filling, Lorentz-to-Gauss line shape transformation, zero-order phase correction, linear baseline correction, and Gaussian line shape fitting. Signal intensities were expressed in institutional units and were corrected for receiver gain, coil loading, and voxel size. The analyzed resonances included NA, Crt, Cho, mI, and water. Patient and control spectra were averaged and subtracted from each other to obtain a difference spectrum (Fig. 1). To estimate the Glc excess in the patients, a 100-mmol/L D-glucose solution was measured and compared with the difference spectrum.
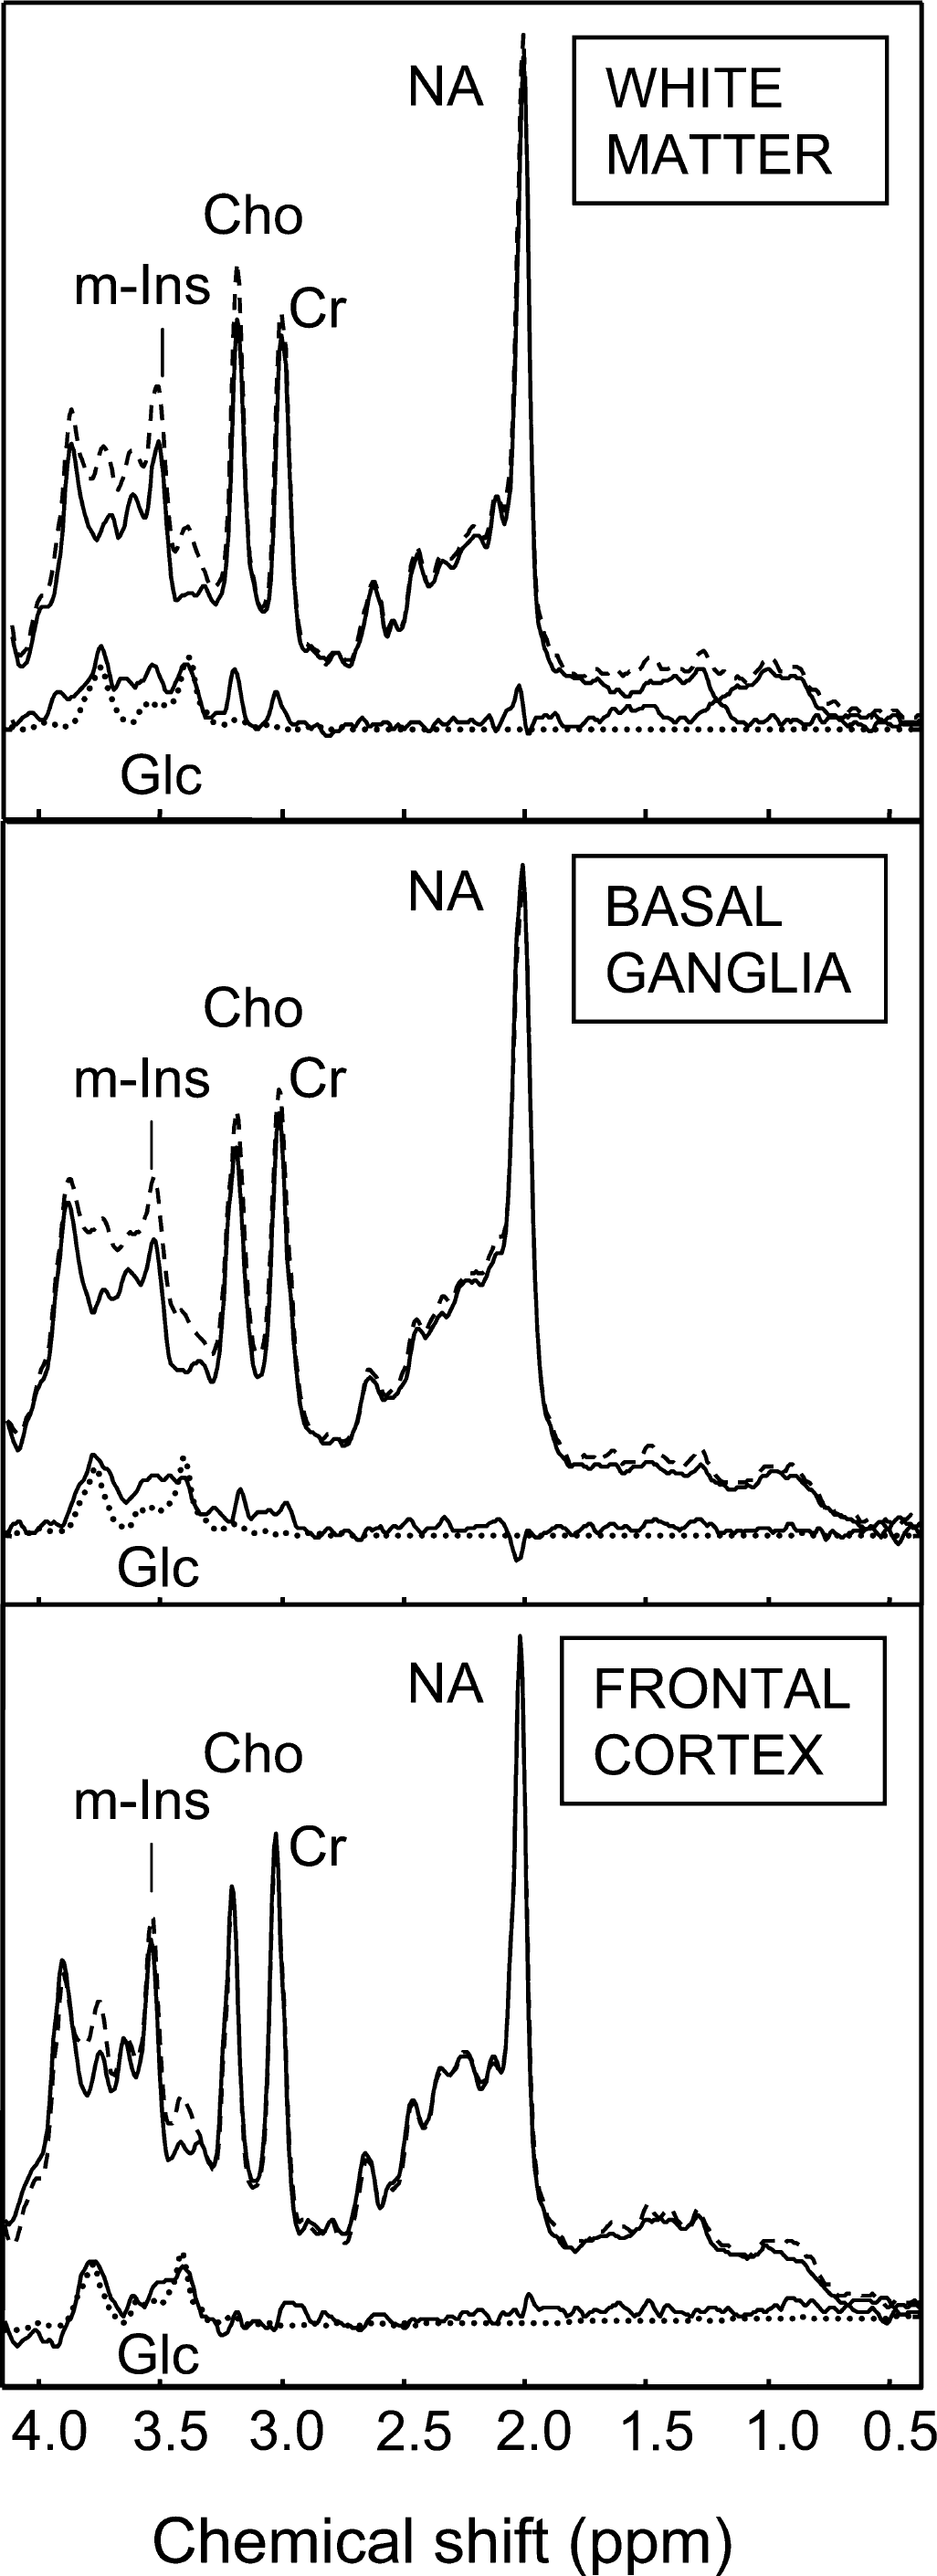
Mean 1H MR spectra of the controls (upper solid line) and the patients (dashed line) together with the difference spectra (lower solid line) form the frontal white matter, basal ganglia, and frontal cortex, respectively. A D-glucose (Glc) spectrum (dotted line) is included.
Assessment of diabetic complications
Glycemic control
Until 1987, glycosylated hemoglobin (HbA1) was measured using microcolumn chromatography with Quick-Step columns (Isolab, Acron, OH, U.S.A.). In 1987, the HbA1 assay was replaced by measurement of HbA1C using HPLC (BioRad, Richmond, CA, U.S.A.), and both HbA1 and HbA1C were measured. The data were used to convert HbA1 to HbA1C values as follows: HbA1C = −0.219 + 0.886 ϗ HbA1 (r = 0.96, n = 110, P < 0.0001). The intraindividual coefficient of variation of measured and calculated HbA1C values was 7.0 ± 0.4%. Lifetime glycemic exposure was calculated by multiplying the number of HbA1C units above the upper limit of normal (6.0%) by the number of months between the preceding and succeeding intervals (A1C months).
Other laboratory analyses
Venous blood samples were collected after a 10-hour to 12-hour fast. Serum concentrations of triglycerides as well as total and high-density lipoprotein cholesterol were determined by enzymatic colorimetric assays (Boehringer Mannheim, Mannheim, Germany, and Hoffman La Roche; Diagnostica, Basel, Swizerland). Low-density lipoprotein cholesterol was calculated using Friedewald's formula. Intercellular adhesion molecules and vascular cell adhesion molecule concentrations were analyzed using the commercial enzyme-linked immunosorbent assay kit (R&D System, Minneapolis, MN, U.S.A.).
Statistical methods
Data between the two groups were compared using Student's t-test. Urinary albumin excretion rate and serum triglyceride concentrations were log-transformed before analysis because of their nonnormal distribution. Simple correlations were calculated using Spearman nonparametric pairwise rank-order correlation coefficient. Normally distributed data are expressed as means and standard deviations. For nonnormally distributed data, the median and the interquartile range (25%, 75%) are given.
RESULTS
Patient characteristics and diabetic complications
The patient characteristics are shown in Table 1. None of the patients had nephropathy, but all had moderate to severe diabetic retinopathy. The low-frequency component of heart rate variability was impaired in patients with type 1 diabetes 672 (520, 1,137) ms2 (P = 0.03) compared with healthy subjects 376 (287, 522) ms2; other results in cardiovascular autonomic function test were comparable (data not shown). The decrease in peripheral blood flow in response to a cold stimulus was similar in patients with type 1 diabetes (–42% ± 21%) and healthy subjects (–40% ± 22%).
Proton magnetic resonance spectroscopy
In the patients with type 1 diabetes, Cho were increased by 21% in the white matter (92 ± 19 versus 76 ± 10 IU, P = 0.02), and by 17% in the thalamus (98 ± 17 versus 84 ± 11 IU, P = 0.05). mI resonance at 3.5 ppm, which includes contributions from Glc and tentatively from glycine, was increased by 30% in white matter (57 ± 12 versus 44 ± 6 IU, P = 0.007). The patients with diabetes were estimated to have about 3-mmol/L excess of glucose in all measured brain locations compared with healthy subjects (Fig. 1). There were no significant differences in mean NA or Crt between the two groups (Fig. 2). Water resonance intensity was increased by 33% in frontal cortical voxel of diabetic patients compared with healthy subjects (2.1 · 105 ± 0.5 · 105 versus 1.6 · 105 ± 0.4 · 105 IU, P = 0.02), but was similar in deep gray matter (1.5 · 105 ± 0.2 · 105 versus 1.4 · 105 ± 0.1 · 105 IU) and in frontal white matter (1.4 · 105 ± 0.3 · 105 versus 1.3 · 105 ± 0.1 · 105 IU) between the two groups.
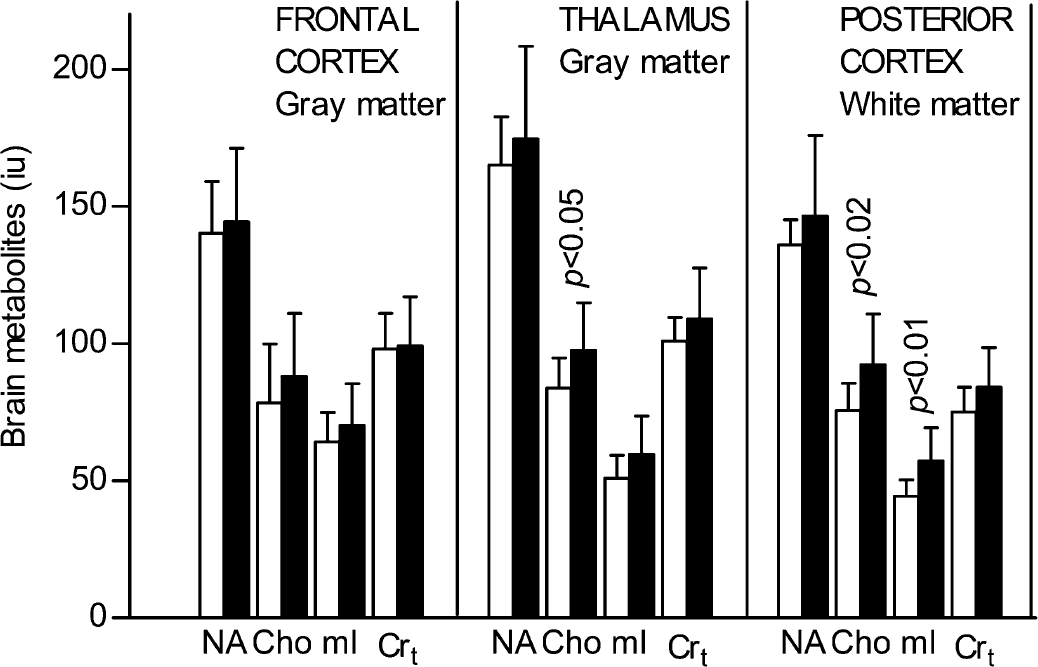
Brain metabolites in patients with type 1 (black bar) vs healthy subjects (white bar). Means ± SD. The mI elevation includes contribution from Glc.
Biochemical and clinical characteristics and brain metabolites
Cumulative lifetime glycemic exposure ranged from 1,036 to 1,559 A1c months in the patients with diabetes, indicating a mean HbA1c 5.3% above normal for 20 years. In a regression analysis, A1c months was the strongest predictor of brain metabolite levels in patients with type 1 diabetes. A1c months were inversely correlated with NA (r = −0.72, P < 0.05) and Cho (r = −0.87, P < 0.001) in the white matter (Fig. 3), and with the Cho in deep gray matter (r = −0.56, P < 0.05). No association was found between A1c months and mI or Crt. Brain metabolites were not associated with the duration of diabetes, blood pressure, urinary albumin excretion rate, blood lipid profile, heart rate variance analysis results, or sympathetic vasomotor function, but ETDRS score of retinopathy had a trend toward inverse correlation with white matter mI (r = −0.48, P = 0.08). Concentrations of intercellular adhesion molecules (264 ± 22 versus 219 ± 46 ng/mL, P = 0.02) and vascular cell adhesion molecules (371 ± 89 versus 284 ± 51 ng/mL, P = 0.02) were increased in diabetic patients compared with healthy subjects, but were not significantly associated with brain metabolite levels in the patients.
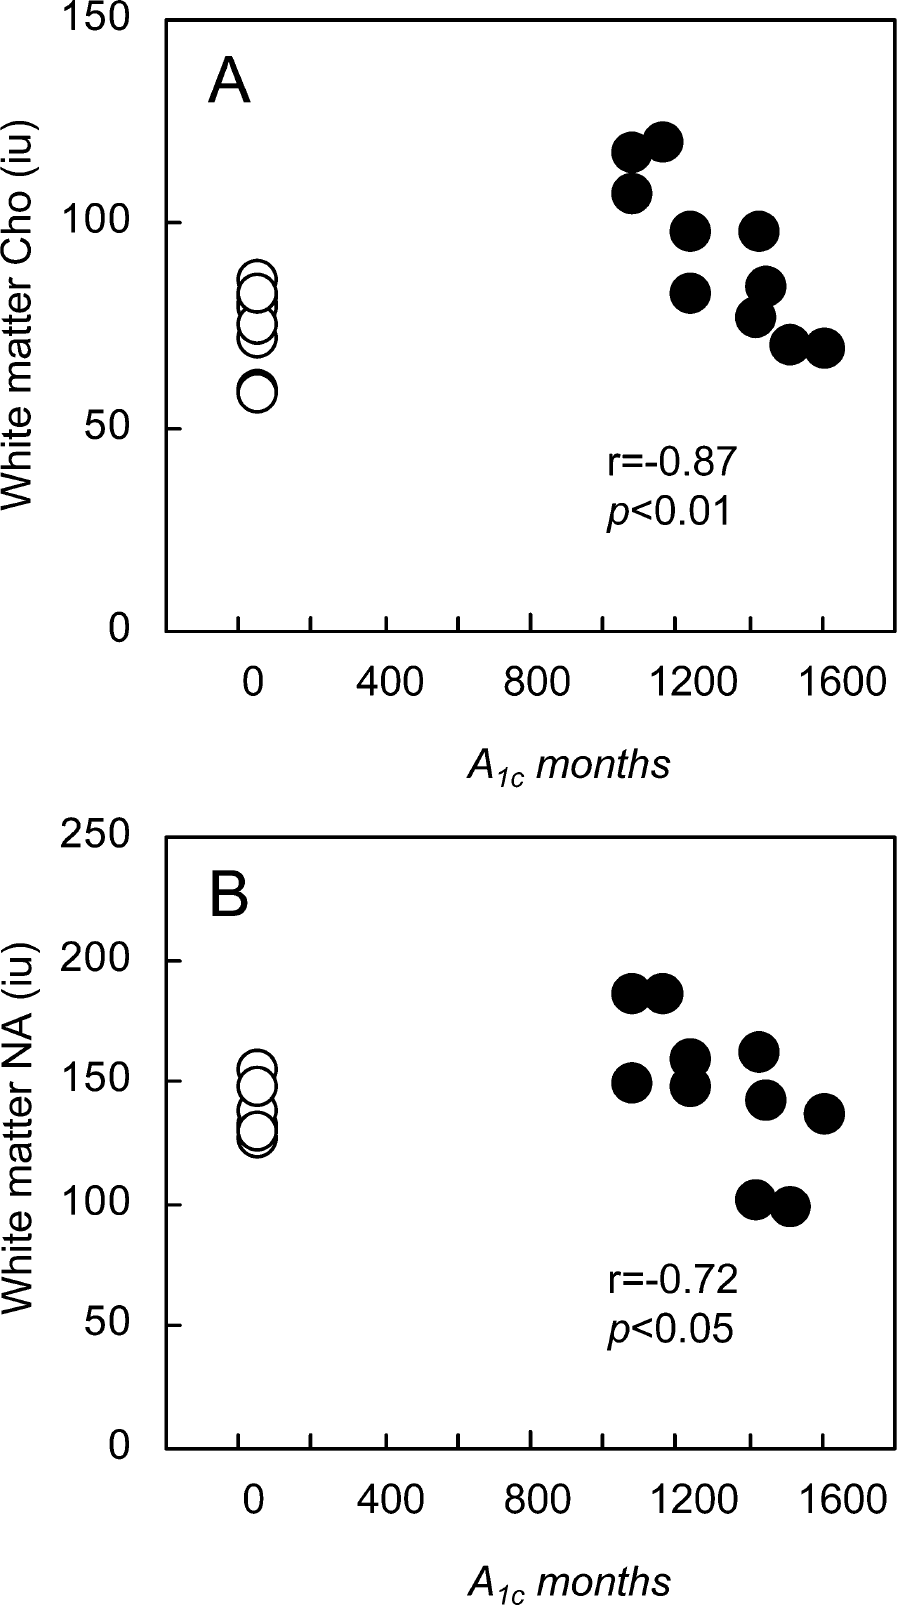
Relationship between A1c months and Cho (
DISCUSSION
In the present study, localized 1H-MRS was used to define brain metabolite levels in patients with normotensive type 1 diabetes and normal brain magnetic resonance imaging findings. We found that Cho were increased in posterior frontal white matter and in thalamic deep gray matter, mI was increased in the white matter, and Glc was increased in all measured brain locations (Fig. 1). Further, cortical water intensity was increased in patients with type 1 diabetes when compared with healthy subjects. NA in the white matter and Cho in the white and deep gray matter were associated with a lifelong cumulative index of hyperglycemia. We suggest that our findings represent a cascade where hypoxic damage to the glial cells will eventually lead to neuronal dysfunction or loss (Kurosinski and Götz, 2002).
Proton magnetic resonance spectroscopy can provide specific information on the condition of glial cells and neurons, and both white matter and gray matter structures can be separately interrogated. The data on brain metabolite levels in type 1 diabetes are sparse and contradicting. In one study of a mixed group of type 1 and 2 diabetes patients of whom 10 (45%) were recovering from diabetic ketoacidosis, Glc, Cho, ketone, and mI were increased in gray matter of the posterior occipital cortex and in white matter of the posteromedial parietal region, whereas NA were decreased in the parietal region (Kreis and Ross, 1992). In another study, inconsistent with our findings, no changes were found in brain metabolites of the frontal and parietal lobes in 22 type 1 diabetes patients of whom 41% had cortical atrophy with a significant association to a history of recurrent severe hypoglycemia (Perros et al., 1997).
Levels of NA in the white matter of patients with diabetes varied markedly compared with those found in the healthy subjects (Fig. 3). The patients with lower glycemic exposure had clearly elevated NA, whereas most of those patients with the highest exposure had NA levels below the range of the healthy subjects. Such large variations in NA and an inverse correlation to the glycemic index most likely arise from at least two different mechanisms. An increase in NA has been reported in Canavan's disease due to lack of degrading enzyme (aspartoacylase) activity (Grodd et al., 1991) and during recovery of moderate neuronal injury (Jackson and Connelly, 1999). In our patients, the marked increase in NA may represent either an attempt of axonal recovery during an ongoing metabolic neuronal damage or a derangement of cellular osmoregulation, or both. According to recent research, NA serves as a molecular water pump between neurons and oligodendrocytes (Baslow, 2002). The synthesis of NA is directly coupled to glucose metabolism (Moreno et al., 2001). In humans, the glucose transporters GLUT-1 and GLUT-3 predominantly mediate cerebral glucose uptake and metabolism. GLUT-3 is found in neurons and GLUT-1 is localized at the blood–brain-barrier endothelium and perivascular endfeet of astrocytes (Vannucci et al., 1997). It has been suggested that GLUT-1 expression of capillaries is reduced during hyperglycemia, resulting in lower brain intracellular glucose concentrations and in a relative hypoosmolar condition (Duelli et al., 2000). Because NA is needed to pump excess water out of the neurons, the production of NA could be increased to compensate for a loss of NA to the extracellular space. This idea is supported by in vivo animal studies, where under hypoosmolar condition an efflux of NA from intracellular to the extracellular site in brain has been shown (Davies et al., 1998). It is notable that glucose, a precursor of NA, is amply available, and that MRS does not differentiate between the extracellular and intracellular compartments.
The primary role of NA is neuronal–glial cell-specific signaling for the maintenance of normal central nervous function. NA are synthesized in the mitochondria, and a decreased NA levels are characteristic in mitochondrial disorders (Ross and Michaelis, 1994). Recently, in a diabetic animal model, hyperglycemia was shown to cause mitochondrial swelling initiating a hypoxic cell death pathway in the brain (Muranyi et al., 2003). The decline in brain NA levels observed in our patients with severe chronic hyperglycemia might therefore reflect slowly progressing neuronal dysfunction through an ischemic/hypoxic mechanism.
Cho were increased in the posterior frontal white matter and in thalamic deep gray matter in our patients (Fig. 2). Increased Cho levels are observed in axonal injury, demyelination, and other membrane breakdown, as well as in enhanced membrane proliferation such as active gliosis (Burtscher and Holtås, 2001). Concomitant increases of Cho and mI in our patients may correspond to glial proliferation due to relative tissue hypoxia. In addition, mI may be increased during osmotic disturbances related to hyperglycemia (Brand et al., 1993). Persistent hyperglycemia in cerebral capillaries may also increase the formation of glucose-6-phosphate, which is a substrate for mI formation in the brain (Kreis and Ross, 1992).
In our patients with chronic severe hyperglycemia, brain membrane markers tended to decline (Fig. 3). This phenomenon may arise from hyperglycemia-induced microvascular damage, which leads to tissue ischemia due to impaired gas exchange. Hyperglycemia damages vascular endothelium by thickening the basement membrane and by impairing the perivascular nerve regulation, decreasing the ability to compensate for changes in perfusion pressure. The negative correlation of NA and Cho levels with chronic hyperglycemic exposure suggests that a chronic stage of glial damage will follow an initial phase of glial proliferation, leading to a diminished pool of glial/membrane markers (Kurosinski and Götz, 2002). Eventually, the declining glial cell component fails to adequately shuffle nutrients and metabolites between neurons and capillaries, leading to neuronal damage and loss of NA. Furthermore, the increased intercellular adhesion molecule and vascular cell adhesion molecule concentrations suggests a vascularly mediated metabolic injury. This is supported by the single photon emission computed tomography and single photon emission tomography studies that have shown impaired cerebral blood flow in patients with type 1 diabetes without a history or evidence of cerebral disease (Keymulen et al., 1996; Vázquez et al., 1999).
We did not have a segmentation method to correct for the presence of CSF in the cortical voxel. However, the unsuppressed water signal in the three brain locations can be used to evaluate the effect of possible cortical atrophy on our metabolite measurements. In the thalamus and white matter voxels, where no CSF is present, the water intensities were 1.4 to 1.5 · 105 IU and 1.3 to 1.4 · 105 IU, respectively. This is in agreement with the known difference in nuclear magnetic resonance–visible water content of gray matter (88%) and white matter (74%) (Barker et al., 1993). There was a significant increase in the cortical voxel water intensity in the diabetic group (2.1 · 105 ± 0.5 · 105 IU versus 1.6 · 105 ± 0.4 · 105 IU), indicating an increase of the sulcal CSF (i.e., cortical atrophy not detectable on visual evaluation). Despite this finding, there was no difference in the cortical voxel metabolite intensities between the two groups (Fig. 2). This suggests that in the cortex of the diabetic patients, there is a true increase of metabolites, or at least of choline. Therefore, a similar metabolic alteration seems to be present in all supratentorial brain locations of our diabetic patients.
In our study, the degree of diabetic retinopathy had a slight albeit nonsignificant association with white matter mI. Retinopathy is associated with impaired cerebrovascular responsiveness in long-duration type 1 diabetes (Fulesdi et al., 1997). In a recent study of young patients with type 1 diabetes, cognitive functional and structural changes in brain magnetic resonance images were observed in those with chronic hyperglycemia and microvascular complication of background retinopathy, but not in those with recurrent severe hypoglycemia (Ferguson et al., 2003). In patients with type 1 diabetes, the maintenance of good glycemic control for several years prevents the development or progression of microvascular complications, although at the expense of an increased risk of hypoglycemia (The DCCT Research Group, 1993). Chronic hyperglycemia leading to generalized microangiopathy may, however, have more detrimental effects on the brain than recurrent exposure to hypoglycemia (Ferguson et al., 2003). Our findings suggest that diabetic encephalopathy should be seriously considered as another, most likely microvascular, diabetic complication related to chronic hyperglycemia.
Footnotes
Acknowledgements
The authors thank Saija Eirola, Jesper Lundbom, and Tuija Mård for their excellent technical assistance and all of the volunteers for their help.