
Abstract
A new β-microprobe (βP) has been used to locally measure the time–concentration curve of a radiolabeled substance. The βP, analogous to positron emission tomography methodology, is useful for in vivo animal studies because it can acquire time–concentration curves with high temporal and spatial resolution. Using [18F]fluoro-2-deoxy-
The brain obtains most of its energy supply by metabolizing glucose and producing ATP, which is required for active ion transport, protein synthesis, and other biochemical reactions (Attwell and Laughlin, 2001; Purdon and Rapoport, 1998; Sokoloff, 1959). The uptake of glucose into astrocytes is stimulated by synaptically released glutamate (Magistretti et al., 1999; Pellerin and Magistretti, 1994). Brain glucose metabolism can be decreased in neuropathologic conditions in which there is a failure of brain function, and several in vivo methods have been developed to assess glucose uptake both in animals and humans. In animals, the most widely used method to assess brain glucose consumption at rest and during activation states is autoradiography, in which [14C]2-deoxy-
The development of a new β-microprobe (βP), which locally measures the time–concentration curve of a radiolabeled substance (Pain et al., 2000), has allowed the expansion of in vivo animal studies. This probe has been shown to acquire time–concentration curves with high temporal and spatial resolution, and it is being applied to metabolic and neurotransmission studies (Pain et al., 2002; Zimmer et al., 2002). Although a study of brain glucose metabolism in rats was able to quantify localized neuronal activation and inhibition with the βP, there was a large variability in rCMRglc values (Pain et al., 2002). βP is an invasive technique, requiring the introduction of the probe into the animal brain, and may involve methodologic problems different from those of PET. In this study, we have evaluated, using the βP, the reliability of the kinetic parameters obtained in several models currently used with PET (Lammertsma et al., 1987). In addition, because of its widespread use, we have compared results obtained with [14C]2-deoxy-
METHODS
The β-microprobe
β-microprobe is a β-counting system that allows measurement of the kinetics of a labeled molecule used in PET in a restricted area of the brain of an anesthetized animal. βP takes advantage of the short range of β+ particles in biologic tissues, which limits the detection volume surrounding the probe (Pain et al., 2000). The probe is composed of a scintillating plastic fiber (Bicron, Newbury, OH) attached to an optical-fiber light guide. In this study, we used a 0.5-mm-diameter, 1-mm-length β-radiosensitive detector attached to a 0.5-mm-diameter, 6-mm-length optical-fiber light guide. The detection volume is defined by a sphere of about 0.8-mm radius centered on the probe tip for 18F (Pain et al., 2002). The optical-fiber light guide is coupled to a photomultiplier (Hamamatsu R7400, Hamamatsu Photonics, Hamamatsu City, Japan), which transforms light pulses into count rates proportional to the FDG concentration.
Calibration procedure
We used four probes simultaneously to measure time–concentration curves in three brain regions and in blood. The photomultipliers with stoppers were each warmed up for 1 hour before each experiment to stabilize noise and sensitivity. A standardized calibration procedure was performed to simultaneously calibrate the probes. The probes were placed into a solution of 13 mL water beaker containing 650 μCi of FDG (50 μCi/mL), and the number of counts was measured for 25 minutes. To calibrate the βP to the plasma counting system, a 30 μL aliquot of the solution was counted with a coincidence counting system developed at the University of Lausanne (Cibert, 1996). This sampling system detects 511 keV gamma pairs resulting from electron-positron annihilation. Coincidences of full energy events are counted with a preset of time. The coincidence count rate corrected for dead-time and for the detection of random coincidences is used to determine the activity of the sample after calibration with a reference sample of known activity. After data correction for [18F] decay and offset time, calibration factors were calculated between probes and between βP measurements and the coincidence counting system. This calibration was essential for the full quantification used in this study.
Animal preparation
Twenty-four male Sprague-Dawley rats (Charles Rivers Laboratory, L'Arbresle, France) weighing 370 to 400 g were used in this study. Twenty-one rats were used for in vivo βP acquisition, of which five were also used for autoradiography. The remaining three animals were used to study the arterial venous shunt. Animals were anesthetized with a single intraperitoneal injection of urethane (1.4 g/kg body weight dissolved in 0.9% NaCl). All surgical and experimental procedures were in compliance with the Swiss Committee on Animal Care Guidelines (no. 31 1 1016/1949/I).
Polyethylene catheters (i.d. = 0.58 mm, o.d. = 0.96 mm) were inserted into the left femoral vein for radiotracer injection and into the left femoral artery for blood sampling. For experiments with an arteriovenous shunt, additional catheters were inserted in the right femoral vein and artery and directly connected by silicone tubing (a 10-cm loop outside of the rat body) at the start of the experiment. The rats were placed in a stereotaxic apparatus (David Kopf Instruments, Tujunga, California, U.S.A.). The skull was exposed and the bregma point was located. The probes were stereotactically implanted in the right and left frontal cortices and the cerebellum (Paxinos and Watson, 1986). The stereotactic reference was the bregma for lateromedial and anteroposterior coordinates and the dura for dorsoventral coordinates. The coordinates of implantation in millimeters were as follows: left and right frontal cortices A/P 2.5, L/M 3.5, V/M 2; and cerebellum A/P 11, L/M 3, V/M 4. Body temperature was maintained at 37.3 ± 0.4°C by means of a thermostatically controlled heating pad. The PaCO2, PaO2, and pH were determined using a pH/blood gas analyzer (IL1620, Milan, Italy). The mean values ± SD were PaCO2 = 32 ± 2 mm Hg, PaO2 = 83 ± 2 mm Hg, pH = 7.39 ± 0.01. Hematocrit values were also measured several times during the experiment (49.6 ± 0.8%). Plasma glucose concentration was measured at the start of experiment, and after 10, 20, 30, 40, 60, 90, 100, and 120 min, using a Hitachi 917 automate (Roche Diagnostics, Mannheim, Germany) with the Glucose Ecoline 100 kit (1.14891.0001; Merck, Darmstadt, Germany). Experiments were carried out 2 hours after rat anesthesia, when the plasma glucose concentration became stable. Figure 1 shows plasma concentration during the 2-hour experiment. The mean value ± SD was 10.9 ± 0.7 mmol/L.
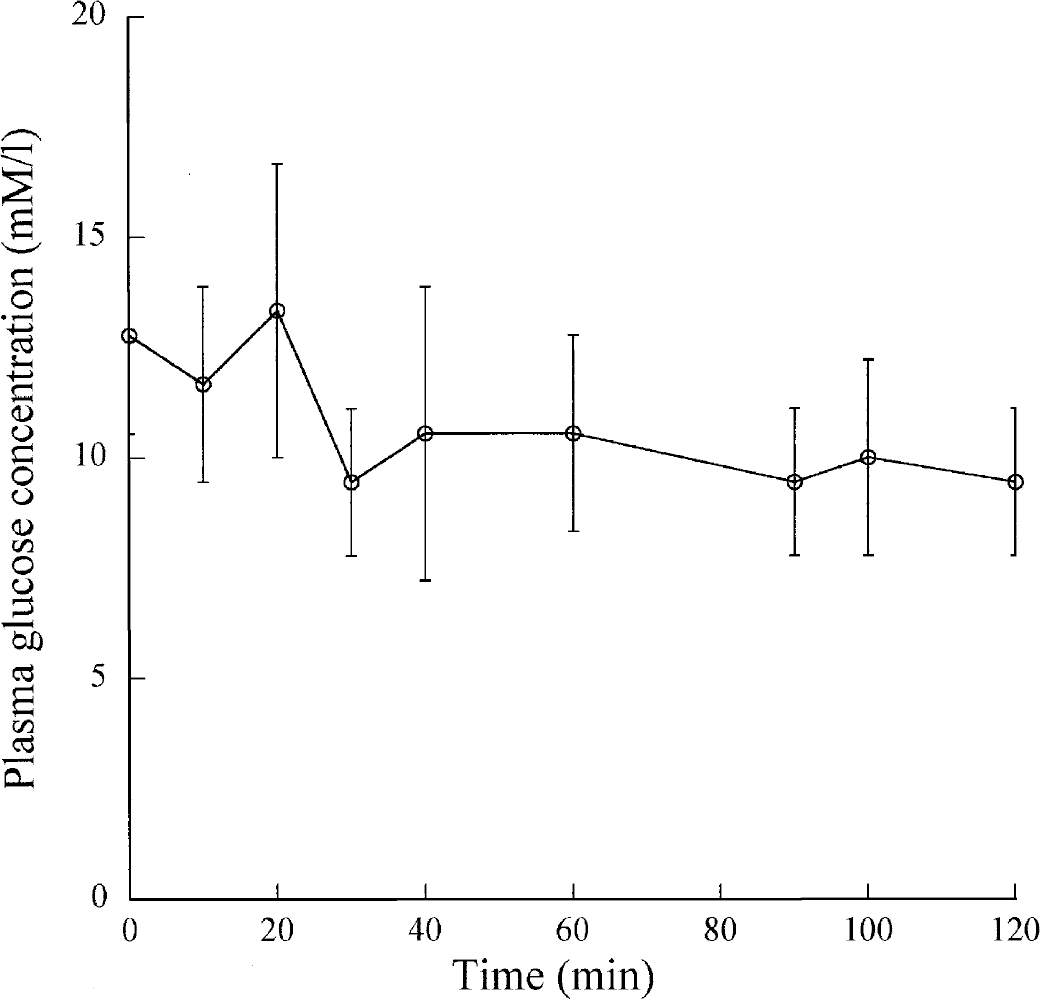
Plasma glucose concentrations measured at regular time intervals during the study period. The values correspond to the mean and standard deviation calculated from 20 rats.
In vivo β-microprobe acquisition
[18F]Fluoro-2-deoxy-
Autoradiography and histology
In five rats, an additional autoradiography experiment was carried out 60 minutes (Fig. 2) after FDG injection. Fifty microcuries of [14C]2-deoxy-
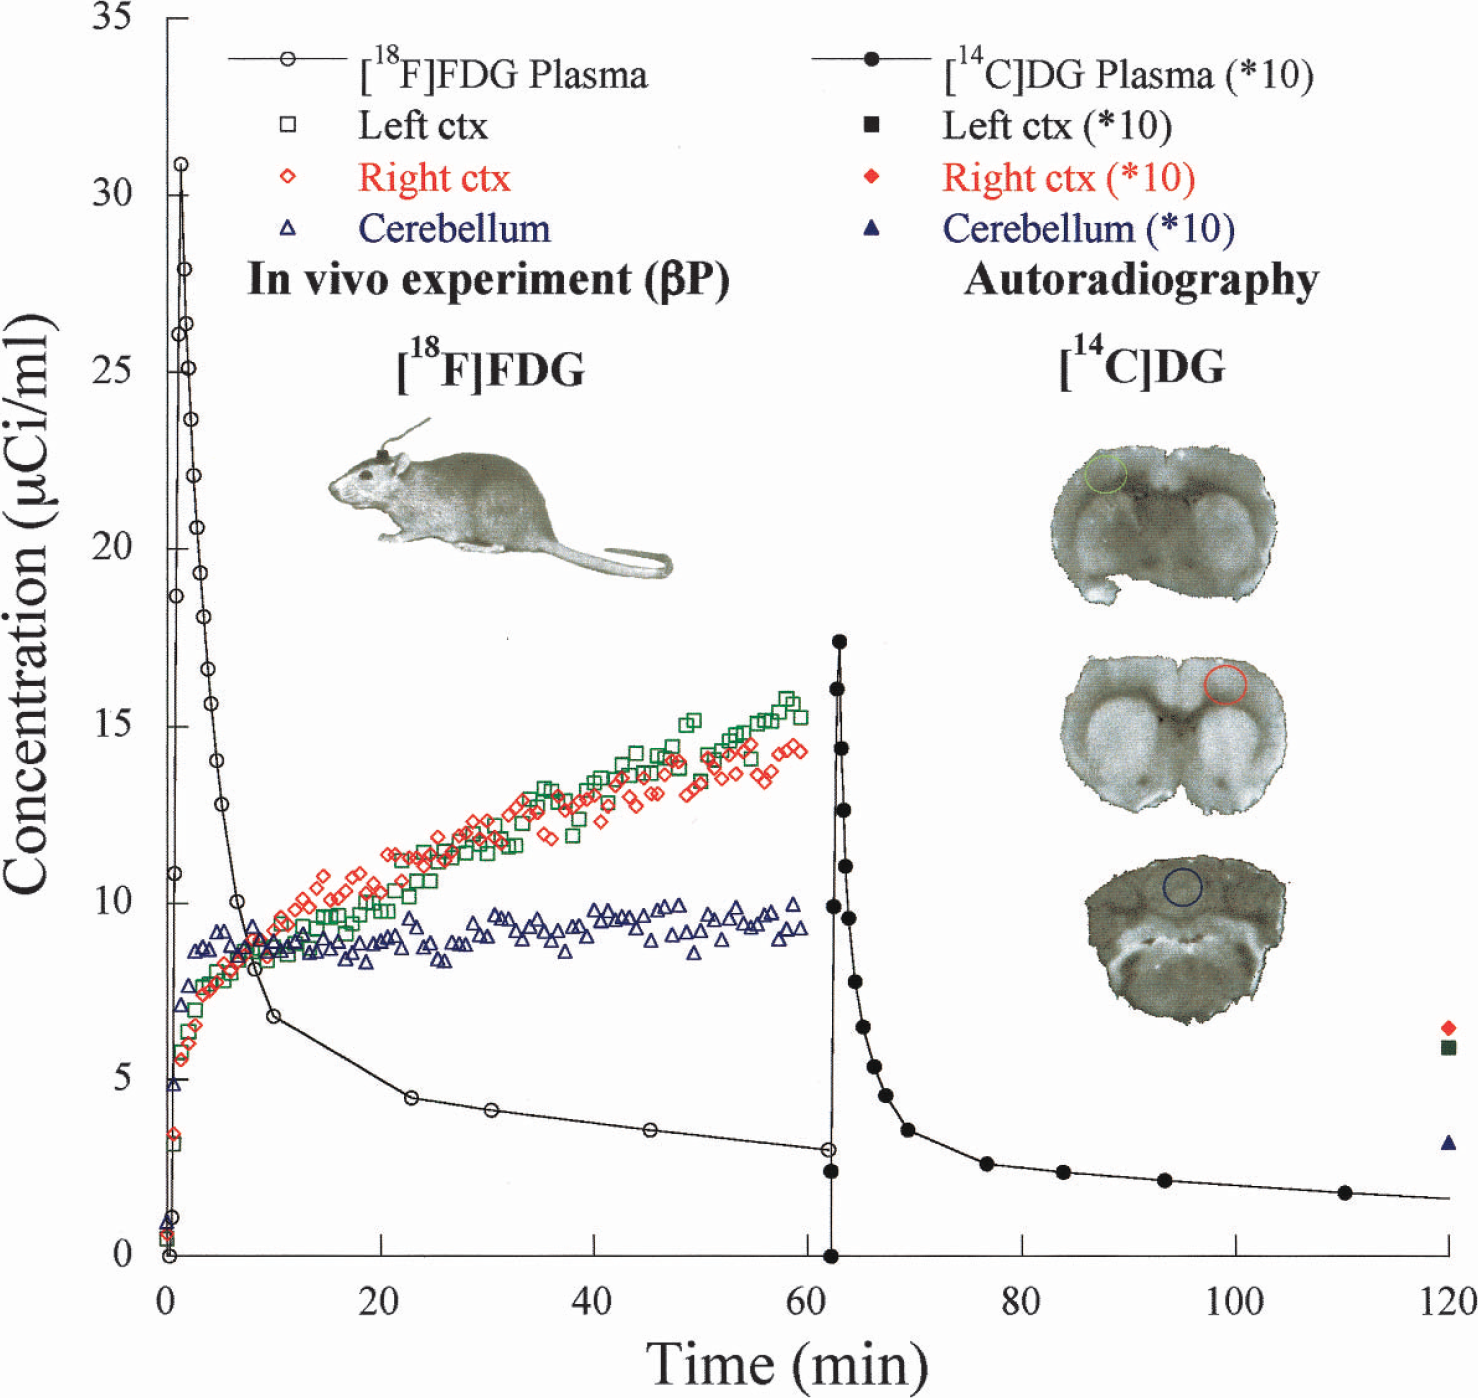
Experimental protocols for β-microprobe (βP) and autoradiography. The first acquisition corresponds to the βP procedure with a single injection of [18F]fluoro-2-deoxy-
All rats were killed by intravenous injection of an overdose of pentobarbital. Each brain was treated for histologic control. A tiny hematoma was observed after microscopic analysis in one rat, and the data from this animal were used to illustrate the effects of disruption of the blood–brain barrier. For this reason, the data analysis was carried out on the remaining 20 rats.
Arterial plasma analysis
For both protocols, 28 arterial blood samples were withdrawn at regular time intervals and all samples were immediately centrifuged during 5 minutes. The plasma 18F and 14C radioactivities were measured using appropriate counting systems. Plasma samples were measured during the experiment for the 18F, and 15 days later for the 14C. After calibration, 18F and 14C plasma time–concentration curves were transformed into microcuries per milliliter.
Arteriovenous shunt
For three rats, we used an arteriovenous shunt to directly measure the time–concentration curve in whole blood, using a 250-μm-diameter, 40-mm-length probe. The probe was protected by a polyethylene catheter and fixed along the shunt. For these experiments, we also measured radioactivities in plasma and whole blood by manual sampling. The βP-derived input function acquired every second was resampled every 2 seconds during the first 2 minutes, every 10 seconds until 10 minutes, and every 20 seconds until the end of the experiment. Delayed blood manual samples were used to transform the βP data into microcuries per milliliter. In addition, we used the time-course ratio between plasma and whole blood (Weber et al., 2002) to obtain the βP time–concentration curve in plasma (plasma/blood = 0.51 exp (–ln2/4.79 t) + 0.3 exp (–ln2/337 t) + 0.8).
Data analysis
We used several methods to calculate rCMRglc values with the βP. A three-compartment model was used to estimate the rate constants, K1, k2, k3, and k4. K1 and k2 represent rate constants for the FDG forward and reverse capillary membrane transport, respectively. The phosphorylation of FDG and dephosphorylation of FDG-6-PO4 are represented by k3 and k4, respectively. The rCMRglc values were calculated using the following equation, rCMRglc = [K1 · k3/(k2+k3)](Cp/LC) = K · (Cp/LC) (Phelps et al., 1979), where Cp is the plasma glucose concentration and LC is the lumped constant, defined as the correction factor used to infer glucose metabolic rate from FDG metabolic rate, and fixed at 0.6 (Lear and Ackermann, 1989). The three-compartment model includes an additional parameter, FV, to take account for vascular fraction during identification procedure (Gjedde, 1995). The methods used to estimate rate constants were as follows.
Method 1: The four rate constants (K1, k2, k3, and k4) were fitted from time–concentration curves with FV fixed at 4%, and K values (K4p) were calculated from these rate constants.
Method 2: The four rate constants (K1, k2, k3, and k4) and Fv were fitted together, and the corresponding K values (K5p) were calculated.
Method 3: The graphical Gjedde-Patlak analysis, which plots the ratio of tissue tracer content/plasma concentration (Cplasma) against
was used to estimate (KPatlak) from the FDG uptake curve during the first 45 minutes (Gjedde, 1982; Patlak et al., 1983). This method, which is model independent, can be used with at least one irreversible compartment (k4 = 0), and assumes that all reversible compartments must be in equilibrium with plasma. At equilibrium, the Gjedde-Patlak plot becomes linear. The slope of the linear phase represents the net transfer rate, K, and the intercept on the y-axis of plot is the apparent distribution volume.
For each method, the estimated values obtained from 20 rats were averaged.
The autoradiographic [14C] images were transformed into CMRglc images as described previously (Huang et al., 1980; Phelps et al., 1979), with a value of 0.48 for the DG lumped constant (Schmidt et al., 1989; Sokoloff et al., 1977). Three sets of rate constants were used to calculate CMRglc: the individual rate constants estimated for each rat with βP from the first 60 minutes; the standard rate constants defined by Sokoloff (K1 = 0.189, k2 = 0.245; k3 = 0.052; k4 = 0); and the averaged rate constants defined by Schmidt (K1 = 0.197, k2 = 0.179; k3 = 0.049; k4 = 0.0025) (Schmidt et al., 1989).
The influence of acquisition time on model parameter estimates was studied by shortening the time duration of the acquired kinetic curves, from 120 to 60 minutes. The identifiability of output parameters was estimated using the coefficient of variation (estimated value/standard error) expressed in percent. We used an approximation of covariance matrix to estimate the standard error (Carson, 1986). The stability was evaluated by comparing fitted values for each acquisition length with those obtained with 120 minutes acquisition time.
RESULTS
βP measurements
Using one study, we calculated the influence of scquisition time on the K1-k4 parameters estimated alone (method 1) and together with the vascular fraction (method 2) (Fig. 3). All model parameters (K1-k4, FV) reached constant values after 80 minutes of acquisition with coefficients of variation less than 30%. However, the resulting K values remained very stable, with variations less than 7% at 60 minutes of acquisition time with methods 1 and 2. K1 and k2 were more affected than k3 and k4 by the value of the vascular fraction obtained by fit, and there was a large decrease of K1 and k2 when Fv was fitted (Fig. 3).
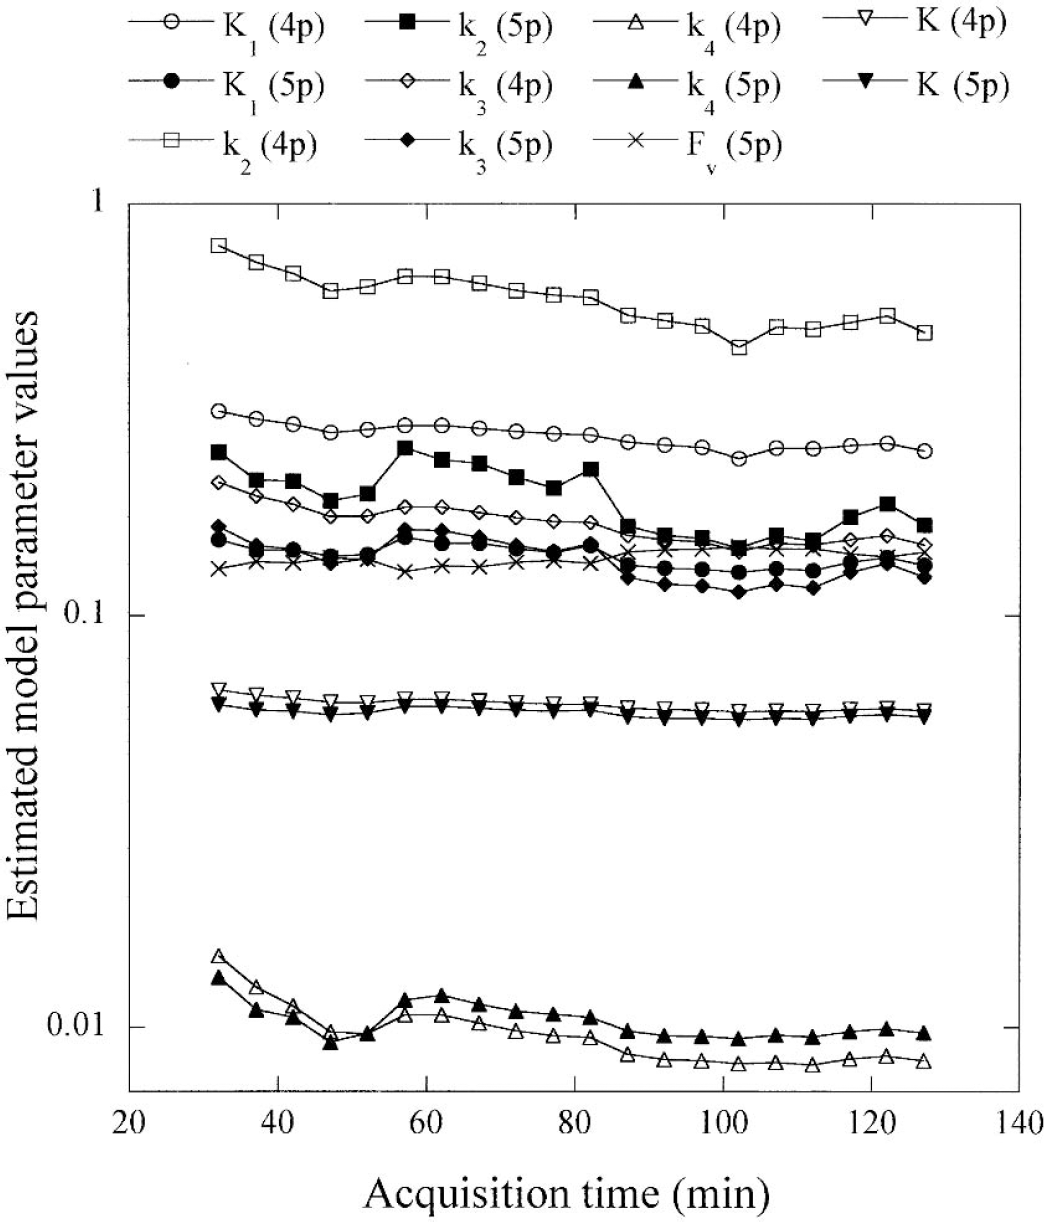
Influence of length of experimental period on parameter estimates. A three-compartment model was used to estimate four parameters (K1-k4) from varying experimental periods after tracer injection (open symbols, 4p). Fv and K1-k4 were then estimated together (filled symbols, 5p). The y-axis is presented using a logarithmic scale.
The average kinetic parameters are shown in Table 1, and examples of βP time–concentration curves and model simulations for one rat are illustrated in Figure 4. Using method 1, four parameters (K1-k4) were estimated from 60 minutes of experiment, but, in some regions of the brain, large standard errors were obtained during the fitting process. Better fits were obtained with method 2, where the Fv was estimated simultaneously with K1-k4 parameters (Figure 4, Table 1). Using method 2, the K5p values were slightly lower than those obtained using method 1, but they had a lower estimated standard error (Table 1). The mean estimated Fv values were about 5.5% for the frontal cortex regions and about 8.0% for the cerebellum.
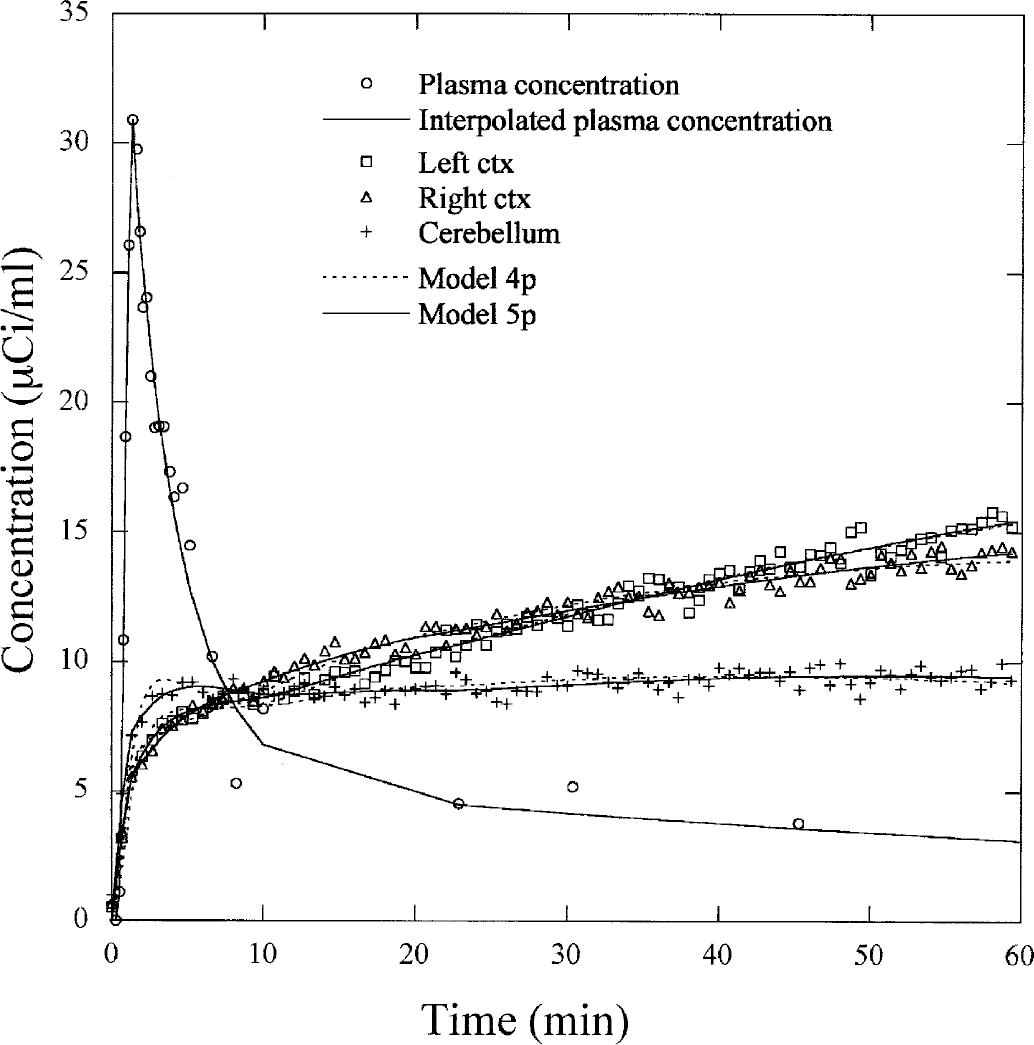
β-Microprobe time–concentration curves measured in three brain regions of one rat. Different model configurations with four (4p) and five (5p) parameters were used to fit the kinetic data. The open circles show the plasma time–concentration curve determined from manual sampling. The plasma concentration interpolated from peak with a biexponential is used as the input function of the model.
Model parameters estimated using a three-compartment model and a Patlak graphical method from 20 rats
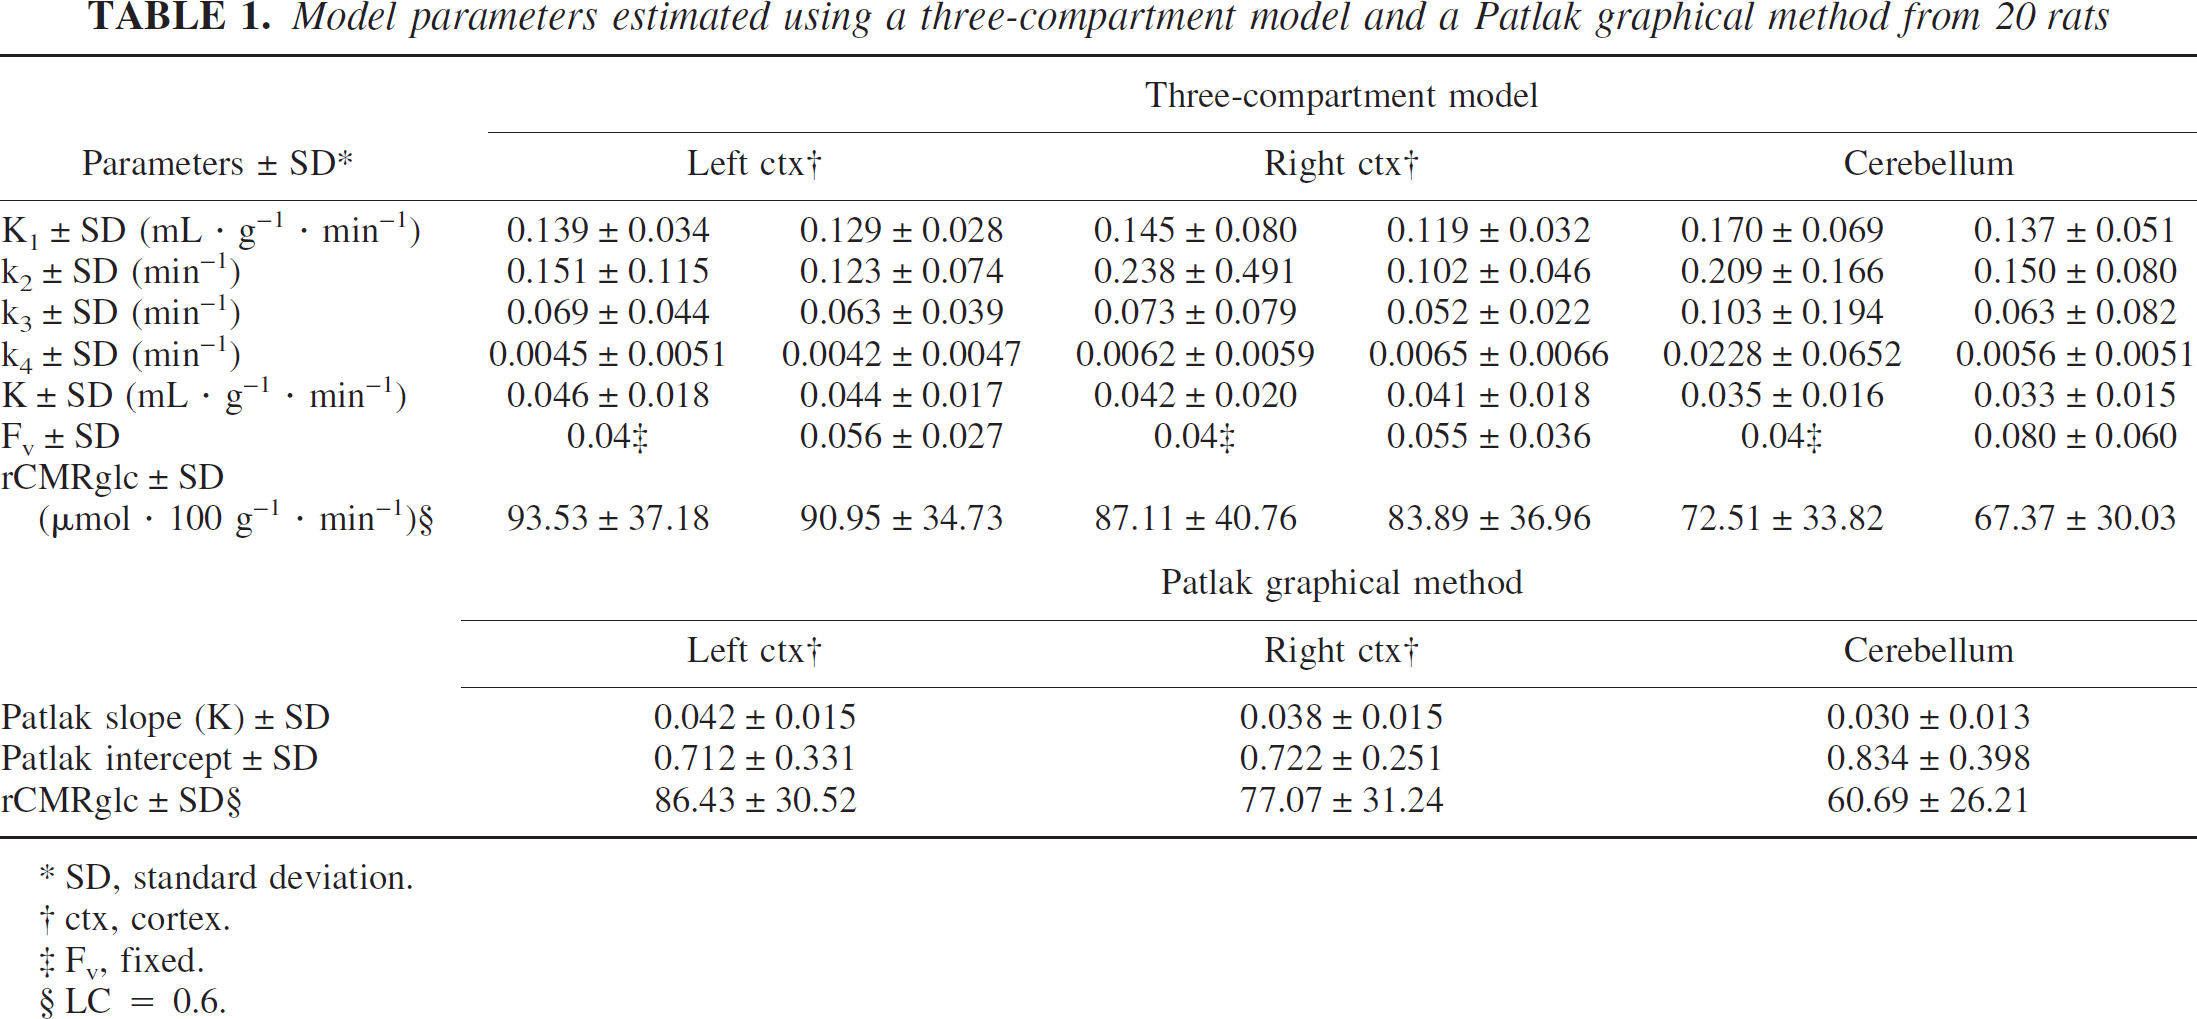
SD, standard deviation.
ctx, cortex.
Fv, fixed.
LC = 0.6.
There were high correlations between K values calculated from methods 1 and 2, despite some values in which method 1 led to bad fits (Fig. 5A). For these values, fits were improved using method 2, with high estimated Fv values (>13%). Using method 3, better correlations were found between KPatlak and K5p values (r = 0.969) than between KPatlak and K4p values (r = 0.945) (Fig. 5B). The intercept values obtained with the method 3 were larger in the cerebellum than in the cortical region.
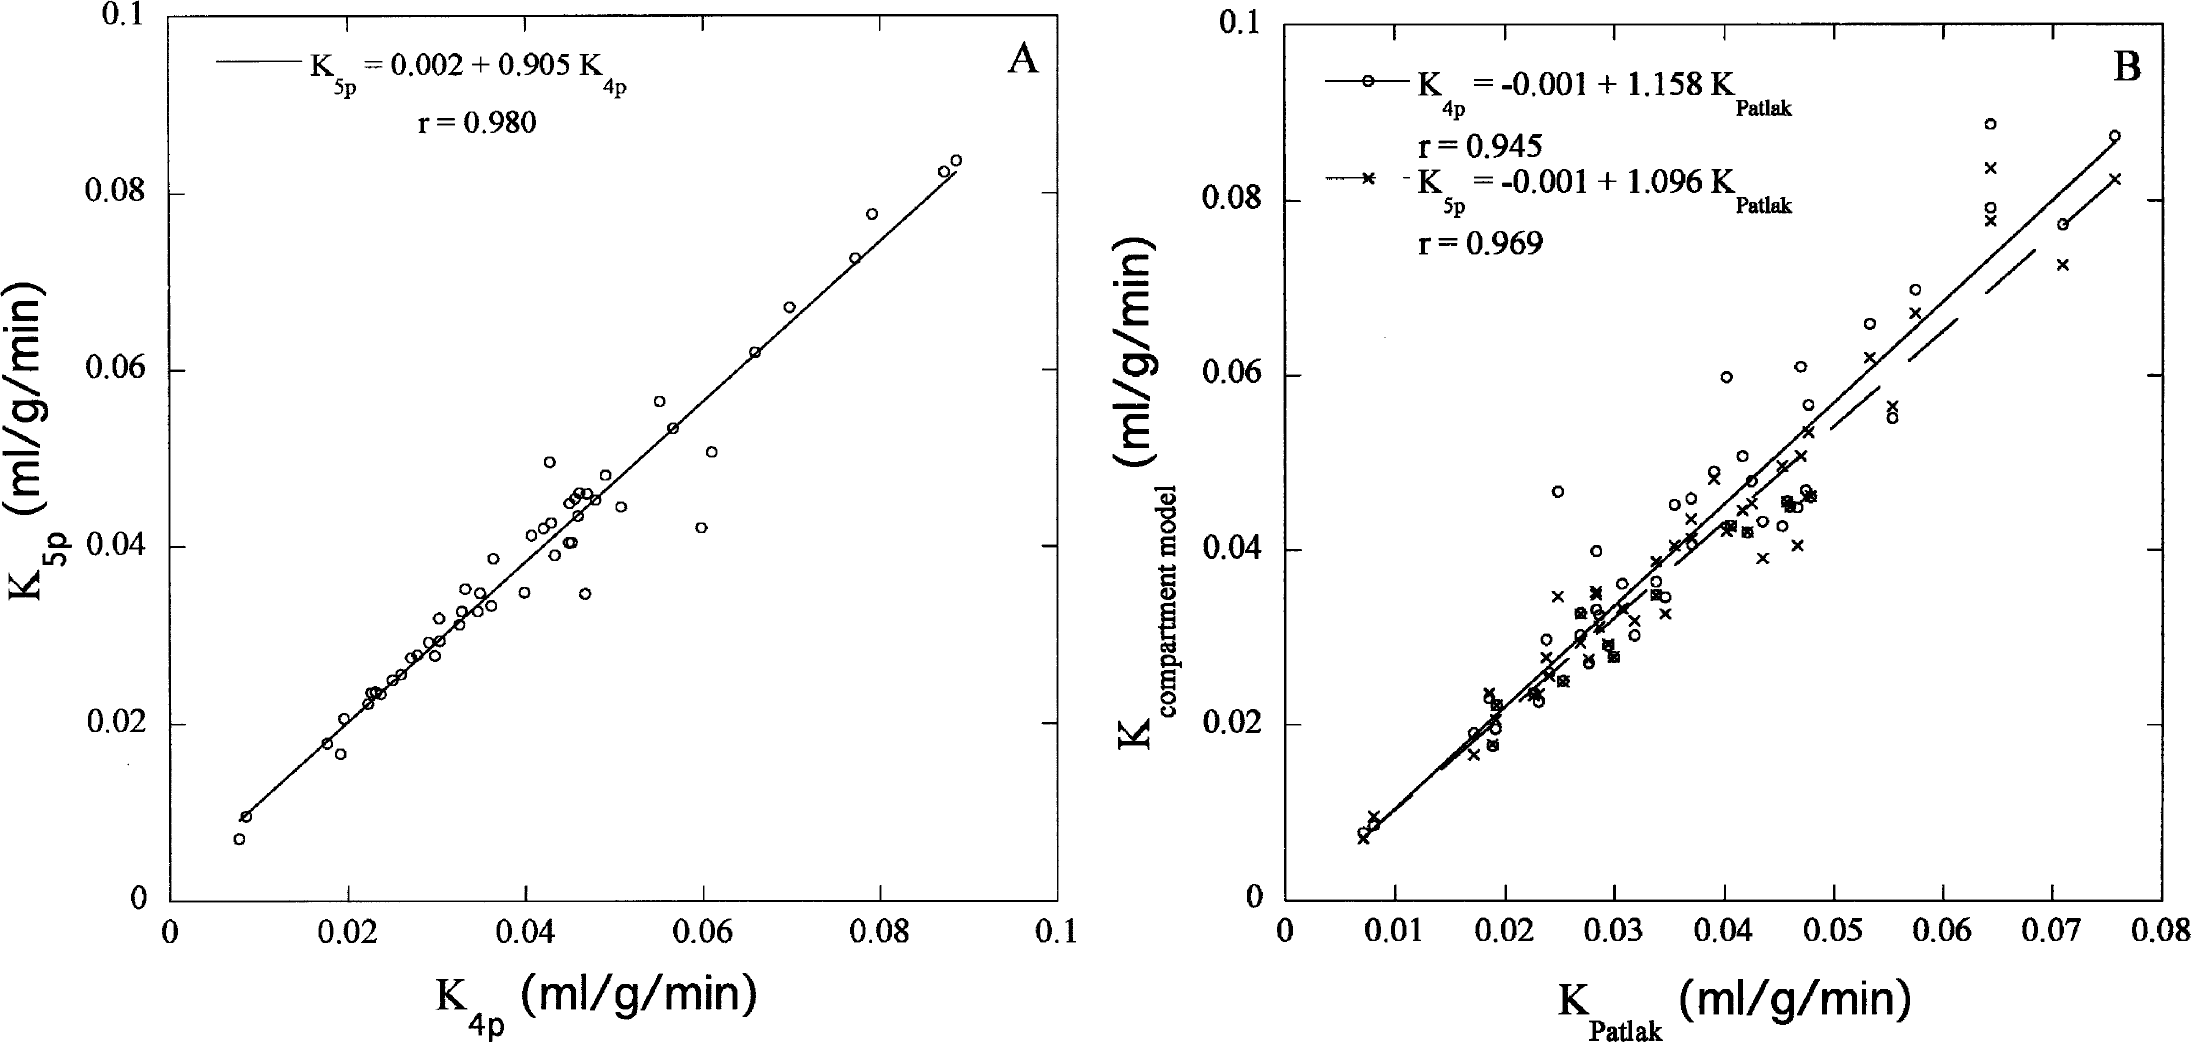
(A) K values were calculated with methods 1 and 2. The vascular fraction was fixed to 4% (K4p) or estimated (K5p).
In one rat, a frontal cortex hematoma was produced during the probe implantation (Fig. 6A). For this animal, the acquired time–concentration curve was normal in the cerebellum but largely overestimated, with a constant offset, in the frontal cortex (Fig. 6B). Table 2 shows the estimated model parameters from the time–concentration curve, with Fv being fitted or fixed at 4%. Although we obtained a better fit using method 2 than method 1, the K1/k2 ratio remained very high.
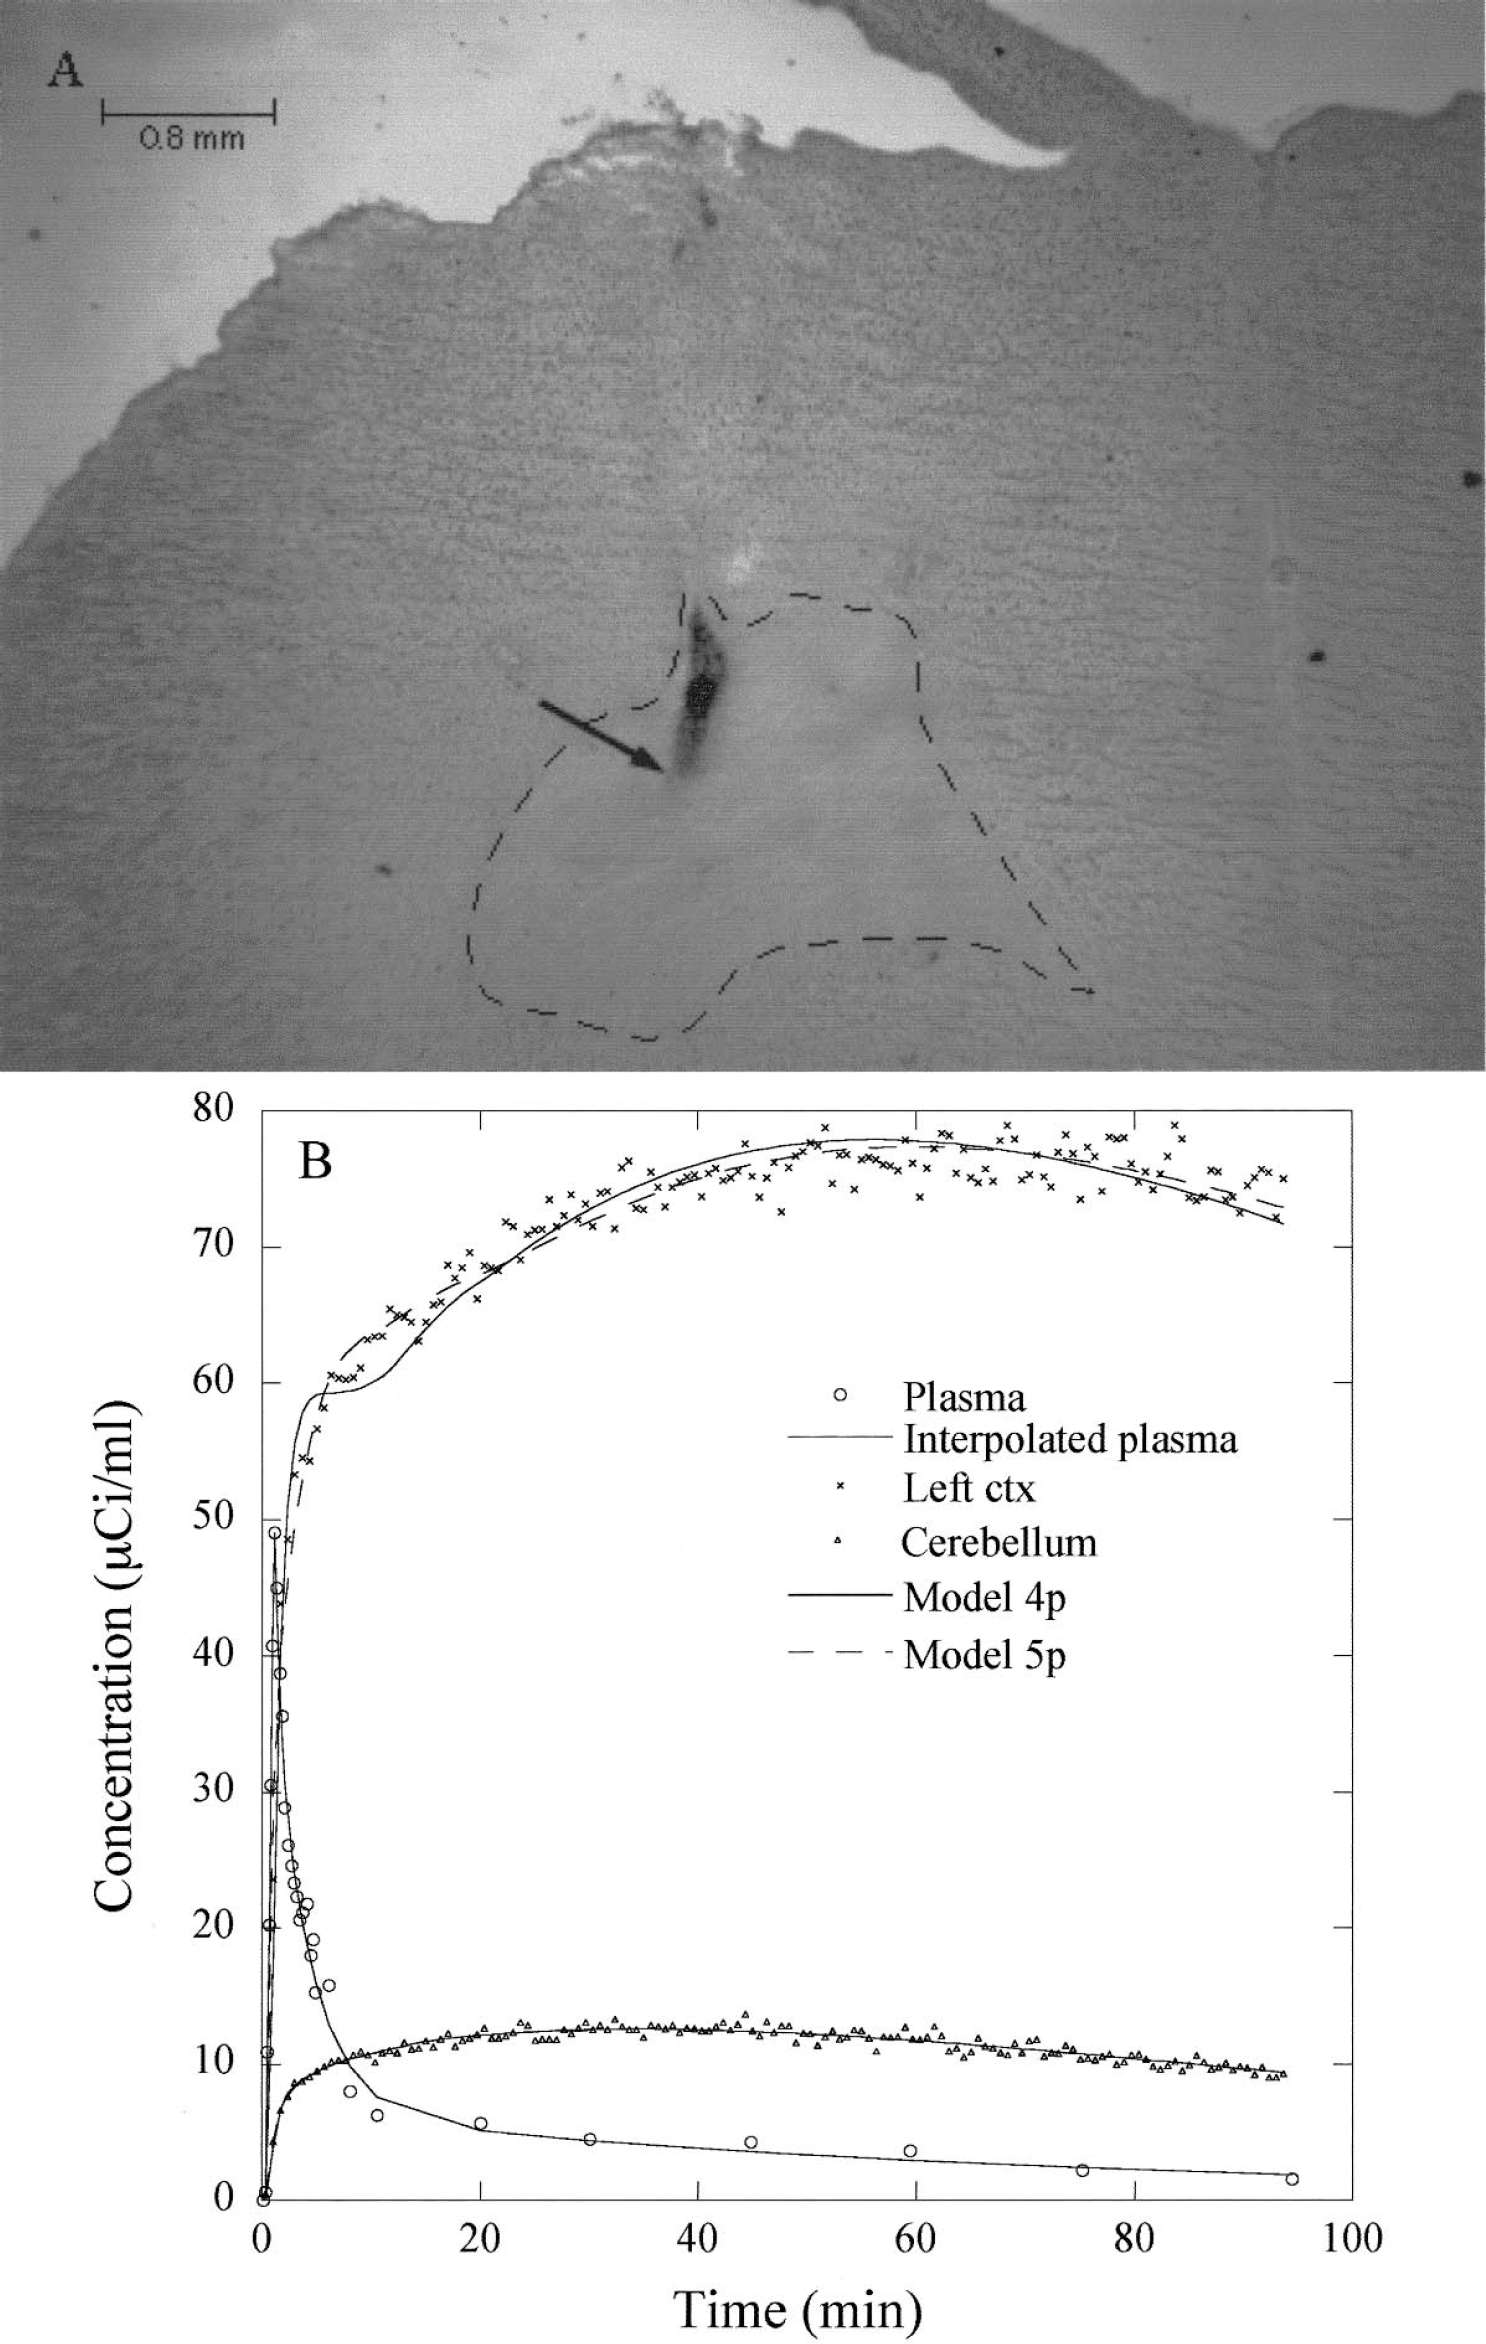
(A) Left frontal cortex hematoma produced during the probe implantation. The long-dashed line corresponds to an edema produced by the hematoma.
Estimated model parameters in frontal cortex hematoma and cerebellum
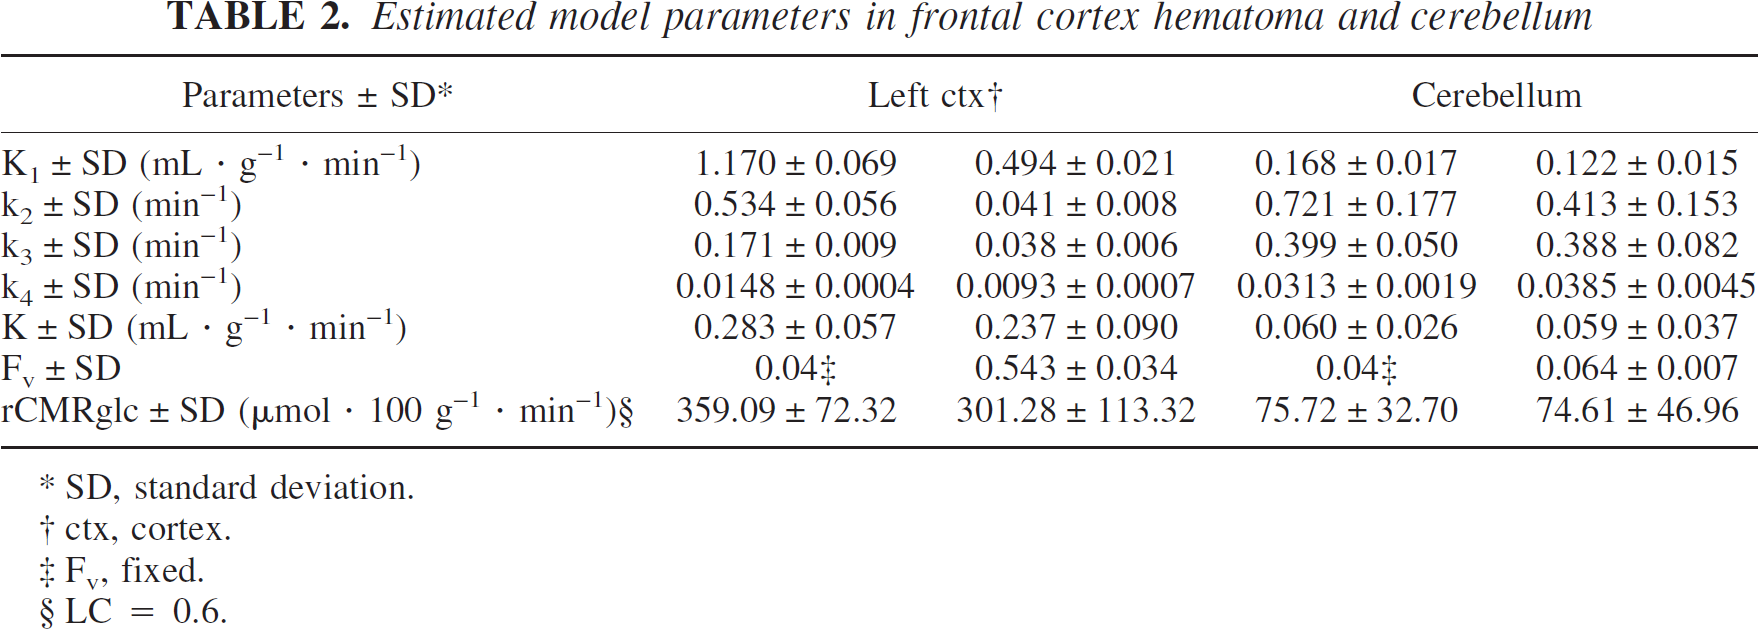
SD, standard deviation.
ctx, cortex.
Fv, fixed.
LC = 0.6.
Direct comparison with autoradiography
When we compared rCMRglc values measured by βP and autoradiography, we observed high correlations between these in vivo and ex vivo methods, with correlation coefficients larger than 0.830 (Fig. 7, Table 3). The [14C]DG values were slightly lower than the values obtained with the βP, with the magnitude of the difference dependent on the model parameters fixed in the equation of Phelps to calculate [14C]DG values (Table 3).
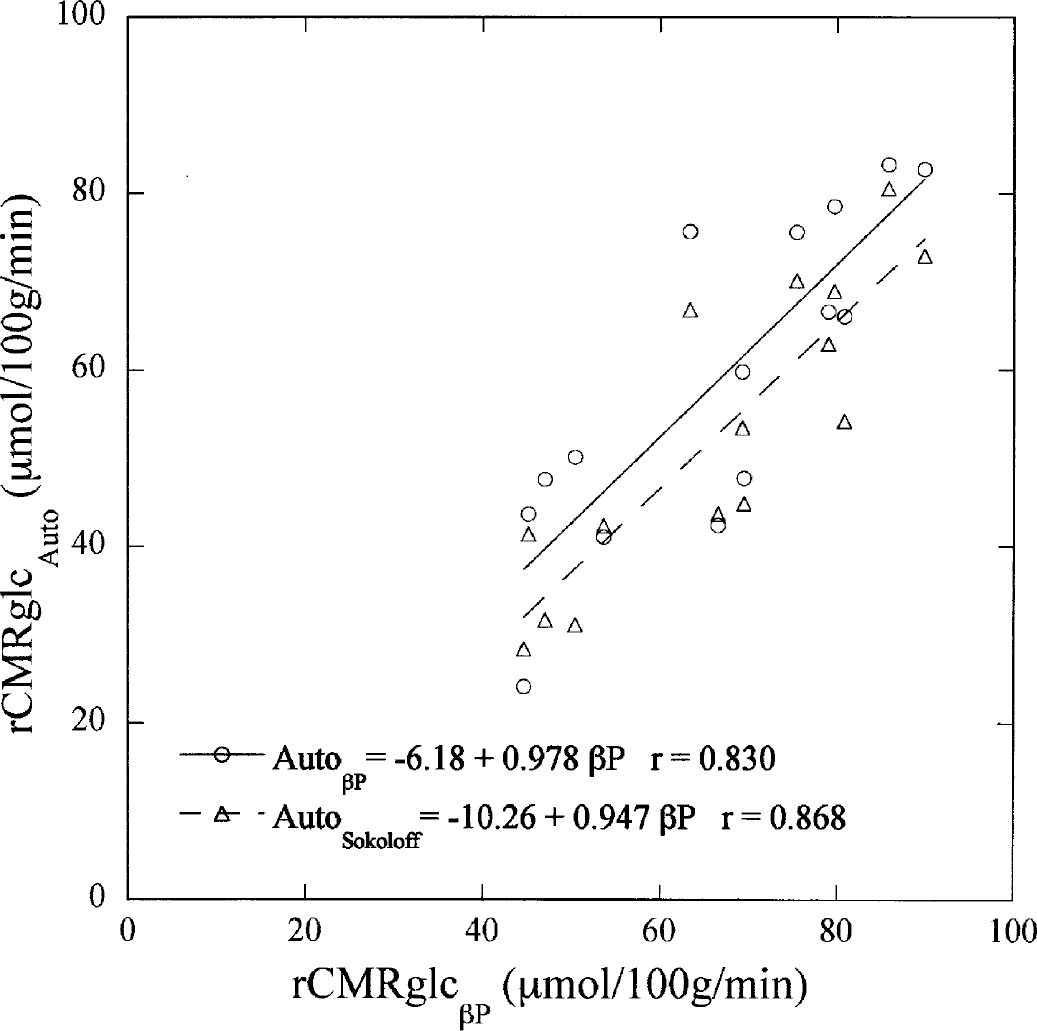
Direct comparison in five rats between regional cerebral metabolic rates for glucose (rCMRglc) values obtained from β-microprobe (βP) and from autoradiography, rCMRglcβP and rCMRglcAuto, respectively. Parameters obtained by Sokoloff (AutoSokoloff) and those obtained with the βP (AutoβP) were used in Phelps's equation to calculate rCMRglc values.
[18F]FDG and [14C]DG model parameters estimated using a three-compartment model and a Patlak graphical method from 5 rats
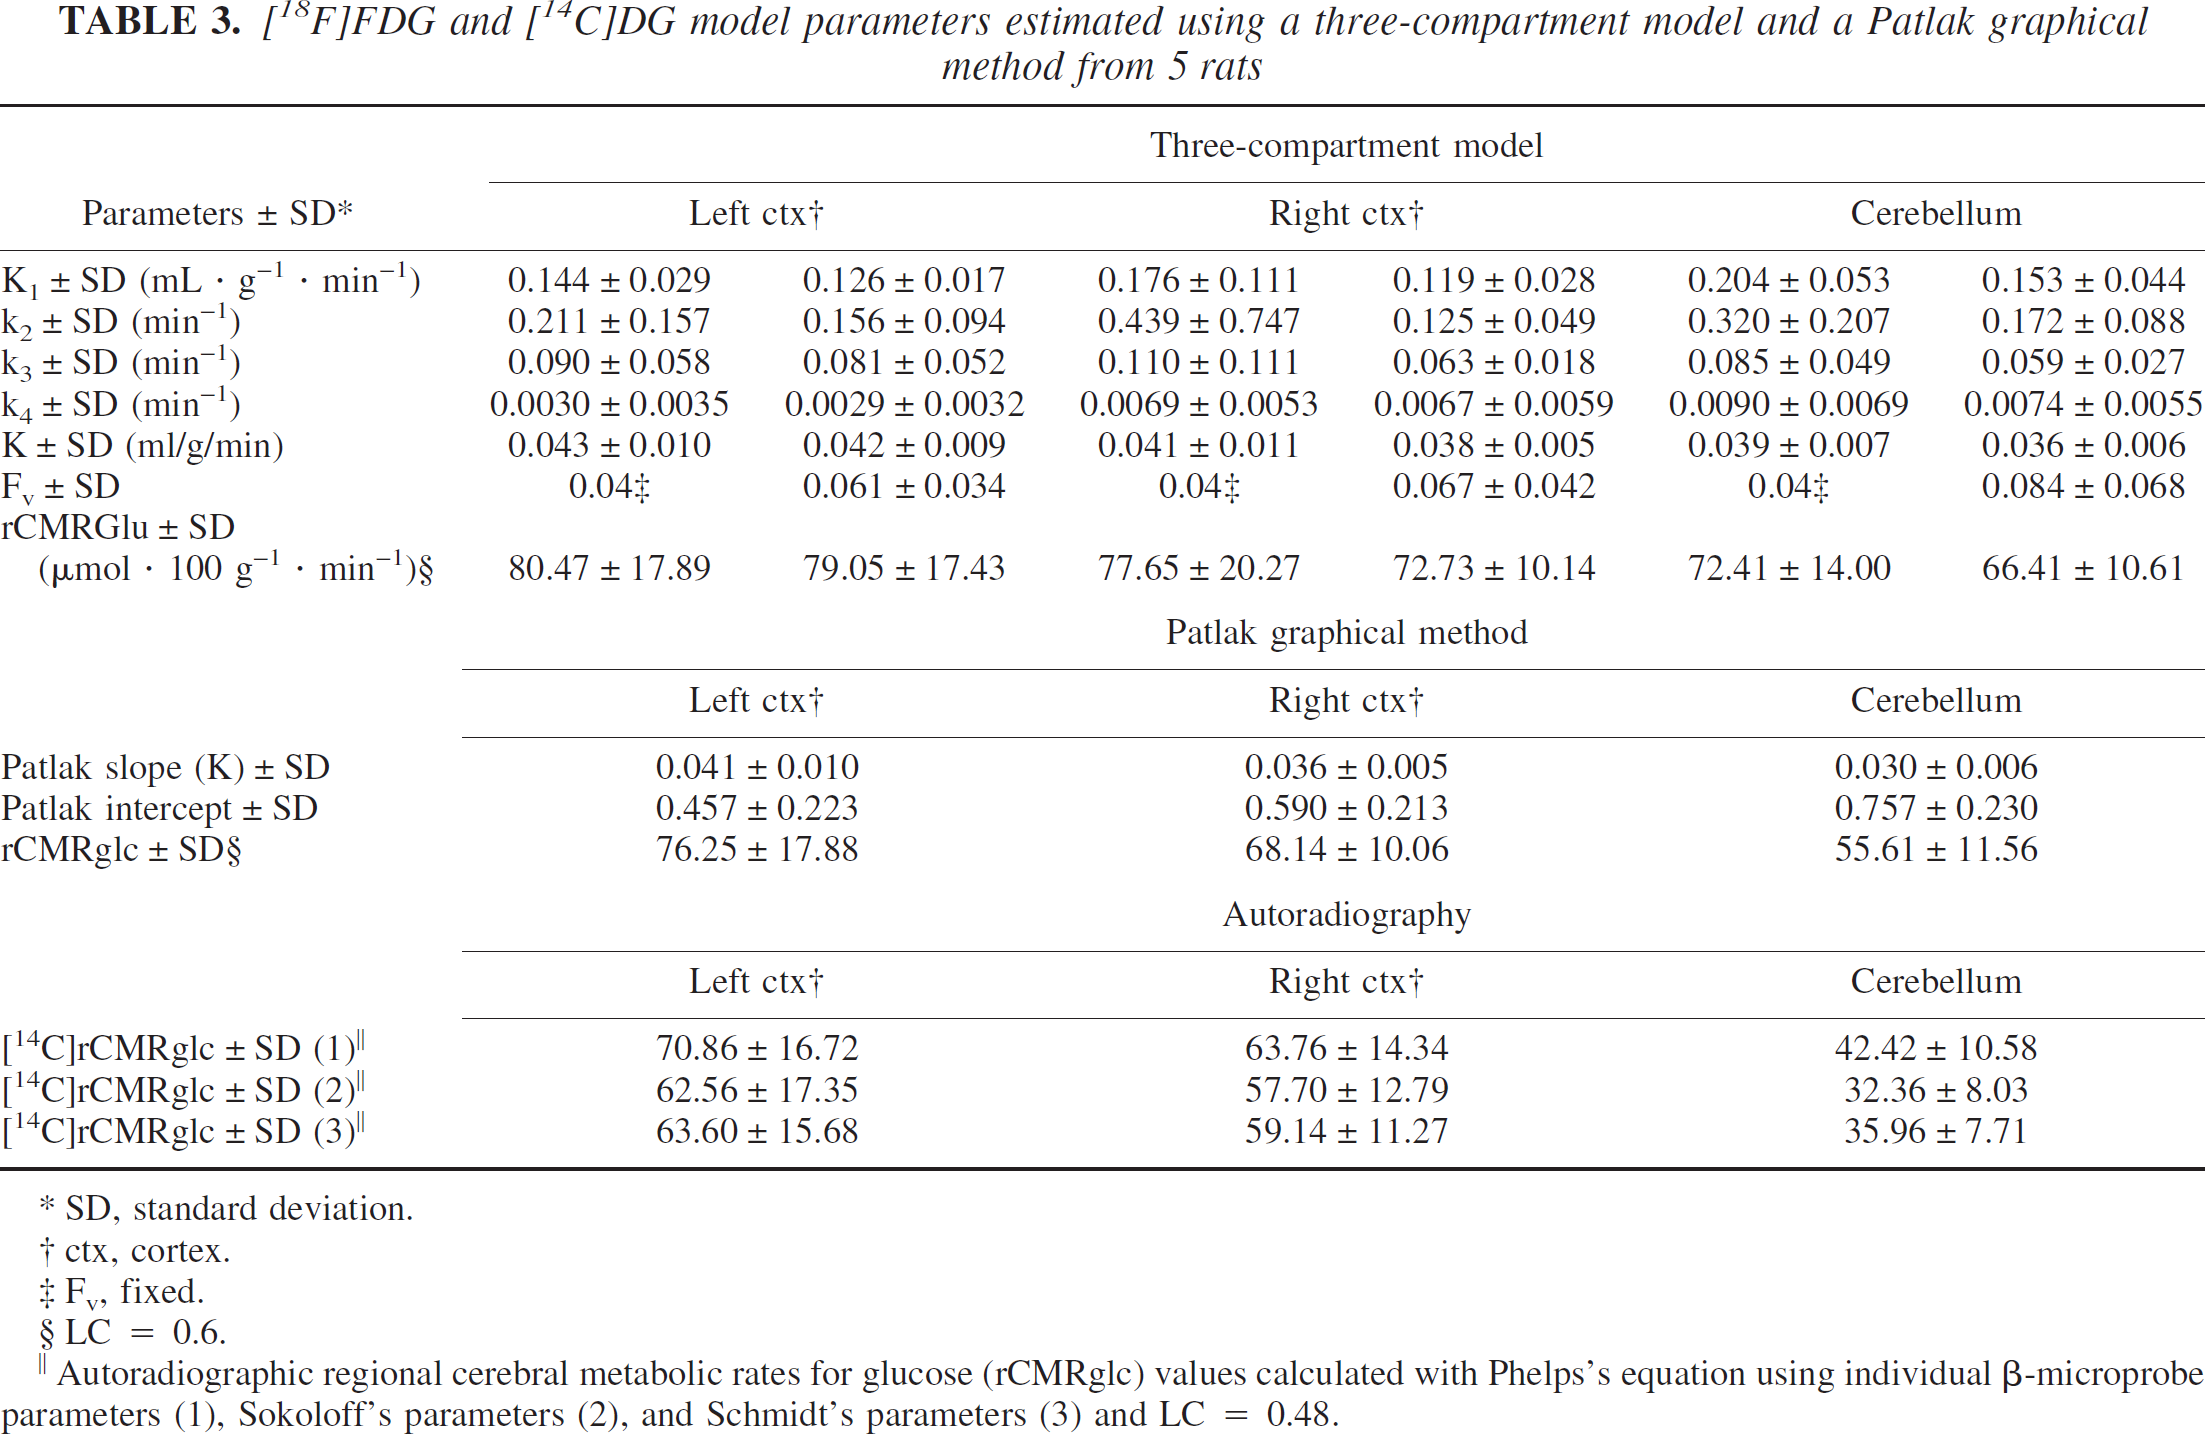
SD, standard deviation.
ctx, cortex.
Fv, fixed.
LC = 0.6.
Autoradiographic regional cerebral metabolic rates for glucose (rCMRglc) values calculated with Phelps's equation using individual β-microprobe parameters (1), Sokoloff's parameters (2), and Schmidt's parameters (3) and LC = 0.48.
β-Microprobe-derived input function
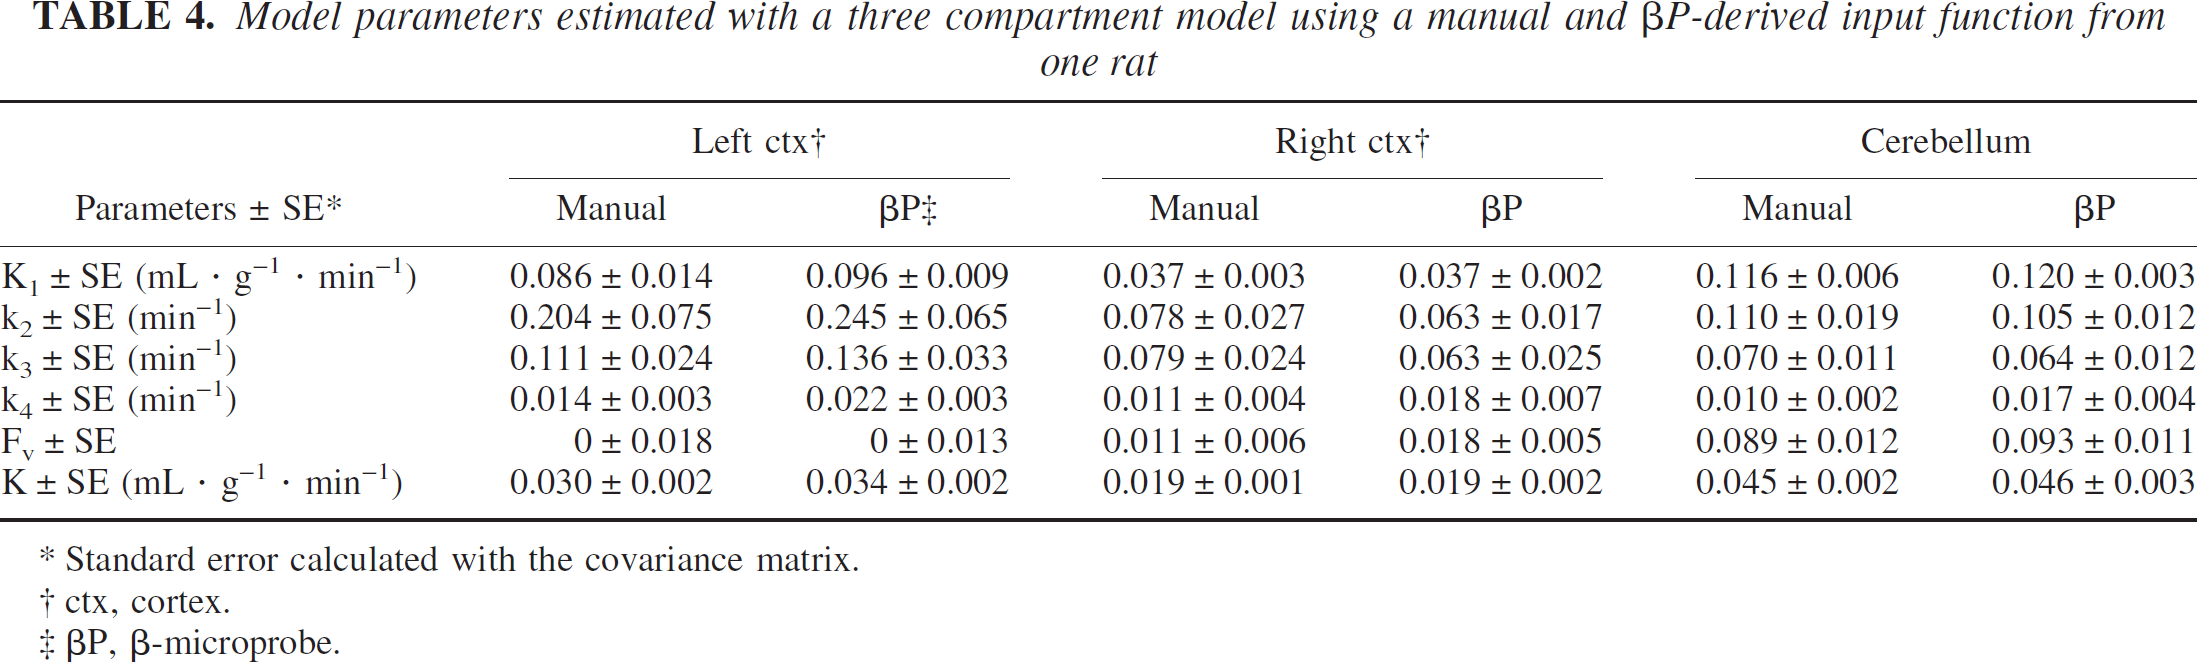
The ratio of plasma radioactivity/whole blood radioactivity decreased rapidly during the first 10 minutes, reaching a constant value of about 1.1, in good agreement with previous results (Weber et al., 2002). βP-derived input functions and those obtained by manual sampling were similar (e.g., Fig. 8). The whole blood input function was directly measured by βP, whereas the plasma input function was deduced using the plasma/whole blood ratio. Table 4 shows the estimated model parameters obtained using both manual and βP-derived input functions for the three regions of the brain.
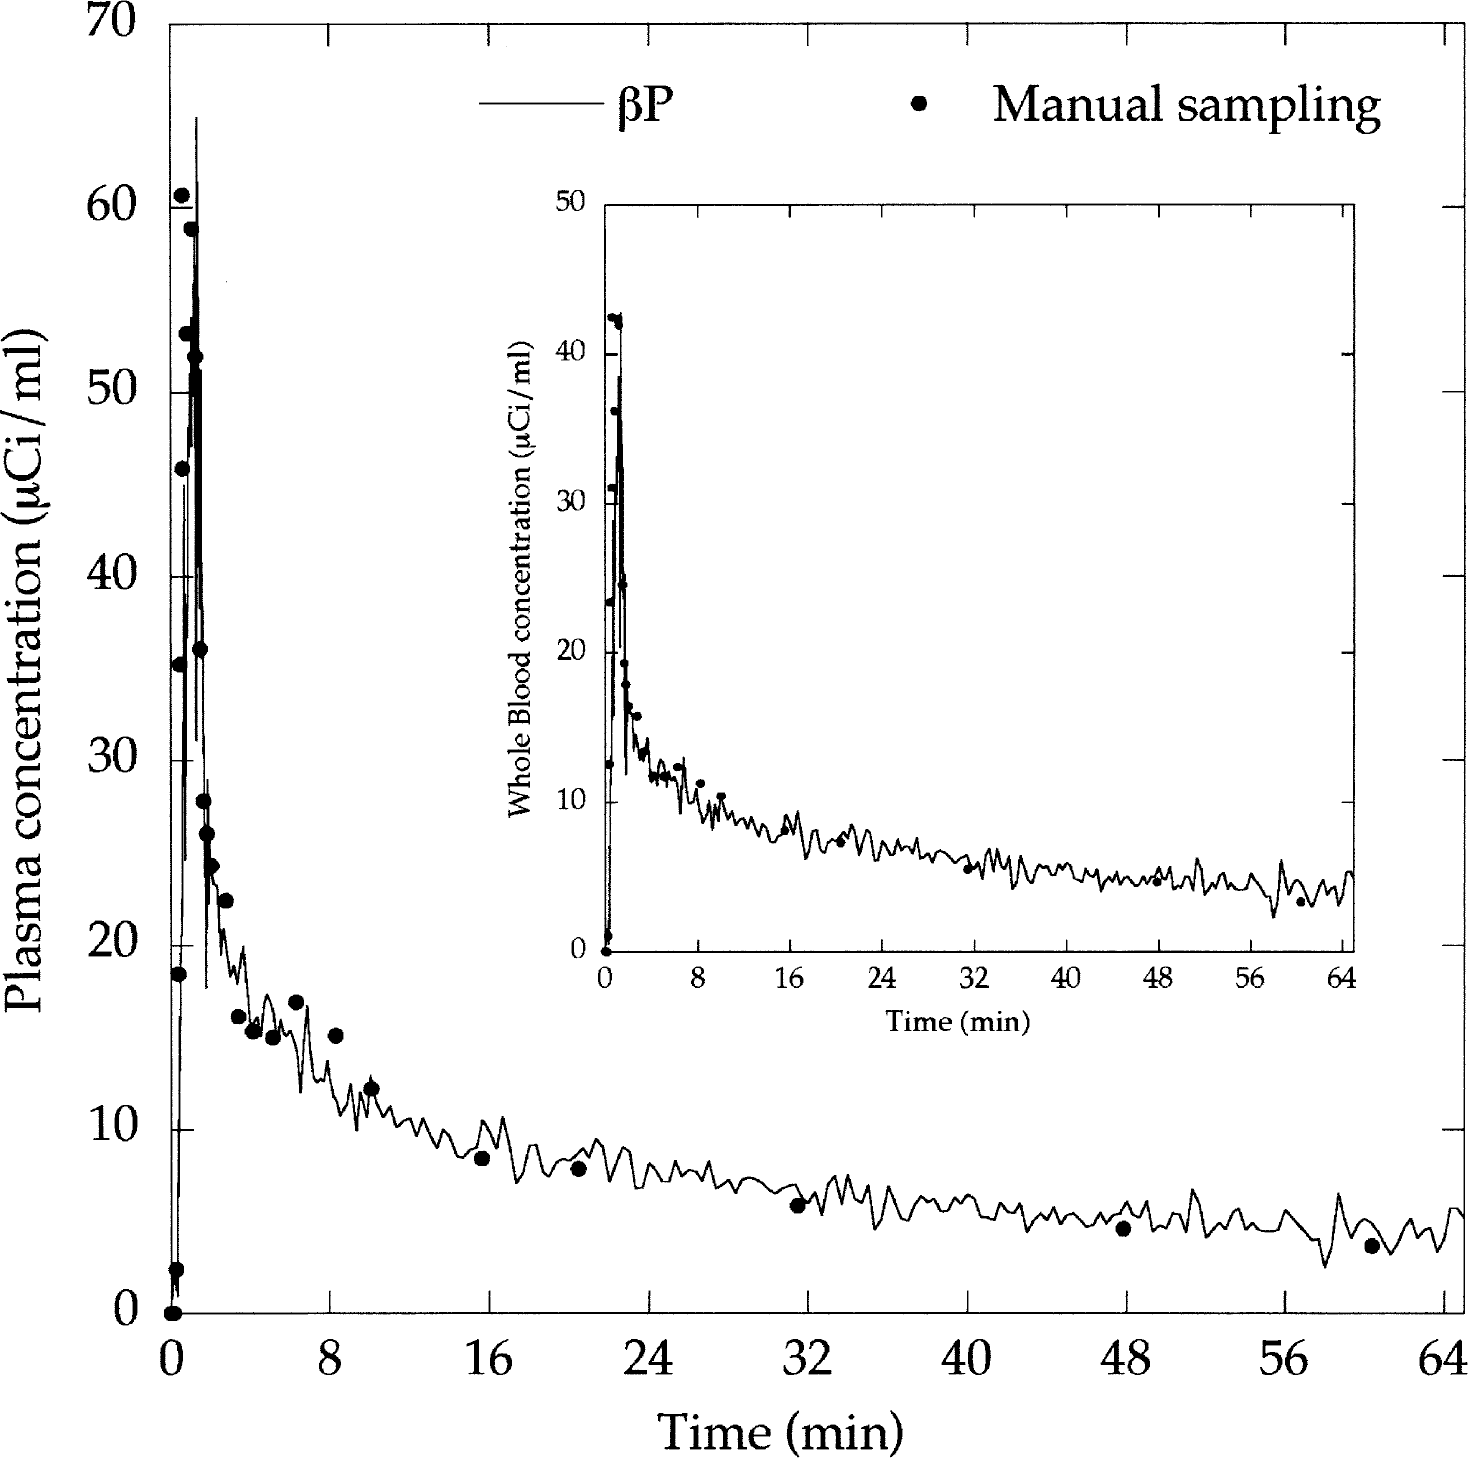
Time–concentration curves measured in whole blood by manual sampling and a probe coupled to an arteriovenous shunt (inset). Time course in plasma was calculated from the ratio described in Methods. The deviant point observed in the upslope is explained by a data variability of the manual sampling measurements.
Model parameters estimated with a three compartment model using a manual and βP-derived input function from one rat
Standard error calculated with the covariance matrix.
ctx, cortex.
βP, β-microprobe.
DISCUSSION
Using FDG and the recently developed βP device, which assays the local concentrations of a PET radio tracer in the brains of small animals, we have measured glucose consumption in the rat brain. Because of the invasiveness of this technique, the measurements can be distorted, and we thought it worthwhile to determine the consistency of the βP measurements and to correlate them with those obtained by autoradiography. After urethane anesthetization, the rats became hyperglycemic, stabilizing after about 60 minutes and remaining stable during the whole experiment (Sanchez-Pozo et al., 1988). Because of the length of the experimental procedure, and in order to get stable physiologic constants, we started the acquisition 2 hours after anesthesia. We observed slightly higher averaged values of plasma glucose concentration at the beginning of the experiment, essentially because of interindividual variability. However, the higher plasma glucose concentration did not seem to influence the calculated K values because there was no correlation between both parameters.
Using either method 1 or method 2 to estimate the rate constants from the 2-hour kinetic curves, we found that the fitted parameter values were acceptable after 60 minutes. The optimal experimental period has been reported to be 30 to 45 minutes after injection, at which time the product loss is negligible (k4 = 0) and the rate constants have small influence (Mori et al., 1990). Because of the duration of the experiments in our study, we included the rate of hydrolysis of FDG-6-PO4 to FDG. Using method 2, in which FV was estimated together with the four rate constants, we obtained better fits with lower standard error for each parameter. In addition, the results obtained with method 2 were in good agreement with those obtained with the Patlak method (method 3), a graphic approach that does not estimate directly vascular fraction. We found that estimation of Fv was necessary to process βP data. That is, if the vascular fraction was high in the measured region, aberrant kinetic parameter values were obtained when Fv was fixed at 4%. In contrast, this was corrected when Fv was estimated together with the other parameters. The benefits of Fv estimation are particularly important in the cerebellum, a highly vascularized region where Fv values are high.
These results are in agreement with previous studies showing the importance of the vascular fraction. For example, estimation of the vascular fraction was of prime importance in reducing errors in rate constants (Lammertsma et al., 1987). Moreover, the vascular fraction has been found to range from 0.023 to 0.084 in the rat brain, depending on the region of the brain assayed (Weiss et al., 1982).
Although not frequently observed, a hematoma can be a complication of probe implantation. The disruption of the blood–brain barrier can produce a distortion of the tracer kinetics and, as shown in this study, give aberrant K1 and k2 values. The resulting time–concentration curve can be interpreted as a constant offset added to the biologic response. This constant offset can be due to a rapid, irreversible uptake during injection. Fitting of the vascular fraction does not solve the problem, because the compartment model is not adapted to this abnormal process. These results indicate that a histologic control has to be performed for each experiment, not only to ensure the correct implantation of the probe, but to exclude the presence of a hematoma. Our use of 0.5-mm-diameter probes, in comparison to the 1-mm-diameter probes used by Pain et al. (Pain et al., 2002), may explain the variability of the βP measurements, because a larger probe can be more invasive than a smaller probe.
Measurement of input function is of prime importance in analyzing βP data, as demonstrated here. The usual method of assessing input function, however, requires multiple blood samples, which can endanger the life of the animal. Using an arteriovenous shunt (Weber et al., 2002), we showed it was possible to directly measure the time–concentration curve of whole blood by means of a probe fixed along of an external loop. This device avoids spillover perturbation provided from muscles or organs near arteries. Corrected plasma counts can then be obtained from the time course of the plasma/whole blood radioactivity ratio (Weber et al., 2002). We found that the calculated plasma concentration curves were very close to those obtained manually, and that only delayed activity in plasma has to be measured to calibrate βP data. Thus, use of an arteriovenous shunt with the βP should avoid having to sample blood manually.
We obtained rCMRglc values in accordance with those published by Sokoloff (Sokoloff et al., 1977). The rCMRglc values measured include several additional factors, such as the arterial glucose concentration and the lumped constant. Some of these factors can vary with experimental conditions, such as anesthesia and temperature.
We showed a very high correlation between values obtained by in vivo βP and those obtained by autoradiography. Different sets of rate constants have been fixed for rCMRglc calculation, including the standard parameters estimated by Sokoloff (Sokoloff et al., 1977); Schmidt values, including the k4 parameters (Schmidt et al., 1989); and the βP values obtained during the first phase of the experiment. Depending on the fixed values in the equation, we found that autoradiographic rCMRglc values were underestimated. When we used the individual βP values, however, the correlation was close to unity.
In this study, we have shown that the βP is a very promising tool to study time–concentration curves of [18F]DG under different experimental conditions. Because of its lower cost and high temporal and spatial resolution, this method can be used in animals to test a variety of experimental protocols for further human PET studies.
Footnotes
Abbreviations used
Acknowledgments:
We thank H. Henry and O. Braissant for glucose assays at the central Laboratory of clinical Chemistry, CHUV, Lausanne, Switzerland.