
Abstract
Cerebrovascular reserve (CVR) and oxygen extraction fraction (OEF) are used to identify hemodynamic compromise in symptomatic patients with carotid occlusive vascular disease, but evidence suggests that they are not equivalent. The authors studied the relationship between CVR and OEF to evaluate their equivalence and stages of hemodynamic compromise. Symptomatic patients (N = 12) with carotid occlusion were studied by stable xenon–computed tomography CBF after intravenous acetazolamide administration for CVR, followed within 24 hours by positron emission tomography (PET) for OEF. Middle cerebral artery territories were analyzed by hemisphere and level. Hemispheric subcortical white matter infarctions were graded with magnetic resonance imaging. Both hemispheric and level analysis of CVR and OEF showed a significant (P = 0.001), negative linear relationship [CVR (%) = −1.5 (OEF) + 83.4, (r = −0.57, P = 0.001, n = 24]. However, 37.5% of the hemispheres showed compromised CVR but normal OEF and were associated (P = 0.019) with subcortical white matter infarction. CMRO2 was elevated in stage II hemodynamic compromise (CVR < 10%, OEF > 50%). CVR and OEF showed a significant negative linear relationship in stage II hemodynamic compromise but revealed hemispheres in hemodynamic compromise by CVR but normal OEF that were associated with subcortical white matter infarction.
Keywords
Cerebral hemodynamic compromise in patients with internal carotid artery occlusion is presently identified either by the CBF response to a vasodilatory challenge for a measure of cerebrovascular reserve (CVR) (Hirano et al., 1994; Kanno et al., 1988; Kuroda et al., 2001; Nariai et al., 1995; Ogasawara et al., 2002a; Silvestrini et al., 2000; Yonas et al., 1993) or by the measurement of resting oxygen extraction fraction (OEF) by positron emission tomography (PET) (Grubb et al., 1998; Hirano et al., 1994; Kanno et al., 1988; Nariai et al., 1995; Yamauchi et al., 1996, 1999). Both methods are capable of identifying a subgroup of symptomatic patients with occlusive vascular disease (OVD) at high risk for subsequent stroke, but whether they identify the same patients or hemispheres in hemodynamic compromise has not been established; in fact, studies examining this relationship indicate that they do not.
Previous studies examining the relationship between CVR and OEF in symptomatic patients with OVD indicate an overall correlation (Imaizumi et al., 2002; Kanno et al., 1988; Nariai et al., 1995), but discrepancies arose when specific thresholds were used and were left unexplained. Nariai et al. (1995) showed that of 14 brain regions in hemodynamic compromise by CVR, OEF was elevated in 8 and normal in 6 regions. Kanno et al. (1998) reported that of 19 patients, 8 showed no correlation between CVR and OEF. Imaizumi et al. (2002) correlated CVR and OEF and showed that 9 of 64 regions were identified as compromised by CVR but not by OEF. These discrepancies were likely presumed to be a failure in CVR rather than OEF. However, in a 5-year follow-up study, Yamauchi et al. (1991) reported that of a total of 11 strokes, 5 occurred in 7 patients with high OEF and 6 occurred in 33 patients with normal OEF. Thus, 54% (6/11) of the strokes occurred in subjects with normal OEF. Whether CVR was also impaired in these patients is unknown. These observations suggest that while OEF may be an independent predictor of hemodynamic compromise, we need to have a better understanding of the relationship between OEF and CVR and their ability to detect hemodynamic compromise.
Baron et al. (1981) first presented the concept of “misery perfusion” based on the measurement of OEF by PET. Subsequently, Powers (1991) predicted changes in PET variables based on the cerebrovascular changes that occur with an acute, progressive reduction in cerebral perfusion pressure (CPP). These cerebrovascular adjustments to an acute reduction in CPP were defined in four stages: stage 0, when CPP is normal; stage I, when CPP is reduced and cerebral vessels dilate to maintain CBF normal while OEF remains normal; and stage II, when the compensatory capacity for cerebral vasodilation is overwhelmed, CBF begins to decrease, and OEF increases to maintain CMRO2. Although not specifically mentioned, stage III is also illustrated, where oxygen delivery becomes limiting and CMRO2 decreases while OEF is predicted to remain at maximal levels. It is important to note that these predicted changes were based on the changes occurring in acute changes in CPP that may or may not apply to changes in chronic stroke as in symptomatic patients with OVD.
Our aim in this study was to examine the relationship between OEF and CVR of the hemispheric middle cerebral artery (MCA) territories of symptomatic, carotid-occluded patients to determine whether hemispheres identified by CVR in hemodynamic compromise are also identified by OEF. The relationship between subcortical white matter infarction and hemodynamic compromise was also examined.
MATERIALS AND METHODS
Subjects
This study followed a protocol approved by the Institutional Review Board. Twelve patients ranging in age from 50 to 75 years (mean ± SD, 63.4 ± 8.4 years; seven men and five women), with at least one occluded internal carotid artery (diagnosis confirmed by angiography or computed tomography [CT] angiography), were recruited into the study after informed consent. Contralateral internal carotid artery stenosis ranged from less than 70% (n = 7) to 90% to 100% (n = 5). All 12 patients had transient ischemic attacks within 3 months, and attacks were occurring daily in 3 patients; 11 of 12 were purely motor, 4 with claudication (limb shaking associated with assuming an erect posture) (Firlik et al., 1996), and 6 with ocular claudication (transient loss of acuity in bright light). Six of the 12 patients had fixed clinical deficits. By magnetic resonance imaging (MRI), 6/12 had evidence of strokes; all involved the corona radiata and two involved the frontal lobe.
Measurement of cerebrovascular reserve by stable xenon–computed tomography CBF
Anatomical computed tomography (CT) images (x- axial images of y- millimeter thickness without intervals; parallel to the orbitomeatal plane) were obtained to determine the four levels for xenon-CT CBF measurements. The four levels included two at the level of the basal ganglia, a third at the level of the cerebral ventricles, and a fourth at the cerebral cortex above the ventricles (shown with MRI in Fig. 1). Xenon-CT scans consisted of 10-mm-thick axial images parallel to anatomical axial images and separated by 10 mm. Patients inhaled 28% medical-grade xenon gas in 40% oxygen (XeScan stable xenon in oxygen USP; Praxair Pharmaceutical Gases, Praxair, Inc., Danbury, CT, U.S.A.) via facemask, for 4.3 minutes. Two scans were obtained at each of four CT levels before and six scans during Xe inhalation (General Electric Medical Systems, Milwaukee, WI, U.S.A.). CVR was calculated from xenon-CT CBF measurements acquired before and 20 minutes after a vasodilatory challenge with 1 g acetazolamide administered intravenously. CVR was calculated as: CVR (%) = [preacetazolamide — postacetazolamide CBF (mL · 100 g−1 · min−1) / preacetazolamide CBF (mL · 100 g−1 · min−1)] x 100. PET studies were done within 24 hours after the stable xenon-CT CBF study.
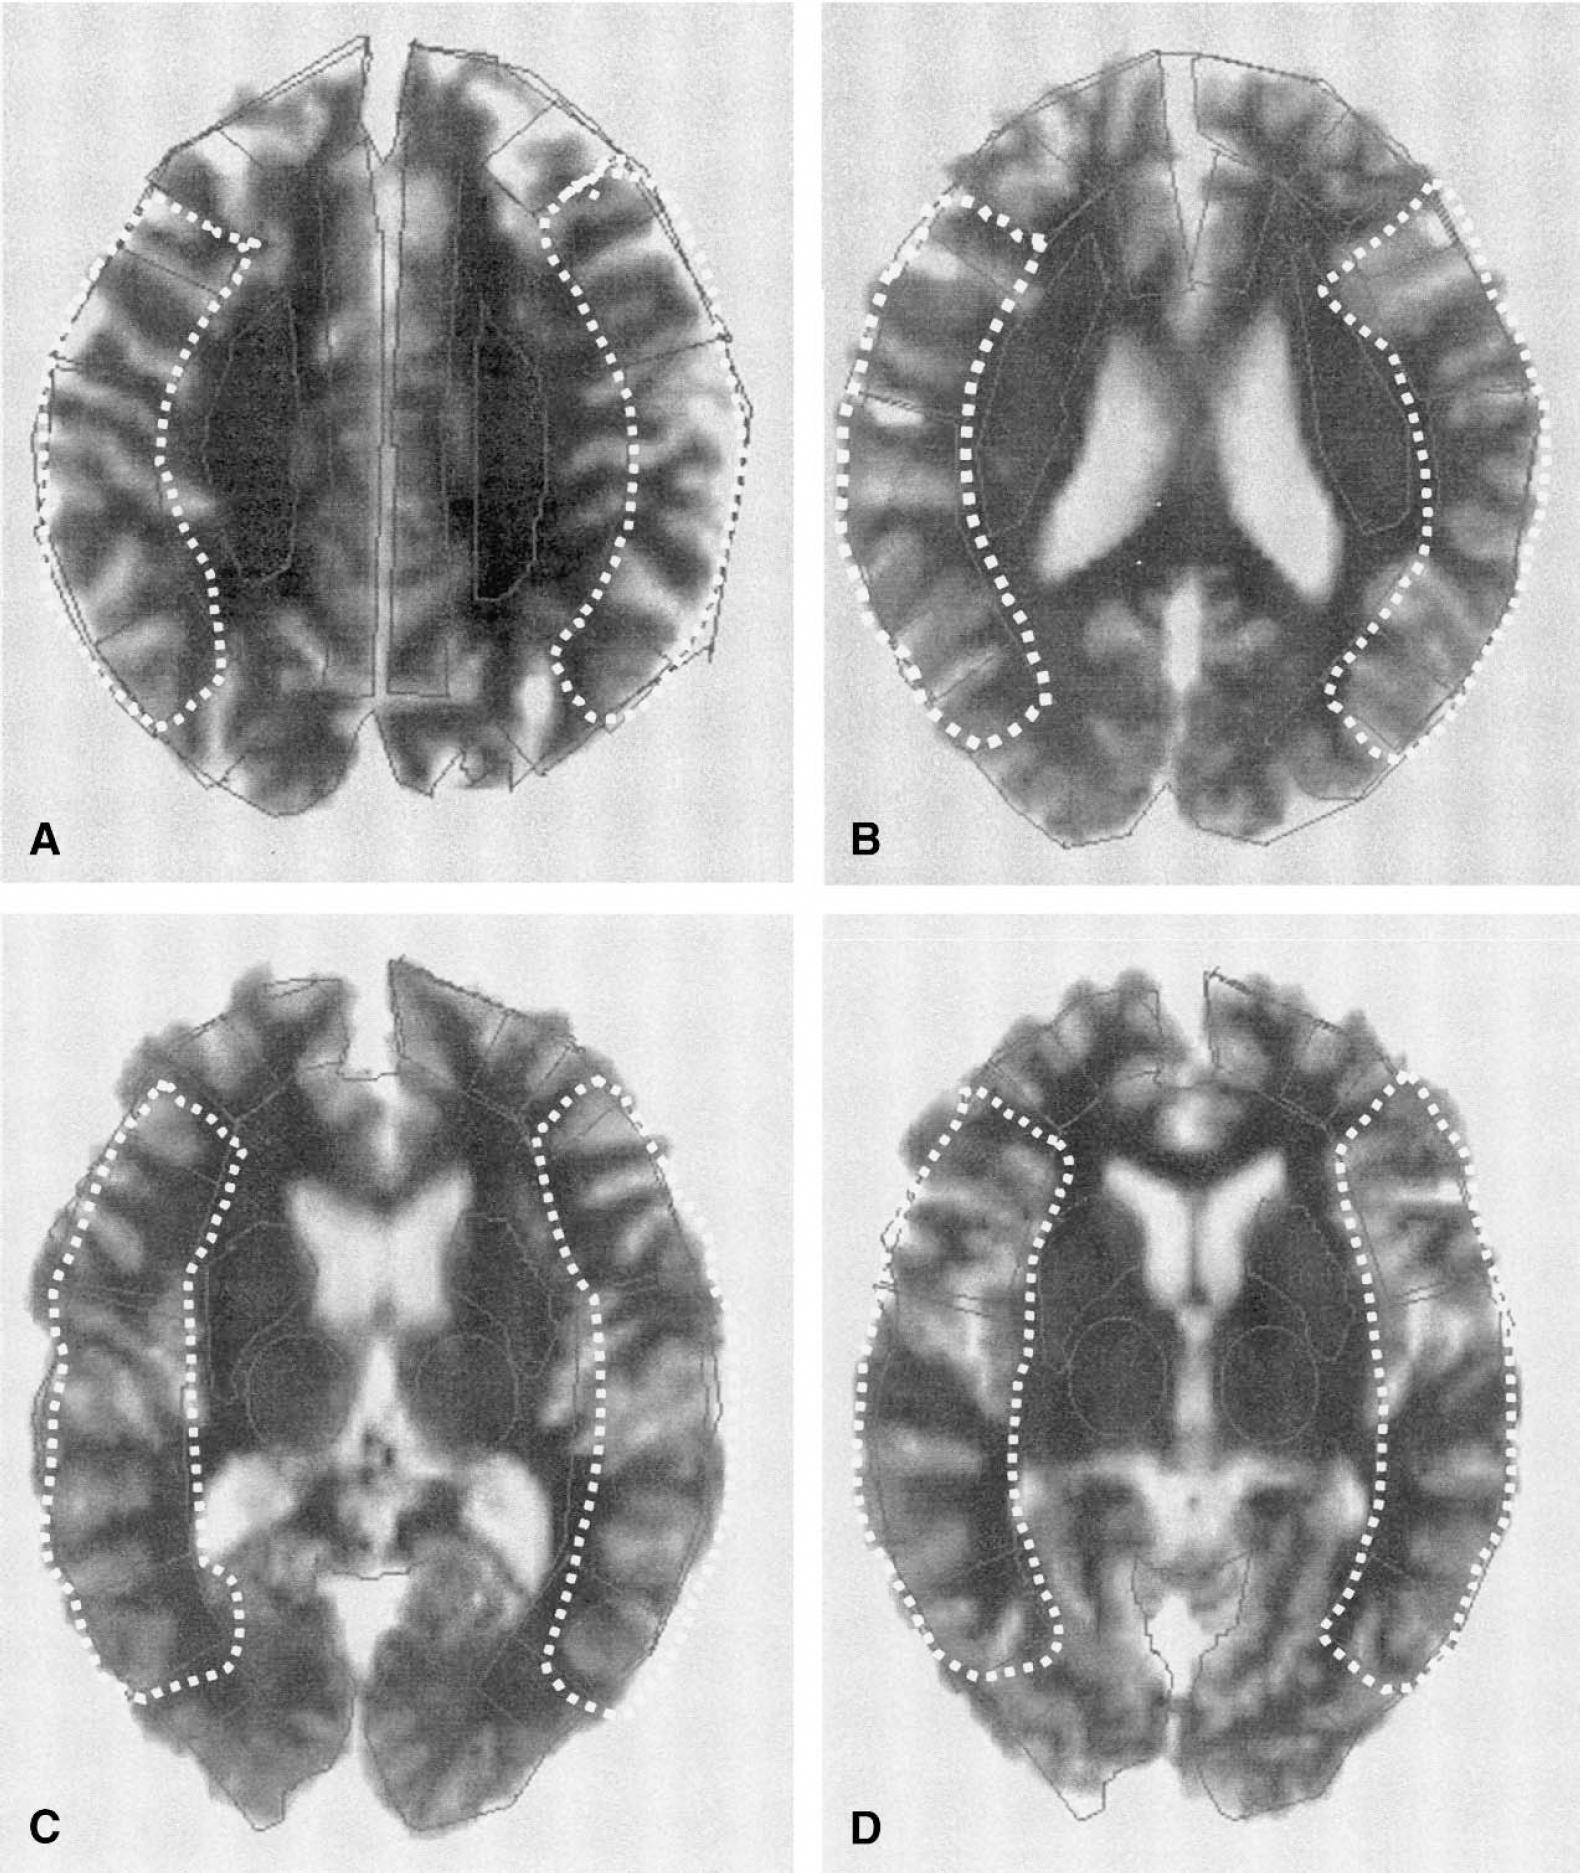
Axial magnetic resonance images shown in this figure were coregistered with positron emission tomography images for drawing of the regions of interest for the middle cerebral artery that are demarcated by the white dotted outlines. Four consecutive planes were included for each of the four levels. At 2.5 mm/plane, each of the four axial levels analyzed had a total thickness of 10 mm.
MRI for CT and PET coregistration
Magnetic resonance imaging studies were performed on a 1.5-T, whole-body Signa Scanner (General Electric Medical Systems). The subjects were positioned in a standard head coil and a brief scout T1-weighted image was obtained from which axial 3-mm T1-weighted images and FLAIRS were prescribed. T2 and proton density images were acquired to exclude unexpected pathology. The total time for the MRI scan was about 30 minutes. The MRI data were transferred to the PET facility over the electronic network and coregistered with the PET data on a SPARC station using software routinely used for this purpose (Woods et al., 1992). The coregistered MRI was used as an individualized anatomic map for the selection of regions of interest (ROI) and for each of the planes.
Each T1 MRI volume was spatially aligned to the individual's anatomical CT volume by minimizing the standard deviation of CT values at outlines of the cerebral cortex and ventricles defined on MRI (Haut et al., 2000). The MRI volume was also spatially aligned to individual averaged PET volumes using the same approach. ROIs for middle cerebral artery territories were defined manually on MRI volumes that were resliced to the orientation of xenon-CT CBF images. ROIs were directly applied to xenon-CT CBF images to obtain regional xenon-CT CBF values, and to dynamic PET images to obtain regional radioactivity time-profiles after being transferred to the PET space using MRI-CT and MRI-PET coregistration parameters. PET regional radioactivity time-profiles were used to obtain regional CBF, CMRO2, and OEF values as stated below.
MRI analysis for subcortical infarcts
A neuroradiologist (D.W.J.) blinded to the OEF and CVR values of the patients graded the subcortical infarcts on the T2-weighted images. Subcortical infarcts were visually graded as follows: 0 = none; light = nonconfluent and < 1 cm in diameter; moderate = nonconfluent and 1 to 3 cm in diameter; severe = confluent and >3 cm in diameter. However, in the analysis of the association with CVR and OEF values, they were all combined in one group of lesions versus without lesions because the number within any one subcategory was too small for statistical analysis.
PET measurements of oxygen extraction fraction
PET scanner system. The PET studies were performed at the University of Pittsburgh Medical Center PET facility on a Siemens/CTI HR+, high-resolution tomograph. The HR+ has an axial field-of-view of 15.2 cm covering the whole brain and acquires 63 transaxial slices 2.4-mm thick. The measured in-plane spatial resolution is 4.5 mm full-width at half-maximum, and the axial resolution is 3.5 mm. Studies were acquired in two-dimensional mode. The PET data were corrected for radioactive decay and scatter (Watson et al., 1997). Image reconstruction was performed using filtered back-projection (Hann filter); the final reconstructed image resolution was 6.5 to 7.0 mm.
CBF and CMRO2 scanning sessions.
A radial artery catheter was inserted for collection of arterial blood samples and blood gas analyses. The patient was placed onto the scanner bed and fitted with a thermoplastic facemask for immobilization. Noninvasive blood pressure was obtained by a blood pressure cuff around the forearm contralateral to the radial artery catheter. A 10- to 15-minute transmission scan with 3 68Ge/68Ga rod sources were obtained for attenuation correction.
CBF measurements.
Continuous arterial blood sampling (6 mL/min) was initiated at the time of injection of 50 mCi 15O-water in 5 to 7 mL saline as an intravenous bolus. Arterial blood was withdrawn by a Master flex peristalsis pump (model #7550–90) through a Siemens Activity Counter (Siemens AG, Erlangen, Germany). A 180-second dynamic PET scan (10 × 6 seconds, then 10 × 12 seconds) began upon injection. Blood withdrawal continued for 30 seconds beyond the end of the PET scan for a total withdrawal time of about 210 seconds and a total of blood volume of about 20 mL. Blood activity data were automatically accumulated in a Sun SPARC station for later processing.
Calculation of CBF.
The 15O-water PET data were analyzed using a two-compartment (one-tissue compartment) model approach described by Ohta et al. (1992). This involved three parameters that provided a measure of the clearance of 15O-water from blood to brain (K1, mL · min−1 · mL−1), brain efflux (K2, min−1), and arterial input function timing delays (Iida et al., 1986). CBF was calculated as K1*100 (mL · 100 g−1 · min−1) assuming a tissue density of one.
Dispersion corrections.
Corrections for dispersions in this study were not made for several reasons. First, the dispersion corrections are highly variable and with corrections ranging from 3 to 9 seconds for each variable including CBF, CMRO2, and OEF. Because of the large standard deviations, the absolute deviation included zero among the values (data not shown). Second, the dispersion correction in patients with OVD is unknown and any attempt at correction would be done blindly. Finally, the reports cited in this article to which our data are being compared also did not correct for dispersion.
Each CMRO2 measurement began with inhalation of 200 mL of medical air containing 50 mCi of 15O-oxygen gas from a Victoreen Gas Delivery System (Cleveland, OH, U.S.A.). Upon breathing the tracer, a 180-second dynamic PET scan (10 × 6 seconds, then 10 × 12 seconds) with continuous arterial blood sampling was begun as previously described for the CBF measurements. An arterial blood sample was obtained at the end of each scan and analyzed for arterial oxygen content, blood gases, and hematocrit.
Calculation of CMRO2.
CMRO2 was measured using a two-compartment model approach described by Mintun et al. (1984) and modified by Ohta et al. (1992). CMRO2 (mL · 100 g−1 · min−1) was calculated as follows: CMRO2 = K1O · CaO2 x 100, where K1O is the rate of uptake of O2 gas from blood to brain and CaO2 is the arterial oxygen content (mL O2/mL blood).
Cerebral blood volume.
Cerebral blood volume was not measured directly and the values obtained in the effective blood volumes (Vo) defined in the rCBF and rCMRO2 models are not the same as the cerebral blood volume (the volume of blood per unit cerebral tissue) and are therefore not reported. In the models used, the blood volumes are defined by two compartments; one compartment [Ca(t)] that changes as a function of time after tracer injection, and the other as a function of radioactivity in the tissue. Vo estimates the compartment changing as a function of time after tracer injection. The Vo map of 15O-water studies represents the arterial map while the Vo map of 15O-gas studies represents both the arterial and venous maps both of which are several times smaller than the total determinants of K1 and K2. Therefore, estimates of Vo cannot be as accurate as those of K1 and K2.
Calculation of OEF.
Oxygen extraction fraction was calculated as the K1O/K1w ratio for individual regions. This ratio relates oxygen gas uptake to CBF, which relates to the rate of oxygen delivery. As previously defined, CMRO2 is the value of K1O multiplied by the arterial oxygen content.
Level and hemispheric middle cerebral artery territory analysis
Cortical stable xenon-CT CBF, CVR and PET OEF, CBF, and CMRO2 values were obtained for the MCA territories (Demasio, 1983) for each of the four levels separately, and as an average of all four levels for each hemisphere. The levels selected were two at the level of the basal ganglia, a third at the level of the cerebral ventricles and a fourth at the cerebral cortex above the ventricles (Fig. 1). The ROI on the CT images for the xenon-CT CBF measurements were similarly drawn. Each level was 10-mm thick and separated by 10 mm.
The percent change after acetazolamide was calculated for the MCA territory for each of four levels separately and as an average of the four levels combined for a hemispheric average. All cortical infarcts identified by CT and MRI as being larger than 2.0 cm in greatest diameter were eliminated from CVR and OEF analyses. If more than three of the six cortical ROI were infarcted within a particular MCA territory, the entire MCA territory was eliminated from analysis.
Data analysis
Statistical analyses were done using the Prophet (AB Tech Corporation) statistical program using one-way analysis and the t-test with Bonferroni correction. Chi-square tests were used for the dichotomous comparisons. Regression analyses were done on Excel. Statistical significance was based on a P value < 0.05. All data are expressed as mean ± SD unless otherwise stated.
RESULTS
Hemispheric analysis
The correlation between CVR and OEF by hemispheric averages of MCA territories was described by the regression equation: CVR (%)= −1.5 · OEF(%) + 83.4 (Fig. 2). Using a CVR threshold of 10% derived from 10 healthy volunteers by Kuroda et al. (2001), the linear regression intersects OEF at 50%. Using these OEF and CVR thresholds: 11 of 24 (45.8%) were uncompromised by both CVR and OEF; 3 of 24 (12.5%) hemispheres were in hemodynamic compromise by both CVR and OEF; 9 of 24 (37.5%) hemispheres were in hemodynamic compromise by CVR but not by OEF; 1 of 24 (4.0%) were in hemodynamic compromise by OEF but not by CVR.
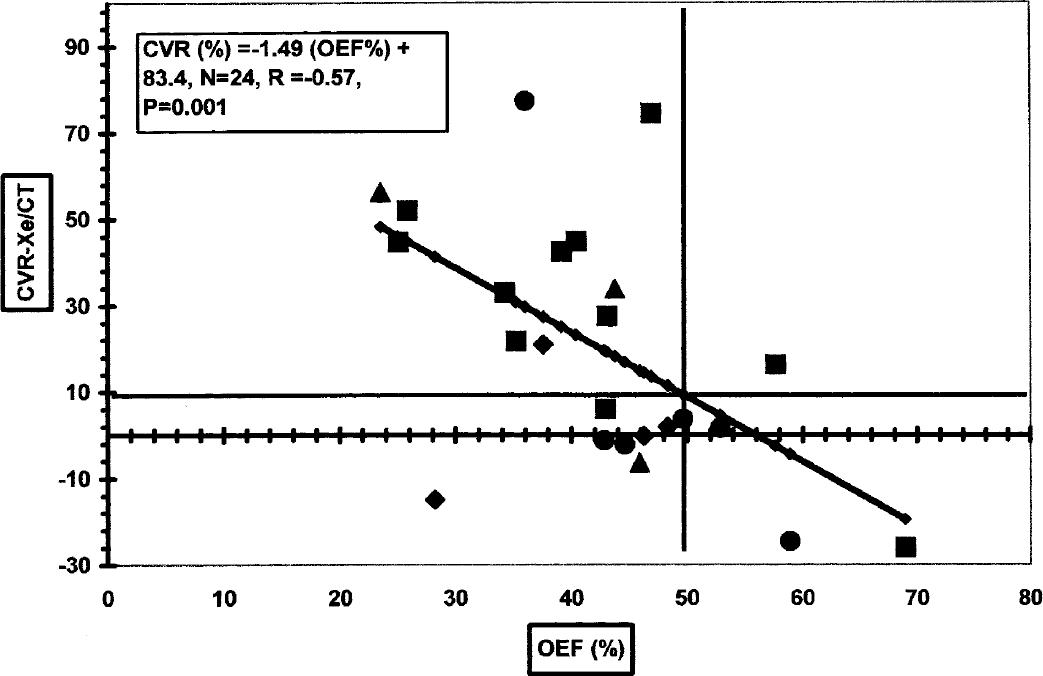
Regression analysis of the relationship between oxygen extraction fraction (OEF, %) by positron emission tomography (PET) and cerebrovascular reserve (CVR, %) by stable xenon CT (Xe/CT) cerebral blood flow (CBF) for the middle cerebral artery (MCA) territories of the right and left hemispheres in 12 patients. Associated subcortical white matter infarctions in 13/24 hemispheres are indicated: >3+ cm = ▲, 3 cm = ♦, 1 cm = ●, none = ■.
Subcortical white matter lesions were present in 13 of the 24 hemispheres (Table 1 and Fig. 2). The incidence of the lesions in hemispheres with CVR < 10% was 81.8% and significantly higher (P = 0.019) compared with the incidence of 30.8% for hemispheres with CVR ≥ 10%.
Cerebral variables by PET and stable Xe/CT (CBF) in 12 symptomatic stroke patients with carotid occlusive vascular disease analyzed according to hemispheric averages of the MCA territories of four axial levels and with or without associated white matter lesions by MRI (N = 24)
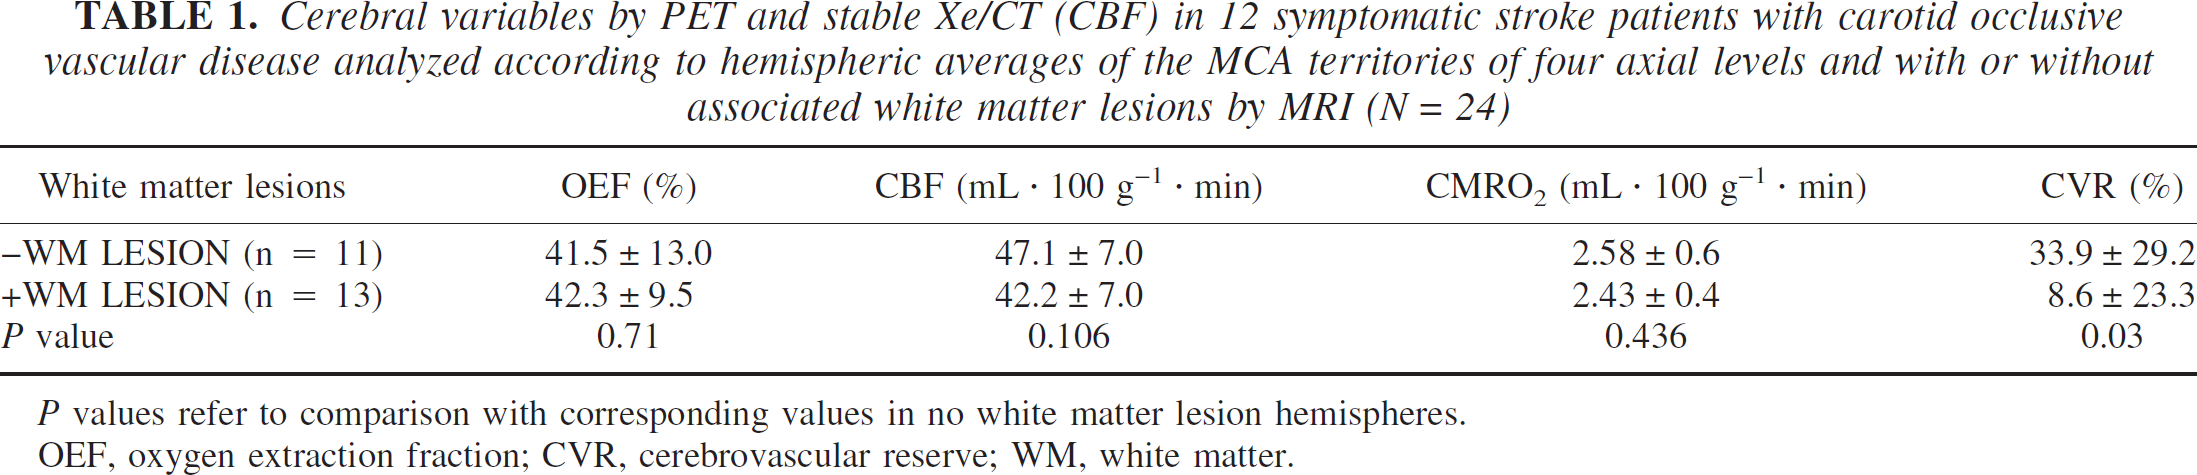
P values refer to comparison with corresponding values in no white matter lesion hemispheres.
OEF, oxygen extraction fraction; CVR, cerebrovascular reserve; WM, white matter.
Comparison of cortical circulatory and metabolic variables of hemispheres that were not associated with subcortical white matter injury showed a significant (P = 0.03) difference in CVR (by definition) but not in any of the other PET variables, CBF, CMRO2, or OEF.
Level analysis (hemispheric MCA territories of each of four levels analyzed separately) of CVR and OEF was described by the regression equation, CVR (%) = −1.38 (OEF) + 77.0 (Fig. 3). As for the hemispheric analysis, using a CVR threshold of 10%, intersection with the regression line was at an OEF of 50%. Using the same thresholds as in the hemispheric analysis: 47/95 (49.5%) was uncompromised by both CVR and OEF; 17/95 (17.9%) was in hemodynamic compromise by both CVR and OEF; 24/95 (25.3%) was in hemodynamic compromise by CVR but not by OEF; and 6/95 (6.3%) was in hemodynamic compromise by OEF but not by CVR.
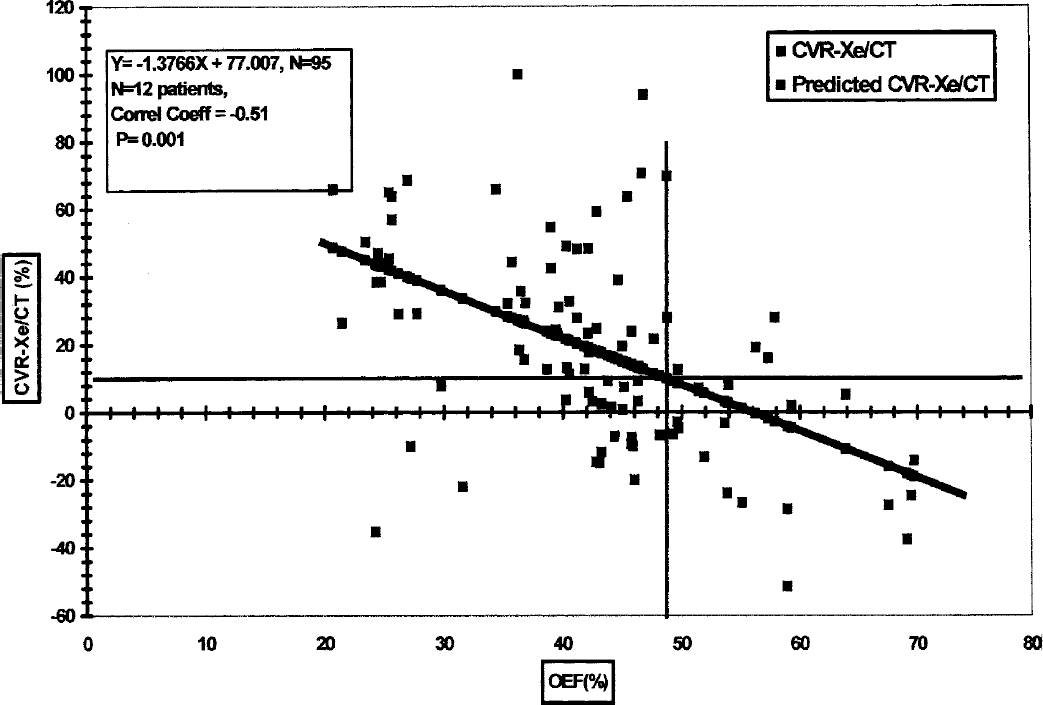
Linear regression analysis of the relationship between oxygen extraction fraction (OEF, %) by positron emission tomography and cerebrovascular reserve (CVR, %) by stable xenon-CT (Xe/CT) CBF with acetazolamide (15 mg/kg, intravenous), for the middle cerebral artery (MCA) territories of the right and left hemispheres in 12 symptomatic patients with at least one occluded internal carotid artery. Each point represents the MCA territory of one of four levels in each patient. A total of eight MCA territories were obtained in each patient. One value was deleted because it was greater than 100%, resulting in a total of 95 MCA territories.
CVR and PET variables were determined for each of the CVR and OEF threshold categories used in Figs. 1 and 2 (Table 2). In MCA territories with OEF > 50%, CMRO2 was significantly (P = 0.0001) elevated compared to other CVR and OEF categories. OEF was significantly (P = 0.0001) higher where CVR was < 10% versus CVR > 10%.
Cerebrovascular reserve (CVR) by stable xenon/CT CBF with acetazolamide challenge and CBF, CMRO2, and oxygen extraction fraction (OEF) by positron emission tomography (PET) in 12 symptomatic patients with carotid occlusive disease
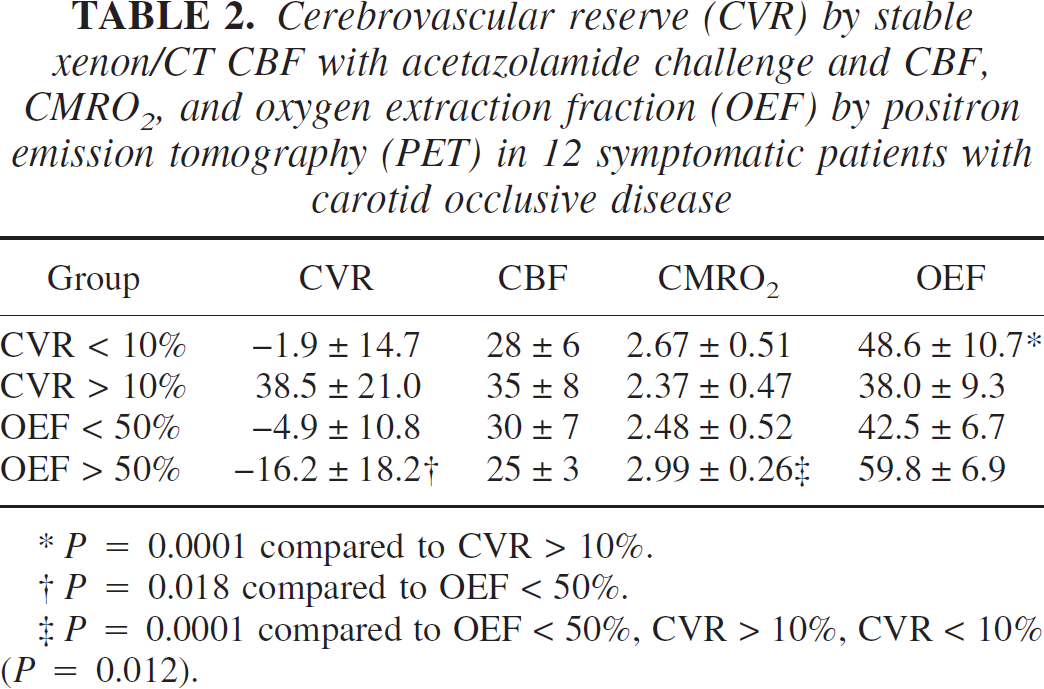
P = 0.0001 compared to CVR > 10%.
P = 0.018 compared to OEF < 50%.
P = 0.0001 compared to OEF < 50%, CVR > 10%, CVR < 10% (P = 0.012).
DISCUSSION
The notable aspects of the results obtained in this study were: (1) a significant, negative linear relationship between quantitative PET OEF and CVR; (2) despite the significant relationship between CVR and OEF, a significant subgroup of MCA hemispheres and levels identified in hemodynamic compromise by CVR with normal OEF was revealed; (3) these hemispheres identified in hemodynamic compromise by CVR but not by OEF were highly associated with prior subcortical white matter injury; (4) CMRO2 was elevated in MCA territories in stage II hemodynamic compromise (OEF > 50% and CVR < 10%) compared with territories with CVR > 10% and OEF < 50%.
Correlation between CVR and OEF
The relationship between CVR and OEF can be predicted on the basis of the changes with increasing ischemic stress as described in four stages by Powers (1991) with normal as stage zero. In addition to the changes in the PET variables described by Powers, we have added CVR (Fig. 4, Nemoto et al., 2003). From these predicted changes in CVR and OEF in ischemic stress, a theoretical construct of the CVR-OEF relationship in the various stages I through III can be derived (Fig. 5). In stage I, CVR decreases while OEF remains relatively unchanged resulting in a vertical straight line. In stage II, where the limit of vasodilation is exceeded and CVR is theoretically equal to zero and CBV maximum, CBF begins to decrease and OEF increases to maintain CMRO2, resulting in a negative, linear relationship between CVR and OEF. At the start of stage II, CVR decreases below zero to negative values presumably due to a “steal” phenomenon where blood flow is “stolen” from hemodynamically compromised to uncompromised regions in patients who are dependent on leptomeningeal and ophthalmic collaterals (Smith et al., 1994). As CBF continues to decrease and the ability of the brain to extract oxygen from the blood is exceeded, stage III begins, and oxygen delivery limits CMRO2, which begins to decrease. In stage III, according to the depiction by Powers (1991), OEF is maintained at maximal levels, which may be the case for brain regions suffering acute ischemia and oxygen demand continues to maximally extract oxygen from blood.
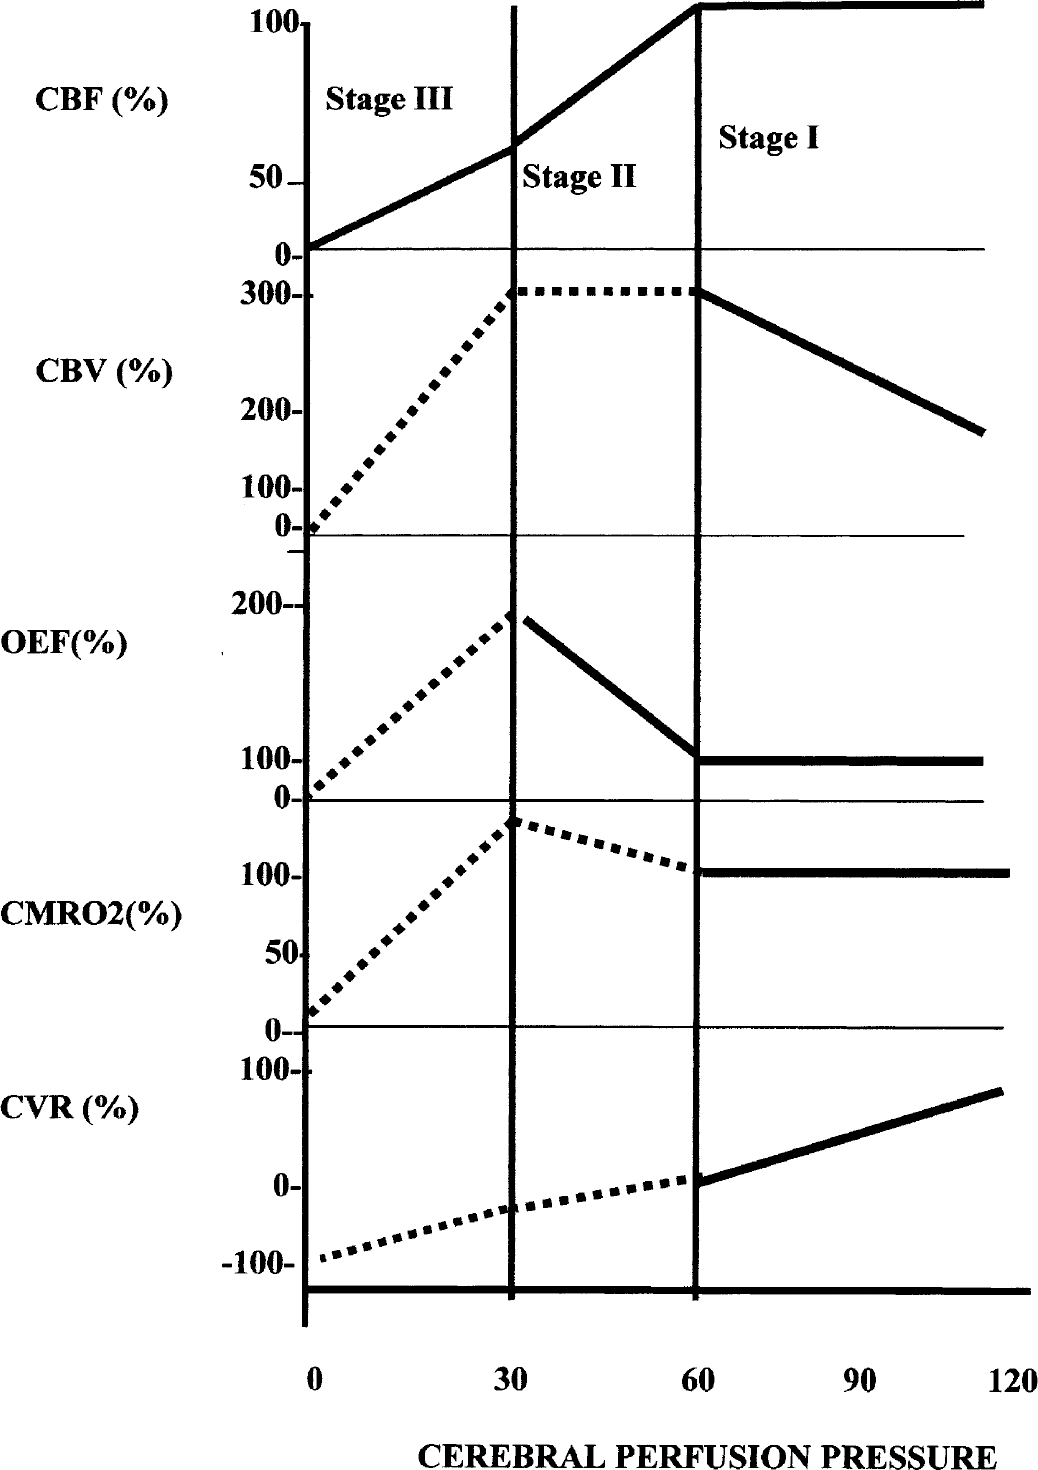
Illustration of the changes in cerebral variables during a progressive decrease in cerebral perfusion pressure and progression through various stages of impaired cerebral circulation modified after Powers (1991) by the addition of cerebrovascular reserve (CVR) and an increase in CMRO2 at the end of stage II. CBV, cerebral blood volume. The stages are referenced to the changes in oxygen extraction fraction (OEF). In stage I, OEF is unchanged. In stage II, OEF begins to increase. Whether the increase is linear is unknown. In stage III, OEF declines again. Solid lines show changes that are known and dashed lines, those that are postulated. From Nemoto EM, Yonas H, Chang Y (2003) Stages and thresholds of hemodynamic failure. Stroke 34:2–3, with permission.
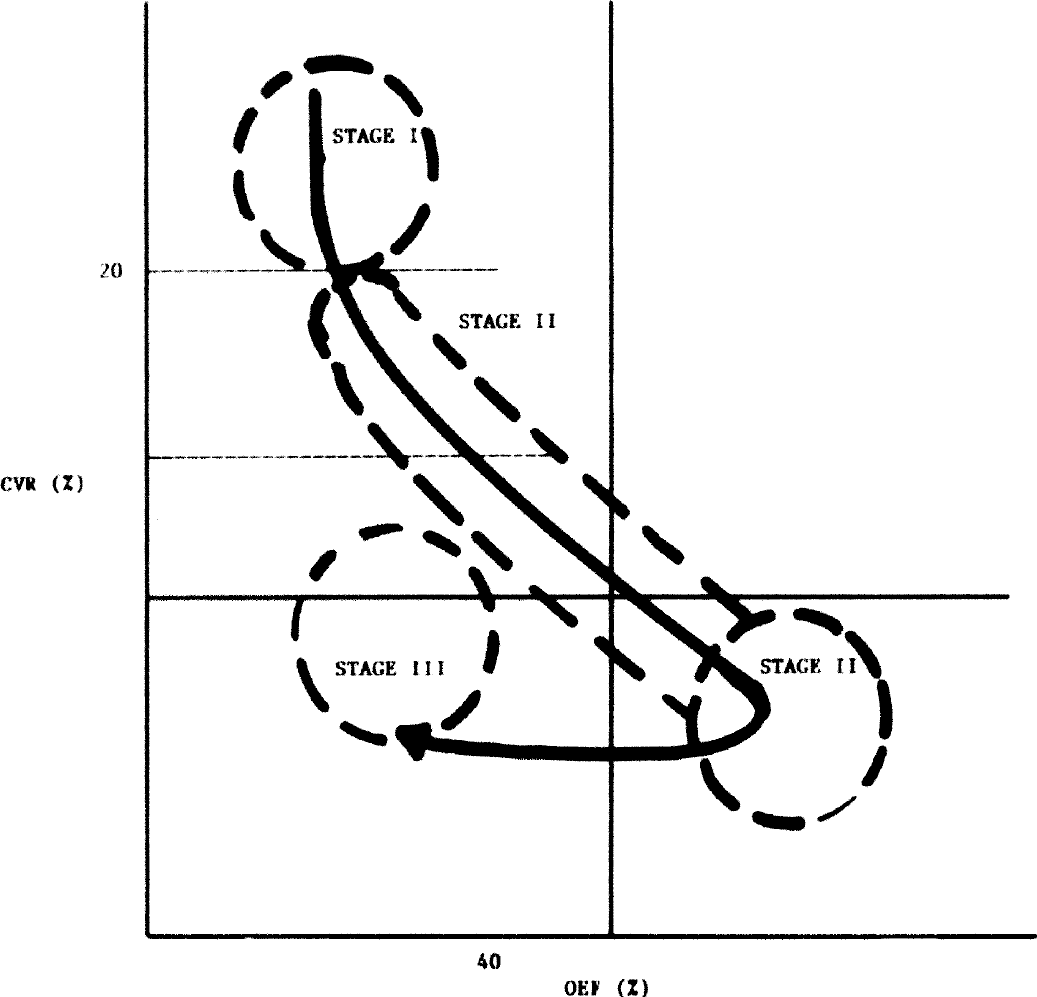
Hypothesized illustration of the stages I through III through the relationship between cerebrovascular reserve (CVR) and oxygen extraction fraction (OEF)based on predicted changes as previously described by Powers (1991) and modified by Nemoto et al. (2003).
The difference between the decrease in OEF in stage III that we propose and the maintained elevation of OEF in Powers' depiction may be explained by the difference between acute and chronic ischemic stress. In other words, in the depiction by Powers, OEF is sustained at maximal levels in stage III because the tissue has not yet been injured sufficiently to cause a primary reduction in oxygen uptake. However, in the stage III of our symptomatic chronic stroke patients, MCA territories may have already suffered a primary reduction in CMRO2 and a coupled decrease in OEF with compromised cerebrovascular reactivity or hemodynamic compromise by CVR but a normal or low OEF. Thus, Powers' stage III might be referred to as stage IIIa (stage III acute), and the stage III that we propose is stage IIIc (stage III chronic). This is an important consideration because if there is a decrease in OEF in stage IIIc, then OEF may fail as a lone identifier of hemodynamic compromise.
Biphasic changes in OEF with cerebral ischemia leading to infarction have been described. An increase in OEF in ischemia remaining elevated for as long as 4 days after the stroke has been reported (Baron et al., 1981; Frackowiak and Lammertsma, 1985; Marchal et al., 1993; Wise et al., 1983) that eventually declines to normal or below normal with infarction. Wise et al. (1983) reported that high OEF in cerebral ischemia was consistently followed by infarction. However, in a baboon model of focal cerebral ischemia, Young et al. (1996) found that despite the highest OEF values in the MCA territory of the cerebral cortex, the area of infarction occurred not in the cortex but rather in the basal ganglia, suggesting that high OEF does not necessarily progress to infarction as reported by Powers et al. (1985) and Baron (1989). It is clear that ischemic injury with or without infarction or ischemic injury alone, results in a decrease in CMRO2 and a coupled decrease in OEF (Powers et al., 1985).
Identifying hemodynamic compromise by CVR and OEF
To select the threshold for CVR, we note that the results obtained in the prospective study by Kuroda et al. (2001) corroborated the findings of an earlier retrospective study by Yonas et al. (1993), who used stable xenon-CT, quantitative CBF measurements of CVR, as we used in this study, to show that a CVR of −5% and CBF < 45 mL · 100g−1 · min−1) predicted a 36% increased stroke risk over 24 months. Kuroda et al. (2001) in a prospective study using quantitative 133 xenon-CT CBF for CVR, reported an average CVR of −5.4 ± 4.8% combined with a CBF of 34.8 ± 3.6 mL · 100 g−1 · min−1) in a subset of patients who had a total annual stroke rate of 35.6%. These patients were selected according to the 10% threshold derived from the 95% confidence interval of the mean minus two standard deviations of the CVR value obtained in 10 healthy volunteers, which was 20.3% ± 5.3%. Thus, the CVR threshold of 10% was used in this study.
Using a CVR of <10% as a threshold and the linear regression CVR-OEF relationship from our data, an OEF threshold of 50% was obtained, a value similar to the thresholds reported by other investigators (Hirano et al., 1994; Nariai et al., 1995; Powers et al., 1985; Wise et al., 1983; Yamauchi et al., 1996). With the CVR threshold set at 10% and OEF at 50%, a substantial percentage of hemispheres (37%) and levels (25%) were found to be in hemodynamic compromise by CVR but with normal OEF. In contrast, all hemispheres with high OEF also had subthreshold CVR. Severely compromised CVR correlates with an increased incidence of future as well as past infarctions (Kuroda et al., 2001; Ogasawara et al., 2002a, b; Yonas et al., 1993), which raises the question as to why normal OEF would coexist with hemodynamic compromise.
Discordance between CVR and OEF in identifying hemodynamic compromise has been previously reported. Imaizumi et al. (2002) compared CVR by split-dose single photon emission CT (SPECT) with acetazolamide and OEF by PET. In their data, the correlation between CVR and OEF showed that 9 of 64 brain regions had impaired CVR (below the threshold of 23%) but low OEF, whereas 11 of 64 brain regions had both low CVR and high OEF. Nariai et al. (1995) showed that 6 out of 13 or nearly half of the hemispheres identified had low CVR but normal OEF. Hirano et al. (1994) used a qualitative SPECT ratio method and compared hemispheric ratios and reported equivalence between CVR and OEF, even though acetazolamide SPECT was performed 3 days after the baseline SPECT and the PET OEF studies were separated from the SPECT studies by 2 weeks. Apart from the questionable validity of qualitative SPECT and the asymmetry index in identifying hemodynamic compromise by CVR (Ogasawara et al., 2002a; Yokota et al., 1998; Yonas et al., 1998) also because the opposite hemisphere may be compromised (Waterson et al., 1990) incongruities could be masked. Finally, Yamauchi et al. (1991) in a 5-year follow-up study, reported that of 11 total strokes, 54% or 6 of 11 occurred in subjects with normal OEF. The reason for the discordance between CVR and OEF or the false negatives of OEF in identifying hemodynamic compromise may be explained on the basis of a primary reduction in tissue oxygen demand and a concomitant reduction in OEF.
Inconsistencies in the OEF thresholds used in various reports have led to the question as to whether OEF as a single variable can accurately identify hemodynamic compromise. In a prospective study, Grubb et al. (1998) used a qualitative PET OEF hemispheric ratio method (Derdeyn et al., 1999) and reported that the OEF ratio was an independent predictor of increased stroke risk. In setting the threshold for the OEF ratio, the upper limit of the OEF ratios obtained in a group of 18 normal subjects of 1.082 was used as a threshold of “high” OEF. In a subsequent analysis of the absolute OEF data in the same 18 healthy volunteers, Derdeyn et al. (2001) revealed an OEF of 0.41 ± 0.09 (mean ± SD). Using a threshold of 0.44, they showed that eight of the nine strokes were identified above this threshold (Derdeyn, et al., 2001; Derdeyn et al., 2002). However, questions on the choice of the OEF threshold selected renders their conclusions on the ability of OEF in predicting subsequent stroke questionable (Nemoto et al., 2003). Both this discrepancy and that previously discussed (Imaizumi et al., 2002; Kanno et al., 1988; Nariai et al., 1995) suggest that OEF may be inadequate as a single variable identifying hemodynamic compromise, and that our understanding between CVR and OEF in ischemic brain is inadequate. The qualitative OEF ratio as a single variable may indeed be an independent predictor of hemodynamic compromise (Grubb et al., 1998), but the question is with what sensitivity and specificity?
The discordance between CVR and OEF in the identification of hemodynamic compromise may be related to the white matter injuries within the hemispheres of such patients, suggesting that the reduced OEF may be a consequence of ischemic injury in the subcortical white matter and cortical deafferentation as previously reported by Baron et al. (1986) in thalamic stroke and cortical hypometabolism. A similar relationship of internal border zone white matter infarction associated with compromised hemodynamics has been previously reported (Del Sette et al., 2000; Krapf et al., 1998; Yamauchi et al., 1991). Our inability to show a significant reduction in hemispheric CMRO2 for those areas associated with subcortical white matter infarction may be due to hemispheric averaging of the MCA territories and dilution of the data and the fact that “normal” in these patients may be low as discussed below. Integration of our data with the published literature supports the notion that OEF is biphasic with a rise in stage II and a decrease in stage III (Baron et al., 1981; Nariai et al., 2001; Powers et al., 1985; Wise et al., 1983). That these hemispheres in hemodynamic compromise by CVR but not by OEF may also be at high risk for stroke is suggested by a finding of a 5-year follow-up study, where Yamauchi et al. (1998) found that of a total of 11 strokes, 5 occurred in 7 patients with high OEF and 6 (54%) occurred in subjects with normal OEF. This indicates that a substantial number of patients with normal OEF go unidentified by OEF.
Our results show that at the peak of stage II ischemic stress, CMRO2 is elevated relative to values in MCA territories that are hemodynamically uncompromised. Our observations are corroborated by data reported by Nariai et al. (2001), who reported an increase in CMRO2 in patients with transient ischemic attacks without infarction relative to healthy normal volunteers and a subsequent decrease in CMRO2 with infarction. Our values for CMRO2 (2.37 ± 0.47 mL · 100 g−1 · min−1) and CBF (35 ± 8 mL · 100 g−1 · min−1) for the MCA territories, even in territories with CVR > 10% and OEF < 50% (Table 2), are clearly lower than the values reported for the MCA territories of healthy volunteers reported by Ito and Senda (2003), where CMRO2 was 3.4 ± 0.5 mL · 100 g−1 · min−1 and CBF was 44.0 ± 7.6 mL · 100 g−1 · min−1). Therefore, the “increase” in CMRO2 we observed may be not elevated relative to normal but elevated relative to the tissue of these symptomatic stroke patients with OVD. The lower values of the “normal” (i.e., CVR > 10%, OEF < 50%) may explain the inability to show a reduction in CMRO2 for the hemispheres and levels with compromised CVR and normal OEF associated with subcortical white matter infarction.
In summary, the negative, linear relationship between OEF and CVR suggests a transition of tissue from normal to increasing ischemic stress and beyond. Despite this correlation, there are substantial hemispheric and level incongruities in the identification of hemodynamic compromise by CVR and OEF that may be associated with prior white matter lesions, deafferentation of the cortical gray matter, and coupled decrease in OEF. These results indicate that although both CVR and OEF have been proven capable of identifying a subgroup of patients at increased stroke risk, our results suggest that OEF alone may not be capable of identifying the true spectrum of patients at increased stroke risk.
Footnotes
Acknowledgments:
The authors gratefully acknowledge the assistance of Ms. Holly Kromer, BS, and Ms. Margaret-Beth Ott, BA, for obtaining the research Xenon/CT scans for the study, Dr. James Gebel for helpful comments regarding the manuscript, and Lori Kirby, RN, for her assistance with the patients and sorting out the demographics.