
Abstract
A zone of hypoperfusion surrounding acute intracerebral hemorrhage (ICH) has been interpreted as regional ischemia. To determine if ischemia is present in the periclot area, the authors measured cerebral blood flow (CBF), cerebral metabolic rate of oxygen (CMRO2), and oxygen extraction fraction (OEF) with positron emission tomography (PET) in 19 patients 5 to 22 hours after hemorrhage onset. Periclot CBF, CMRO2, and OEF were determined in a 1-cm-wide area around the clot. In the 16 patients without midline shift, periclot data were compared with mirror contralateral regions. All PET images were masked to exclude noncerebral structures, and all PET measurements were corrected for partial volume effect due to clot and ventricles. Both periclot CBF and CMRO2 were significantly reduced compared with contralateral values (CBF: 20.9 ± 7.6 vs. 37.0 ± 13.9 mL 100 g−1 min−1, P = 0.0004; CMRO2: 1.4 ± 0.5 vs. 2.9 ± 0.9 mL 100 g−1 min−1, P = 0.00001). Periclot OEF was less than both hemispheric OEF (0.42 ± 0.15 vs. 0.47 ± 0.13, P = 0.05; n = 19) and contralateral regional OEF (0.44 ± 0.16 vs. 0.51 ± 0.13, P = 0.05; n = 16). In conclusion, CMRO2 was reduced to a greater degree than CBF in the periclot region in acute ICH, resulting in reduced OEF rather than the increased OEF that occurs in ischemia. Thus, the authors found no evidence for ischemia in the periclot zone of hypoperfusion in acute ICH patients studied 5 to 22 hours after hemorrhage onset.
In many animal models of acute intracerebral hemorrhage (ICH), reduced cerebral blood flow (CBF) has been demonstrated both globally and in the area immediately surrounding the clot (Ropper and Zervas, 1982; Mendelow et al., 1984; Nath et al., 1986; Bullock et al., 1988; Kobari et al., 1988; Mendelow, 1993; Yang et al., 1994). The cause for this reduced blood flow is unknown, but cerebral ischemia because of mechanical compression of the microvasculature surrounding the clot has been postulated (Mendelow et al., 1984; Nath et al., 1987). However, not all experimental data support this theory (Patel et al., 1999; Qureshi et al., 1999). A similar zone of hypoperfusion surrounding the clot has been demonstrated in patients with acute ICH (Sills et al., 1996; Mayer et al., 1998; Videen et al., 1999).
Whether this reduction in periclot flow indicates tissue ischemia cannot be determined by measurements of CBF alone. Low CBF may be either a consequence of reduced blood supply (ischemia) or a reflection of reduced metabolic demand of damaged tissue. To distinguish between these two possibilities, a measure of the tissue metabolism is necessary (Powers, 1991). Under normal circumstances, CBF is closely matched to cerebral metabolic rate of oxygen (CMRO2) resulting in a uniform oxygen extraction fraction (OEF) throughout the brain (Frackowiak et al., 1980; Lebrun-Grandie et al., 1983; Fox and Raichle, 1986). When blood supply is reduced relative to metabolic demand, OEF increases, permitting areas of regional ischemia to be identified. Focally increased OEF is found in the majority of patients with acute ischemic brain infarction studied within the first 24 hours (Baron, 1991; Wise et al., 1983). If regional ischemia is present after ICH, periclot OEF will be elevated. Positron emission tomography (PET) measurements of OEF, CBF, and CMRO2 were performed in 19 patients with ICH within 24 hours of symptom onset to determine if there was a regional increase in OEF around the clot indicative of ischemia.
MATERIALS AND METHODS
Patients
Patients were eligible for inclusion in the current study if they suffered a spontaneous, nontraumatic, supratentorial ICH that was evident on head computed tomography (CT) scan, were at least 18 years of age, and could be studied within 24 hours of symptom onset. Patients were excluded if they were pregnant; if the hemorrhage was thought to be associated with a vascular malformation, aneurysm, or tumor; if there was ongoing cardiac ischemia or congestive heart failure; or if there were plans for immediate surgery. Informed consent was obtained from patients or their families. The current study was approved by the Human Studies Committee and the Radioactive Drug Research Committee of Washington University.
All patients were evaluated by a neurologist or neurosurgeon at the time of admission. Age, gender, race, time of onset, risk factors for ICH, admission mean arterial pressure (MAP), Glasgow Coma Scale (GCS) score (Teasdale and Jennett, 1974), and ICH location were recorded. Time of onset was counted from the time the patient was last known to be normal if symptoms were first noticed on waking from sleep or if no accurate history could be obtained from the patient. Use of antihypertensive agents, mannitol, or sedatives before enrollment was recorded. Patients were endotracheally intubated if they were unable to maintain an adequate airway, had respiratory distress, or if GCS was ≤8. Hyperventilation was not performed in any patient. In patients with GCS ≤8, an intracranial pressure monitor was placed if there was concern for increased intracranial pressure, and a ventriculostomy was placed if hydrocephalus was thought to be contributing to poor neurologic status. Coagulopathies (prothrombin time >14 seconds or platelet count <100,000/mm3) were corrected with vitamin K, fresh-frozen plasma, or platelets as needed. After initial screening and stabilization, patients were transferred to the Neurology-Neurosurgery Intensive Care Unit (NNICU) where an arterial catheter was placed. If sedation was required after enrollment in the study, fentanyl was the only agent used, because it does not affect measurements of CBF and OEF in patients with acute brain injury (de Nadal et al., 2000).
Positron emission tomography studies were attempted in 50 patients with ICH in the 4-year period between September 1995 and September 1999. Of these, 26 studies were unsuccessful because of technical difficulties with arterial blood sampling (n = 16), poor patient cooperation (n = 7), blood pressure instability (n = 1), or absent CBF (n = 2). Twenty-four patients were successfully studied. Five of these patients were excluded from this report for the following reasons: PET study was performed beyond 24 hours after hemorrhage (n = 1), the periclot region was too small (ICH volume 0.3 cm3) to provide enough counts for statistically valid measurements (n = 1), bilateral hematomas were present (n = 1), and hypodensity on CT remote from the hematoma suggested old infarct (n = 2). The remaining 19 patients were included in the analysis.
Positron emission tomography studies
All patients were studied using an ECAT Exact HR 47 PET scanner (Siemens/CTI, Knoxville, TN, U.S.A.) (Wienhard et al., 1994) located in the NNICU. The NNICU PET Research Facility is equipped with the same life support and monitoring equipment as each patient bed in the NNICU. An individual transmission scan was obtained for each patient and used for subsequent attenuation correction of emission scan data. Positron emission tomography scans were obtained in the two-dimensional mode (interslice septa extended), and images were reconstructed with filtered back-projection using measured attenuation and scatter correction to a resolution of 4.3 mm full width at half maximum. All emission PET scans were calibrated for conversion of PET counts to quantitative radiotracer concentrations, as previously described (Mintun et al., 1984; Raichle et al., 1983). Radioactivity in arterial blood was measured with an automated blood sampler. The arterial time-radioactivity curve recorded by the sampler was corrected for delay and dispersion using previously determined parameters.
Cerebral blood flow was measured by bolus injection of 75 mCi 15O-labeled water using an adaptation of the Kety autoradiographic method (Raichle et al., 1983; Herscovitch et al., 1983; Videen et al., 1987). Cerebral blood volume (CBV) was measured after a brief inhalation of 75 mCi15O-labeled CO (Martin et al., 1987). CMRO2 and OEF were calculated using the CBF and CBV measurements and inhalation of 75 mCi 15O-labeled O2 (Mintun et al., 1984; Videen et al., 1987).
A physician was always present in the scanner room throughout all PET studies. Every effort was made to maintain a constant physiologic state during the study. Antihypertensive agents were administered for sustained MAP >150 before commencement of study. At the time of each PET study, additional data collected included MAP, arterial blood gas analysis, GCS score, and Neurological Scale for Middle Cerebral Artery Infarction score (Orgogozo and Dartigues, 1991; Edwards et al., 1995).
Immediately after the PET study, high-resolution anatomic images (0.435 × 0.435 × 3.0 mm pixels, 137 kV, 720 mAs) were acquired on each patient using a Siemens Somatom Plus 4 or Siemens Somatom Plus S CT scanner (Siemens, Iselin, NJ, U.S.A.).
Data analysis
Positron emission tomography images were aligned to one another (Woods et al., 1992) and were coregistered to CT images (Woods et al., 1993) using Automated Image Registration software (AIR, Roger Woods, University of California, Los Angeles, CA, U.S.A.). The PET images then were masked to exclude noncerebral structures and all measurements were corrected for partial volume effect due to clot and ventricles (Videen et al., 1999).
In all 19 patients, periclot measurements of CBF, CMRO2, and OEF were determined by drawing a 1-cm-wide area around the hyperdense clot on each CT slice containing clot and then superimposing this area on the PET images (Fig. 1). Hemispheric measurements were derived from whole slice averages above the pineal as identified on the coregistered CT scan and excluded the periclot region and CSF spaces. In 16 patients, mirror regions in the contralateral hemisphere were created by transposing the periclot region across the midline on the CT image and superimposing this area on the PET images. If the transposed region included ventricular or subarachnoid space, the region was moved to exclude such structures, because zero values would artifactually lower the measurements in the region. No region was moved more than eight pixels. Three patients were excluded from this analysis because midline shift was great enough to prevent transposition of the periclot region into the contralateral hemisphere (ICH volume 99, 90, 50 cm3). Outlining the periclot regions and transposing the regions into the contralateral hemisphere were performed by a single investigator who was blinded to the PET images.
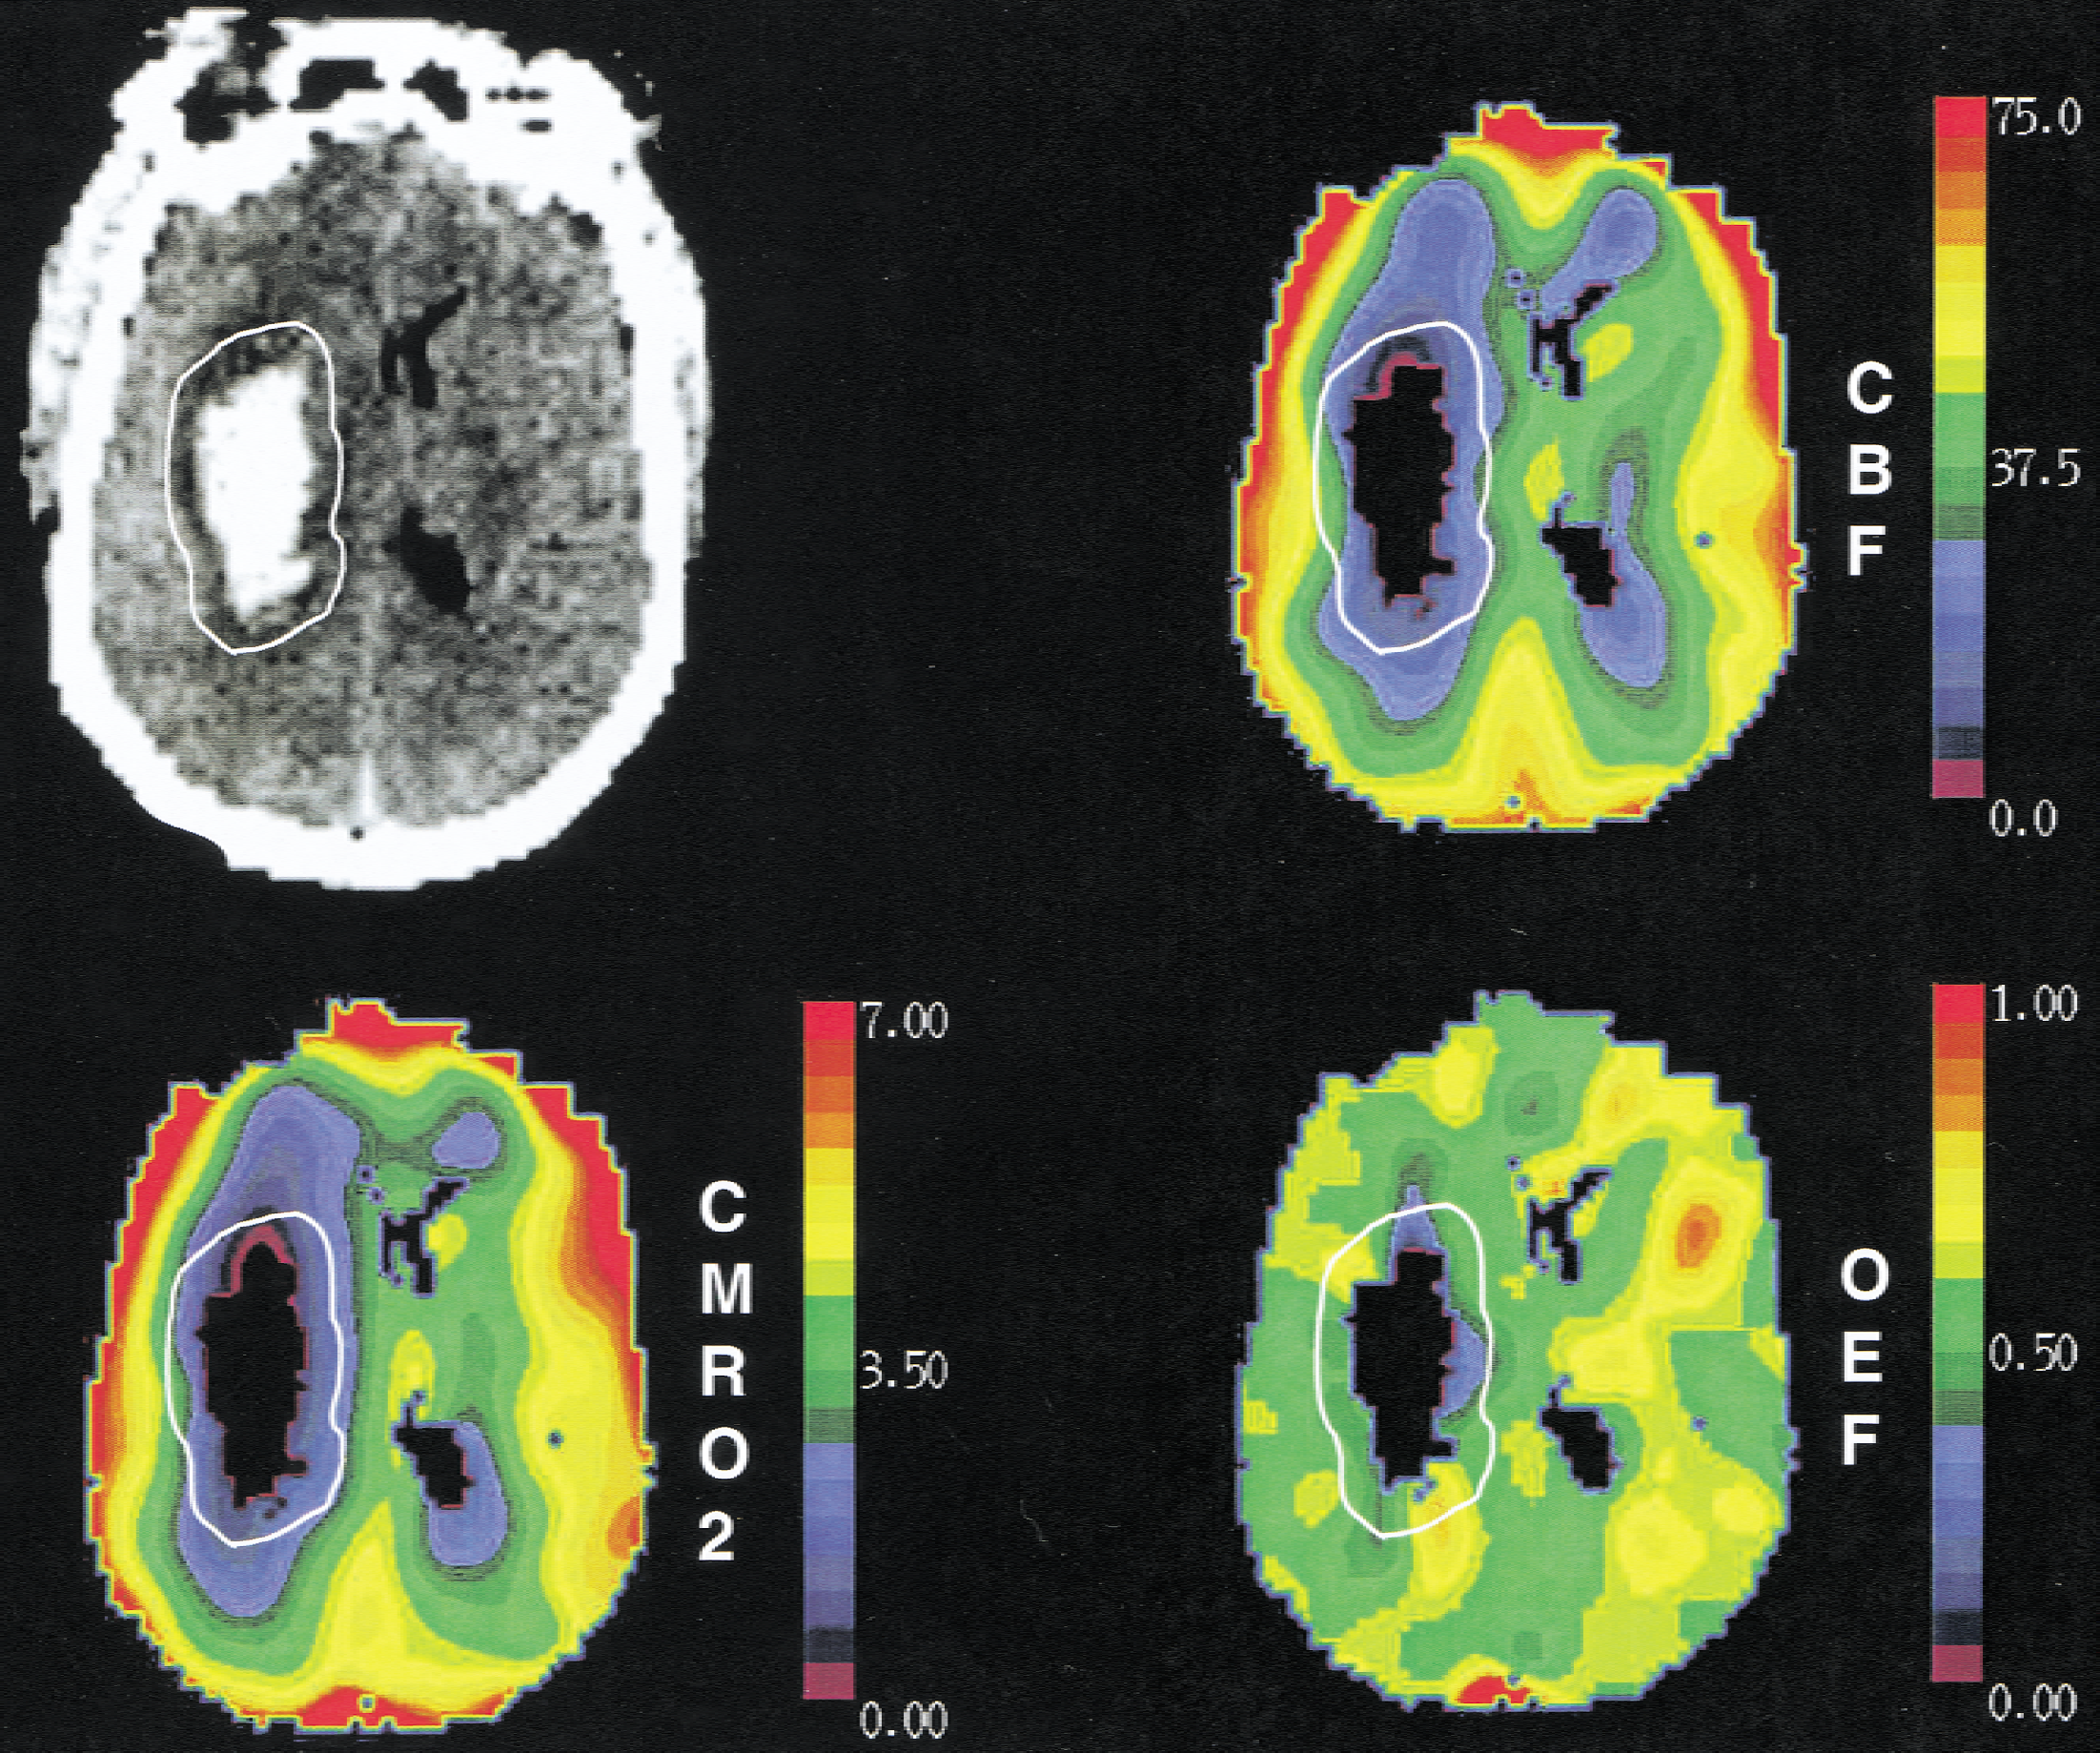
Coregistered computed tomography (CT) and positron emission tomography (PET) images of a 44-year old hypertensive man with a left putaminal hemorrhage studied 21 hours after onset. The 1-cm-wide periclot region was outlined in white on the CT scan and superimposed on the cerebral blood flow (CBF), cerebral metabolic rate of oxygen (CMRO2), and oxygen extraction fraction (OEF) images. The color scale is relative, with purple representing the lowest values and red the highest. PET images were reconstructed to a resolution of 16 mm full width at half maximum for display purposes. All quantitative data were derived from 4.3 full width at half maximum images (see text). Periclot flow, metabolism, and OEF are all reduced compared with the contralateral hemisphere.
Partial volume correction of all regional and hemispheric measurements was performed by first determining the mean regional and hemispheric counts in each 4.3-mm full width at half maximum image; next, scaling this by the mean tissue correction factor measured in the same region on the coregistered tissue correction factor image; and finally, converting to metabolic values using the equations previously described. This sequence minimizes error due to misregistration and to nonlinear terms in the calculations (Videen et al., 1999).
Statistical analysis
Periclot measurements of CBF, CMRO2, and OEF were compared with contralateral measurements and periclot OEF was compared with hemispheric OEF using paired t-tests. P ≤ 0.05 was required for statistical significance. All continuous data are presented as mean ± SD.
RESULTS
Patients were studied 5 to 22 hours (15 ± 5 hours) after symptom onset. Five were studied within 12 hours, and 1 within 6 hours. Clinical characteristics on admission and CT findings after PET are summarized in Table 1. Between hemorrhage onset and PET, two patients received mannitol, two patients received antihypertensive agents, two patients each received lorazepam and midazolam, and three patients received etomidate. None of these drugs were given within 4 hours of the study other than 1 dose of mannitol 95 minutes before PET and, in a different patient (per study protocol), 1 dose of labetalol for a sustained MAP >150 mm Hg just before commencement of PET. After labetalol was administered, MAP decreased to the 140s and remained stable throughout the duration of the study. Seven patients received fentanyl for sedation during or within 2 hours of PET.
Clinical and CT characteristics of 19 patients with ICH
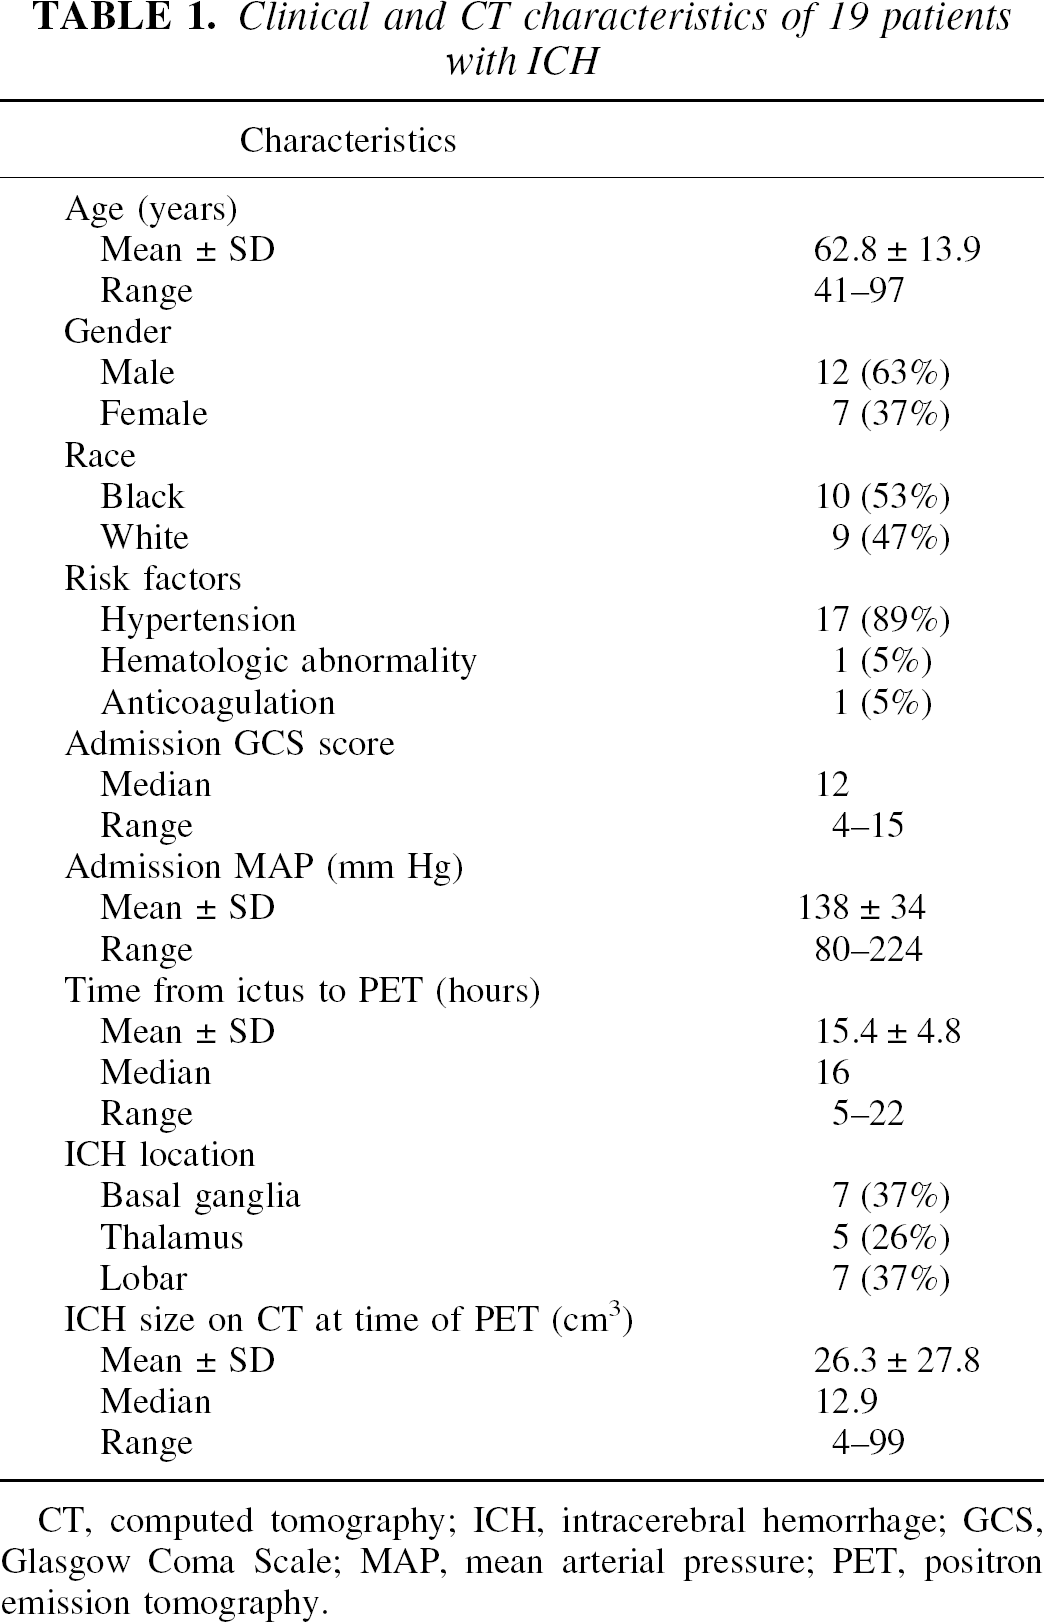
CT, computed tomography; ICH, intracerebral hemorrhage; GCS, Glasgow Coma Scale; MAP, mean arterial pressure; PET, positron emission tomography.
Cerebral blood flow in the periclot region was significantly reduced compared with contralateral CBF (20.9 ± 7.6 vs. 37.0 ± 13.9 mL 100 g−1 min−1, P = 0.0004). Similarly, periclot CMRO2 was significantly less than contralateral CMRO2 (1.4 ± 0.5 vs. 2.9 ± 0.9 mL 100 g−1 min−1, P = 0.00001).
Periclot OEF was significantly less than hemispheric OEF (0.42 ± 0.15 vs. 0.47 ± 0.13, P = 0.05). (Table 2) There was no correlation between periclot:hemispheric OEF ratio and time after hemorrhage (r = 0.25, P = 0.30) or clot size (r = 0.34, P = 0.16). To ensure that a rim of increased OEF was not missed by restricting the periclot region to only a 1-cm area, OEF also was measured in a second region extending 2 cm away from the clot in a subset of 16 patients in whom such a region could be drawn. Oxygen extraction fraction in this region was not significantly different from hemispheric OEF (0.47 ± 0.12 vs. 0.47 ± 0.12, P = 0.73).
Periclot and hemispheric OEF in 19 ICH patients
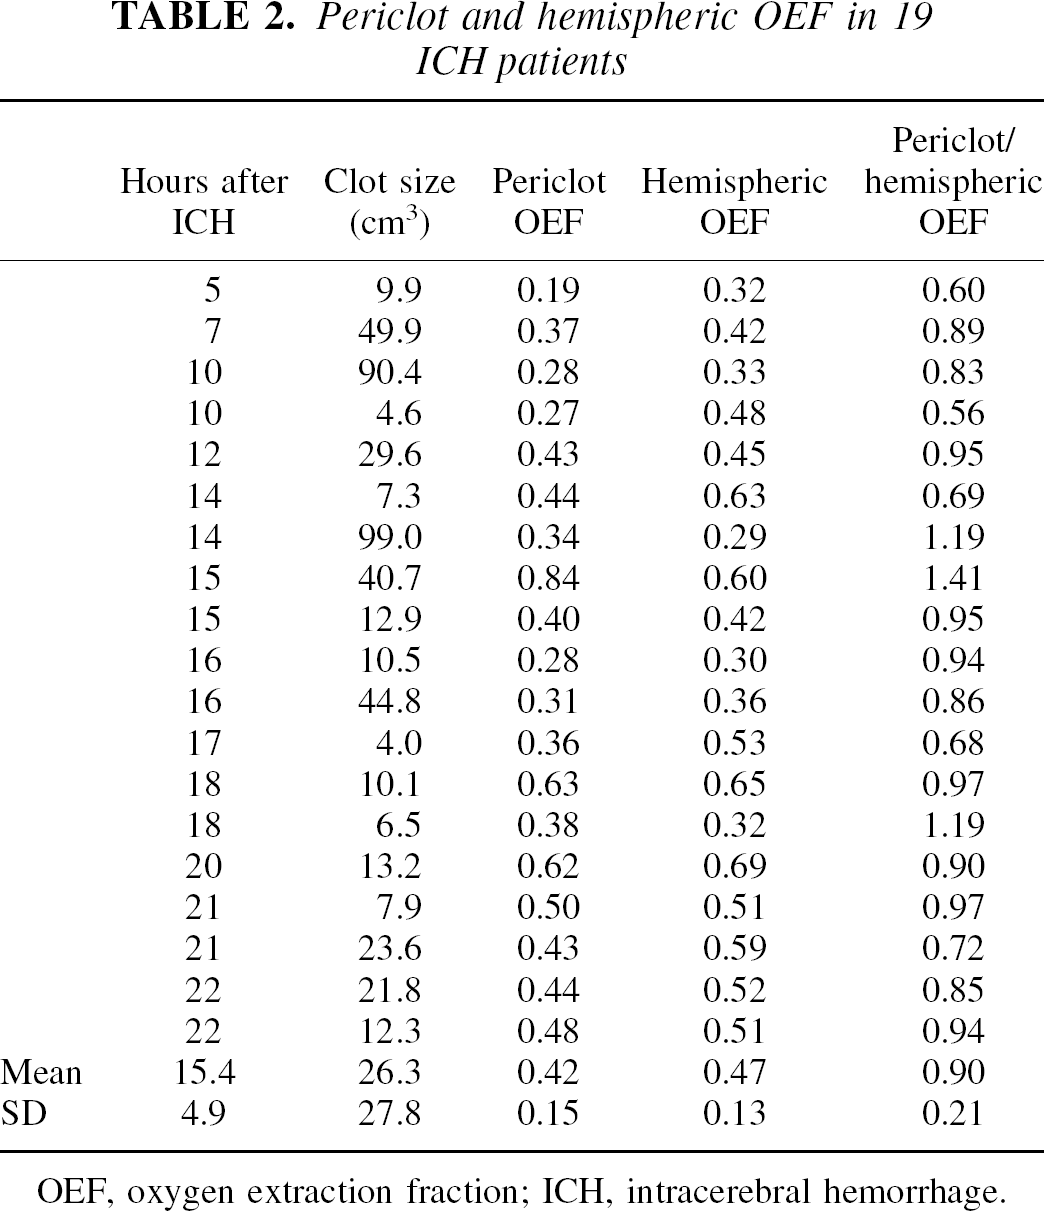
OEF, oxygen extraction fraction; ICH, intracerebral hemorrhage.
In the subset of 16 patients in whom contralateral measurements could be obtained, periclot OEF was also significantly less than contralateral OEF (0.44 ± 0.16 vs. 0.51 ± 0.13, P = 0.05). Using two standard deviations greater than the mean of the contralateral regional OEF values as the upper limit of control OEF [0.51 + 2(0.13) = 0.77], only one patient had an abnormally high periclot OEF (0.84).
DISCUSSION
Both CBF and CMRO2 were reduced in the region surrounding acute ICH. The reduced OEF in this region reflects the fact that CMRO2 was reduced to a proportionately greater degree than CBF. This is the opposite of what occurs in acute ischemia when CBF is reduced to a larger extent than CMRO2 and OEF is elevated. The current data indicate that there is a greater than 95% probability that OEF is not elevated in the periclot region; thus, no evidence was found for periclot ischemia in acute ICH patients at the time of study 5 to 22 hours after hemorrhage onset. The authors cannot determine definitively from these data whether regional ischemia occurred earlier; however, this is doubtful. In patients with acute cerebral infarction, areas of increased OEF are demonstrable in the majority of patients studied within 24 hours of symptom onset (100% within 9 hours, 83% within 12 hours, and 57% within 24 hours) (Baron, 1991; Wise et al., 1983). Furthermore, in most patients with acute ischemic stroke who do not have increased OEF, CBF is elevated suggesting reperfusion (Hakim et al., 1987; Furlan et al., 1996; Marchal et al., 1996). Thus, in patients with decreased CBF around the clot, one would have expected to observe increased OEF even at 5 to 24 hours in a substantial number if there had been initial ischemia at the time of hemorrhage. In fact, the authors found that OEF was increased above control only in 1 of 16 subjects–exactly what was expected using a control range of 2 standard deviations or 95% confidence limits.
The authors' method for defining the periclot area as a 1-cm region surrounding the clot on the CT scan was chosen to maximize the potential for detecting ischemia, while preventing bias that might occur by defining the region on one of the PET images. The authors had no data to indicate how large of a periclot region to use. For all but the largest clots, a smaller region would compromise the ability to achieve sufficient counts for statistically valid measurements. A larger region might have included both abnormal and normal periclot tissue, reducing sensitivity to detect an area of increased OEF. Another approach would have been to analyze a region encompassing the periclot lucency as seen on CT scan, because this lucency is sometimes interpreted to represent a zone of ischemia (Dolinskas et al., 1977; Kendall and Radue, 1978; Liliequist, 1983). Upon attempting to outline such a region, however, it became readily apparent that in the majority of subjects in whom the periclot area extended into white matter, a distinction between periclot lucency and white matter would be highly subjective. All OEF images were visually inspected to determine if regions of increased OEF around the clot had been missed outside of the CT-based region. With the exception of the single patient with periclot OEF 0.84 (who had alternating areas of high and low OEF around the clot) mentioned above, none were seen. Further supporting the likelihood that the authors did not miss areas of increased OEF outside of the 1-cm periclot region, OEF in a region extending 2 cm away from the clot was not significantly different from hemispheric OEF.
Previous studies using 18F-fluoromisonidazole PET (Hirano et al., 1999) and diffusion-weighted magnetic resonance imaging (Carhuapoma et al., 2000) have similarly concluded that there is no ischemia in the periclot area, but patients were all studied more than 24 hours after symptom onset. The current results support and expand on these by describing patients studied at earlier time points with a different methodology.
The authors also provide quantitative regional CBF and CMRO2 data to complement previous reports of periclot hypoperfusion. Using nonquantitative SPECT measurements, Sills et al. (1996) reported a zone of hypoperfusion larger than predicted by phantom measurements surrounding hematomas in 7 patients 51 ± 12 hours after ICH. Also using nonquantitative SPECT measurements, Mayer et al. (1998) reported hypoperfusion surrounding hematomas in 23 patients studied 18 ± 8 hours after ICH. Calculated flow deficit volumes in the area of the hematomas equaled or exceeded the CT-derived ICH volumes in the majority of patients. No distinction was made between those in whom the area of hypoperfusion equaled the size of the clot and those in whom it extended beyond the confines of the clot, so it is unclear how many of these patients actually had reduced periclot blood flow. In both of these studies, the delay between CT and SPECT was often substantial; therefore, the possibility that the hematoma was larger at the time of SPECT cannot be excluded. The current data indicate that periclot CBF and CMRO2 were significantly reduced compared with corresponding regions in the contralateral hemisphere even after correction for the effects of partial volume averaging, which can artifactually decrease measurements by as much as 30% at boundaries between tissue and clot (Videen et al., 1999).
The comparison to regions in the contralateral hemisphere is potentially limited by two factors. First, the contralateral hemisphere may not be normal because of diaschisis (Tanaka et al., 1996). If diaschisis were present in the patients studied here, contralateral CBF would be less than expected, making the current results even more significant. The second potential limitation is that because clots likely displace brain structures rather than destroy and replace them, a region equidistant from the midline on the opposite side may not contain the same structures as are contained in the periclot area. The authors corrected for cases in which the contralateral region included ventricular or subarachnoid space and excluded patients whose clots were so large or midline shift so great that the corresponding region in the contralateral hemisphere extended outside the brain. The authors could not, however, account for the distribution of white and gray matter within the corresponding regions.
Explanations for the reduced metabolism and blood flow in the periclot area remain speculative. A consistent increase in the percentage of white matter with a lower metabolic rate in the periclot as compared with the control regions could account for this. The authors did their best to ensure that this was not the case and have no reason to believe that such a systematic bias exists. Reduced CBF and CMRO2 with reduced OEF can be observed with chronic infarction but the authors have already explained why they do not believe that ischemic damage has occurred (Lenzi et al., 1982). Direct effects of the hemorrhage are the most likely explanation, either by mechanical disruption caused by the sudden forceful introduction of blood into the brain parenchyma or the toxic effects of blood constituents. Injection of whole blood into the basal ganglia has been shown to produce greater damage than injection of inert oil (Jenkins et al., 1990), indicating that the mechanical effect alone may not entirely account for the reduced metabolism. Whole blood constituents such as thrombin (Lee et al., 1996) and matrix metalloproteinases (Rosenberg and Navratil, 1997) have been demonstrated to have toxic effects in experimental ICH and are potential candidates. Before the onset of vasospasm, patients with aneurysmal subarachnoid hemorrhage show a primary reduction in CMRO2, which has been postulated to be because of the effects of blood (Carpenter et al., 1991). Finally, apoptosis mediated through extravasation of activated cytokines (Nagata and Golstein, 1995), thrombin (Donovan et al., 1997), or iron (Kruman et al., 1997) from the clot may play a role.
Footnotes
Acknowledgments:
The authors thank Lennis L. Lich, Susanne M. Fritsch, R.N., Ellen M. Deibert, M.D., and the NNICU nurses for their help in performing the PET studies; the cyclotron staff at Washington University for production of radiotracers; and John T. Hood, Jr. for help with data analysis.