
Abstract
The effect of the basal cerebral blood flow (CBF) on both the magnitude and dynamics of the functional hemodynamic response in humans has not been fully investigated. Thus, the hemodynamic response to visual stimulation was measured using blood oxygenation level-dependent (BOLD) functional magnetic resonance imaging (fMRI) in human subjects in a 7-T magnetic field under different basal conditions: hypocapnia, normocapnia, and hypercapnia. Hypercapnia was induced by inhalation of a 5% carbon dioxide gas mixture and hypocapnia was produced by hyperventilation. As the fMRI baseline signal increased linearly with expired CO2 from hypocapnic to hypercapnic levels, the magnitude of the BOLD response to visual stimulation decreased linearly. Measures of the dynamics of the visually evoked BOLD response (onset time, full-width-at-half-maximum, and time-to-peak) increased linearly with the basal fMRI signal and the end-tidal CO2 level. The basal CBF level, modulated by the arterial partial pressure of CO2, significantly affects both the magnitude and dynamics of the BOLD response induced by neural activity. These results suggest that caution should be exercised when comparing stimulus-induced fMRI responses under different physiologic or pharmacologic states.
Keywords
It is well known that global cerebral blood flow (CBF) can be modulated by changes in arterial partial pressures of carbon dioxide and oxygen. It has also been shown or suggested that the intake of commonly used substances (e.g., caffeine, nicotine, alcohol), changes in the concentration of endogenous substances (e.g., estrogen, adrenaline), the experimental administration of various drugs (e.g., cocaine, acetazolamide), and the use of anesthetic agents can cause global perturbations of CBF. It is therefore important to examine how modulation of the global CBF baseline affects the local hemodynamic response to neural activity.
The change in the steady-state magnitude of the task-induced hemodynamic response during manipulation of the basal CBF has been extensively studied (Corfield et al., 2001; Hoge et al., 1999a; Kemna et al., 2001; Maximillian et al., 1980; Ramsay et al., 1993; Shimosegawa et al., 1995). These findings can be divided into two models. The proportional model describes the functionally induced CBF change as being proportional to the basal CBF, resulting in a constant relative CBF change. The additive model describes the absolute CBF change as being constant and independent of the basal CBF. Which model is the most appropriate is still a source of controversy.
The dependence of the dynamic properties of the stimulus-induced hemodynamic response on basal CBF conditions has not been thoroughly explored. Some investigators have approached this problem theoretically by developing models to describe the dependence of the blood oxygenation level-dependent (BOLD) functional magnetic resonance imaging (fMRI) signal on the blood flow into the venous compartment of the vasculature (Buxton et al., 1998; Friston et al., 2000; Mandeville et al., 1999). According to these models, the hemodynamic response will be faster when the basal CBF is elevated and other parameters are kept constant (Friston et al., 2000). However, this prediction has not been demonstrated empirically and, in general, few studies have experimentally investigated the dependence of the temporal characteristics of metabolically induced hemodynamic changes on basal cerebrovascular conditions. Moreover, with one very recent exception (Kemna and Posse, 2001), most of these investigations have been conducted in anesthetized animals (Ances et al., 2001; Bakalova et al., 2001; Matsuura et al., 2000; Silva et al., 1999).
In this study, we used hypercapnia and hypocapnia to alter the global CBF baseline and compared the visually evoked BOLD responses to those obtained during normocapnia. We demonstrate that the magnitude and dynamic characteristics of the BOLD response in the visual cortex are a function of basal cerebrovascular conditions, and our data support the notion that the vascular changes brought about by changes in the arterial partial pressure of carbon dioxide (Pa
MATERIALS AND METHODS
General
The study was conducted in two separate sessions, one in which hypercapnia was induced and the other in which hypocapnia was induced. Seven subjects participated in both the hypercapnia and hypocapnia experiments. One subject's data were discarded owing to a poor signal-to-noise ratio. The results of the remaining six subjects (five women, one man; mean age, 30.8 ± 9.9 years) are reported. All participants were in good health. Informed consent was obtained from all subjects in accordance with the guidelines of the University of Minnesota Medical School's Institutional Review Board.
Each subject lay supine inside the magnet bore with his/her head situated in the surface coil such that the occipital cortex was centered in the coil loops. The sides of the head were packed with foam cushions to minimize head motion. A mirror was attached to the coil so that the subject could view a backlit projection screen, situated near the top of his/her head, on which the visual stimulus was presented from an LCD video projector (NEC Technologies, Inc., Itasca, IL, U.S.A.). The subject's pulse and respiration waveforms were continuously monitored with a pulse oximeter and a respiration belt, and these data were collected by a desktop computer running Acknowledge software (Biopac Systems, Inc., Santa Barbara, CA, U.S.A.). MRI data acquisition, visual stimulation, and physiologic recording were synchronized.
Magnetic resonance imaging
The experiments were performed in a 7-T magnet (Magnex Scientific, Abingdon, U.K.), controlled from a Varian Unity (Varian, Inc., Palo Alto, CA, U.S.A.) console, with a home-built, dual-loop quadrature surface coil (oval loop diameters = 10 × 7 cm; Adriany et al., 2000). Axial and sagittal scout images were obtained to assess proper head position, following which localized, automated shimming (Gruetter, 1993; Gruetter and Tkac, 2000) was performed to achieve a water proton line width of approximately 20 Hz or less over a spherical volume with a radius of 35 mm. Anatomic images were acquired with a 2-D, inversion-prepared fast low-angle shot (TurboFLASH) imaging sequence (repetition time [TR] = 0.011 seconds, echo time [TE] = 5 milliseconds, inversion time [TI] = 1.4 seconds, matrix size = 128 × 128, field of view = 18 × 18 cm2, slice thickness = 5 mm). From the sagittal anatomic images, a single oblique slice, positioned approximately parallel to the calcarine sulcus, was chosen for the fMRI experiments. Functional images were obtained with a T2*-weighted echo-planar imaging (EPI) sequence (TR = 0.333 seconds, TE = 25 milliseconds, matrix size = 64 × 64, field of view = 18 × 18 cm2, slice thickness = 5 mm). To achieve the desired echo time of 25 milliseconds in a single-shot image, a shifted gradient echo approach was used. This TE provides a maximal contrast-to-noise ratio at 7 T (Yacoub et al., 2001a). The radio frequency excitation pulse was calibrated to the Ernst flip angle of approximately 36 degrees within the primary visual cortex of each subject. At low flip angle, the contribution of inflow effects to BOLD signal change is minimal (Kim et al., 1994).
Experiment protocol
Each run of the combined fMRI (visual stimulation) and global CBF modulation experiment consisted of 1,305 images (7.25 minutes) during which the subject fixated on a small, red, circular fixation point on a uniform gray background of the approximate mean luminance of the visual stimulus. Following the first 90 control images, a visual stimulus was presented on the screen for four seconds every 135 images (45 seconds). The visual stimulus, generated by a Macintosh computer with Vision Shell software (St-Hyacinthe, Quebec, Canada), consisted of a full-field black-and-white checkerboard at 90% contrast, counter phase flickering at 4.5 Hz, with the same central fixation point described previously. During the fMRI studies, global blood flow was simultaneously modulated for 3 minutes by inducing hypercapnia or hypocapnia. Basal blood flow modulation started at the onset of the third stimulus and ended at the beginning of the seventh stimulus (i.e., between image numbers 361 and 900). The ET
During each run of the experiment, the subject's nose was closed with a nose clip and the subject breathed through a plastic mouthpiece. Air, either normal or enriched with 5% CO2, was filtered and humidified with a heat-moisture exchanger (Baxter Healthcare Corp., Deerfield, IL, U.S.A.) and delivered to the subject at approximately 15 to 25 L/min through corrugated tubing attached to the mouthpiece. For the 3-minute elevation of ET
Image postprocessing and data analysis
Functional images were corrected for artifacts due to heartbeat and respiration using a linear k-space phase correction algorithm (Pfeuffer et al., 2002) and/or a physiologic correction program (Hu et al., 1995). Data from experiment runs that were free of motion artifacts, determined by the absence of large, abrupt changes in the time series of the center of mass of the images, were averaged together to create one functional image time series for each subject. To reduce the incidence of false-positive activations outside of the brain and at large vessels, only those pixels whose standard deviation relative to the baseline signal during the initial control period was ⩽3% (Kim et al., 1994) were further analyzed. Active pixels were determined by performing a pixel-by-pixel cross-correlation analysis with a model hemodynamic response function using Stimulate software (Strupp, 1996). The hemodynamic response function was created by convolving a Poisson function with a boxcar train that emulated the visual stimulus time course (Friston et al., 1994). Pixels whose cross-correlation coefficient (cc) evaluated to P < 0.01 were considered active (Bandettini et al., 1993). With a vector of 1,294 points, a cc of 0.07 corresponds to a P value of 0.01 and a cc of 0.4 corresponds to a P value < 1 × 10⁻⁴ (Bandettini et al., 1993). A rectangular region of interest (ROI) was drawn in the posteromedial region of the cortex (Fig. 2a) to include approximately 75 of the active pixels (75.0 ± 1.3 pixels for the hypercapnia data; 74.0 ± 3.5 for the hypocapnia data). From these pixels, an average time course was generated.
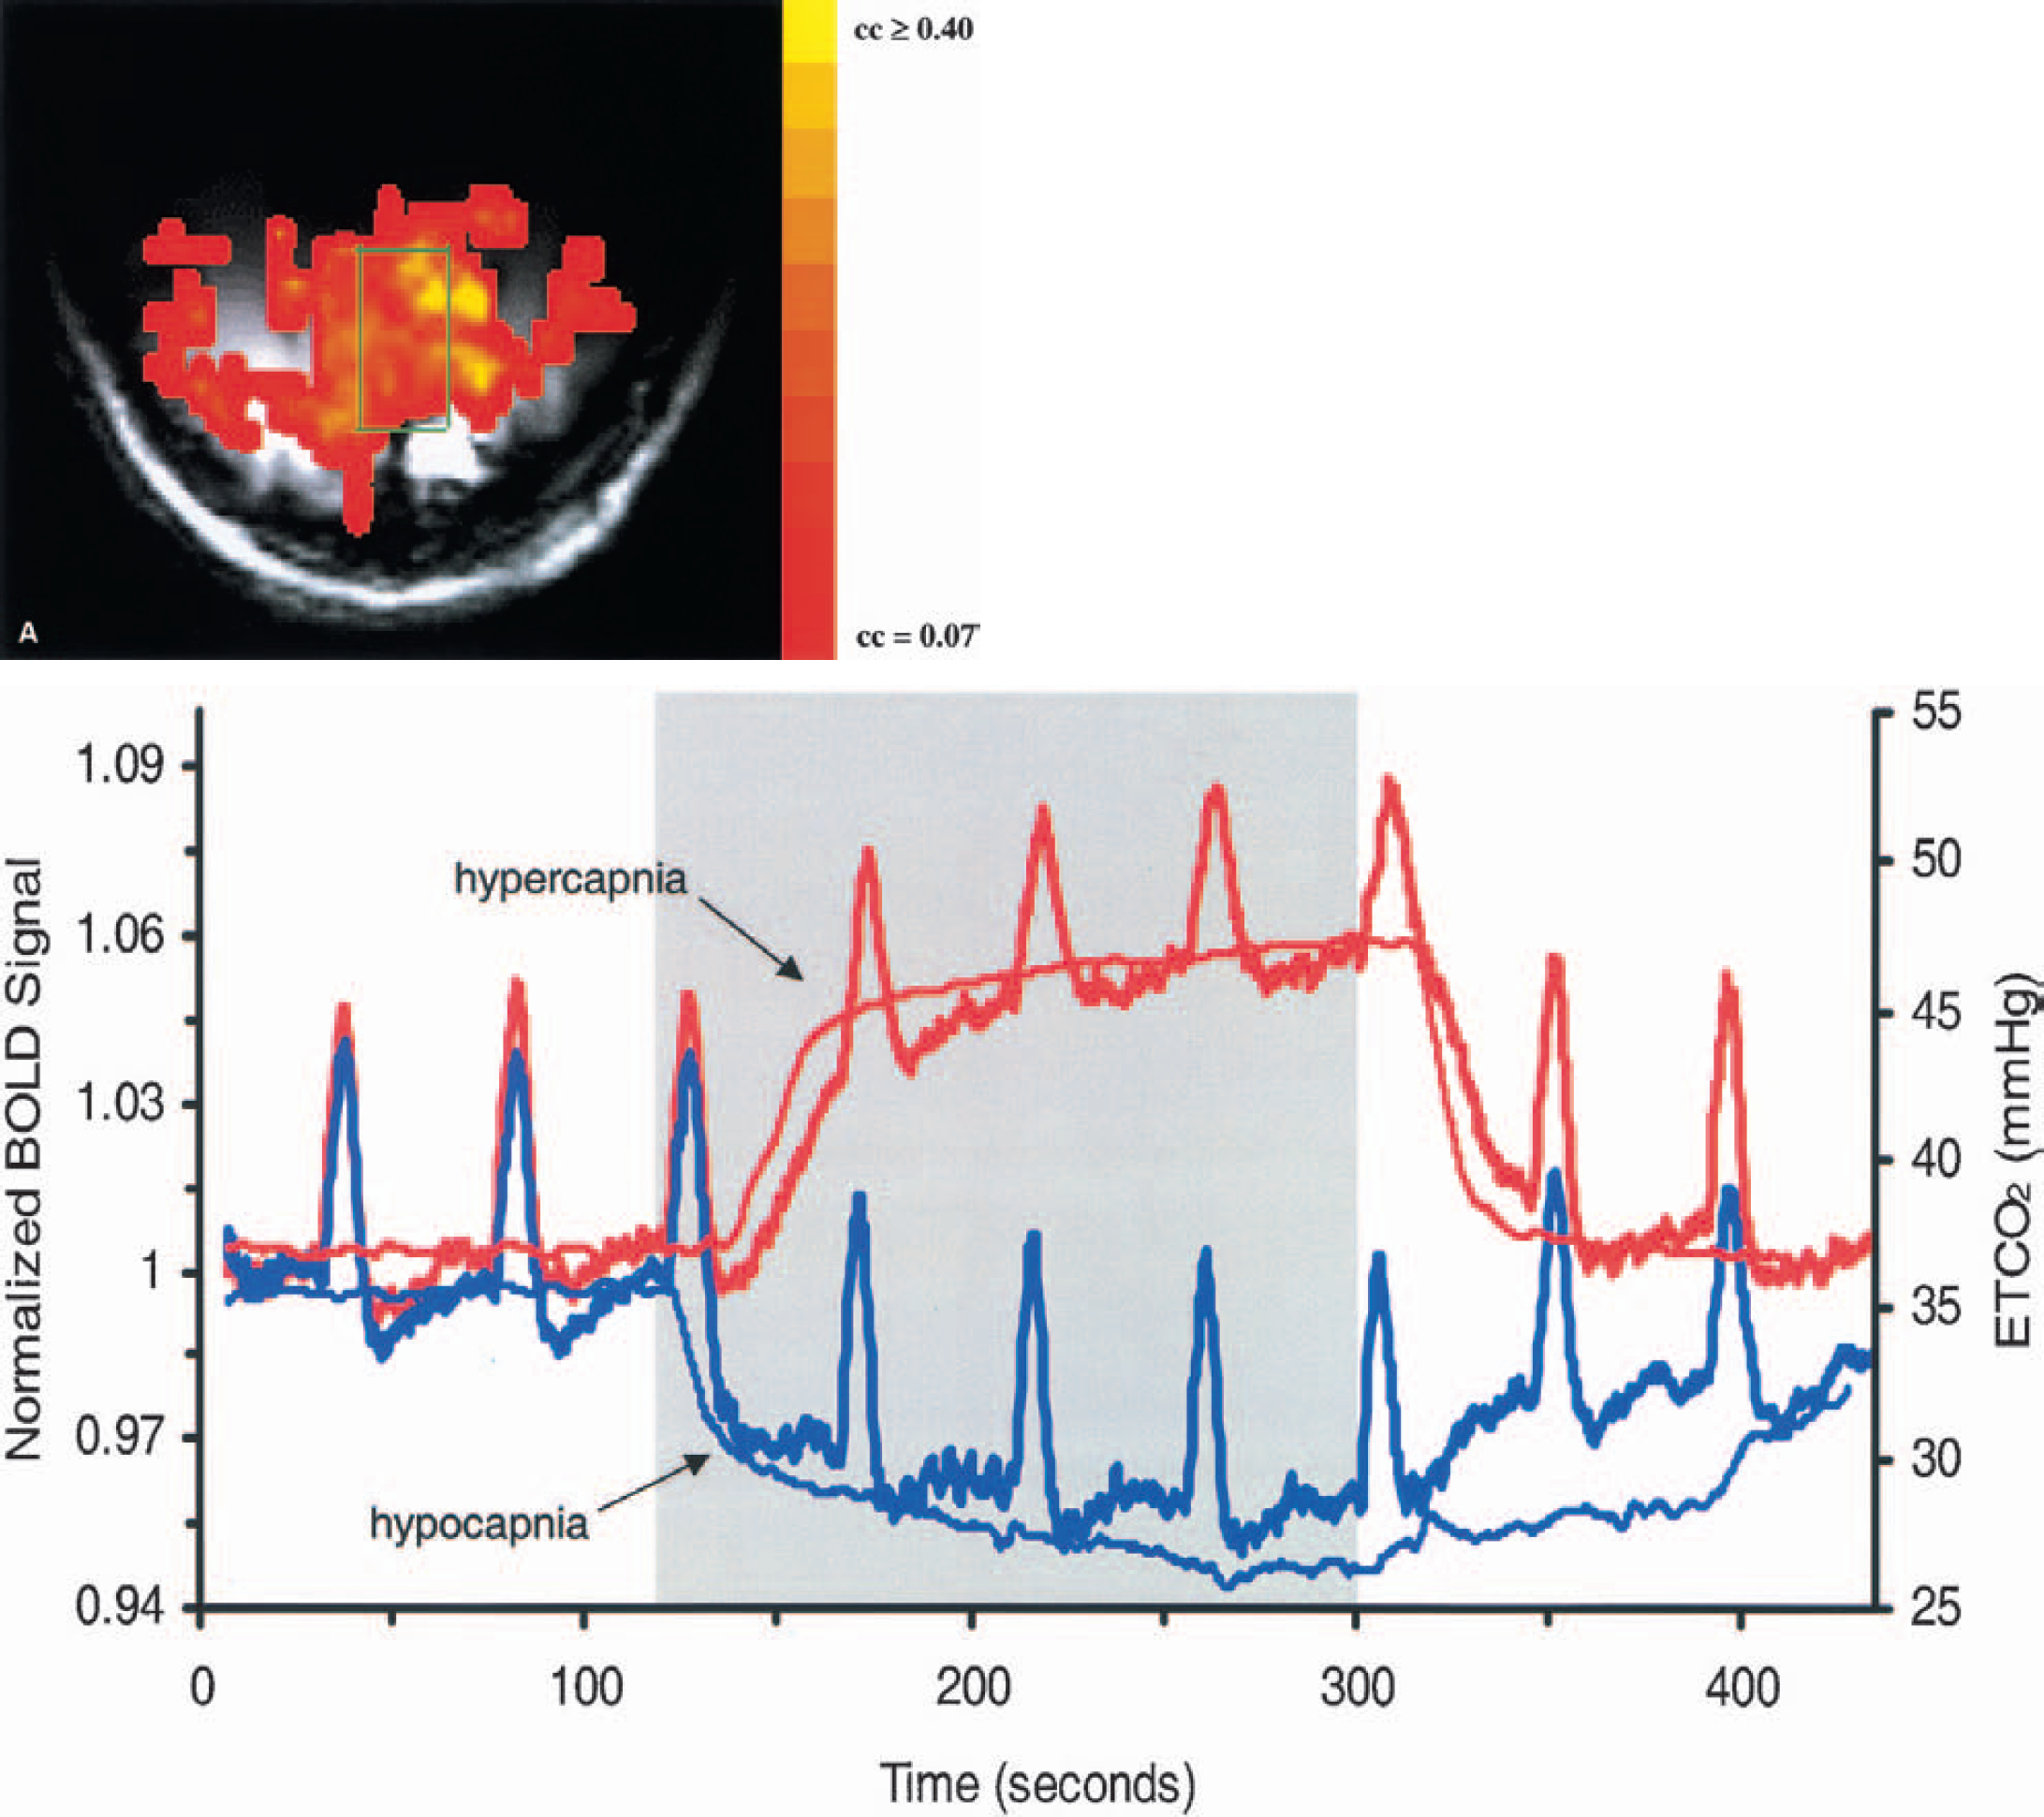
(A) A representative activation map, overlaid on a T1-weighted image, and a region of interest from which a time course was generated for this subject. The map colors correspond to cross-correlation (cc) values, coded according to the color bar.
The average time course from each subject was divided into nine epochs of 135 images, each epoch beginning 10 images prior to stimulus onset. A time course was considered as consisting of three periods: prehyper-/hypocapnia, hyper-/hypocapnia, and posthyper-/hypocapnia. Epochs that fell within transition periods from one condition to another were discarded. Hence, two prehyper-/hypocapnia epochs (referred to as normocapnia epochs), two hyper-/hypocapnia epochs, and one posthyper-/hypocapnia epoch from each subject were used for further analysis.
To accurately determine the magnitude and temporal characteristics of the hemodynamic response, each epoch was low-pass filtered with a finite impulse response filter with a Hamming window and a cutoff frequency of 0.45 Hz using programs written in Matlab (The MathWorks, Inc., Natick, MA, U.S.A.). The averaged time courses shown in the figures, however, have not been temporally filtered. The following parameters were calculated for the visually evoked BOLD response of each epoch: baseline signal, relative signal change (i.e., peak height), full-width-at-half-maximum (FWHM), normalized area of the BOLD response above baseline, onset time, time to 50% of peak height, time to 90% of peak height, and time-to-peak (TTP). The baseline signal was obtained from the mean MRI signal of the 10 images prior to stimulus onset relative to the mean signal of the 50 normocapnic images prior to the first stimulus of the entire run. The onset time was defined as the time to reach 10% of the peak height. The TTP is defined as the time from stimulus onset to the peak of the BOLD response. Data are reported as the mean ± one standard deviation. Data collected during the normocapnia epochs and hyper-/hypocapnia epochs were tested for significant differences by paired t-tests. Group data were assessed for linear trends by least squares regression using Matlab. Slopes were tested against zero and their statistical significances are reported as two-tailed P values (Mendenhall et al., 1990).
RESULTS
Physiologic and blood oxygenation level-dependent responses to hypercapnia and hypocapnia
The ET
Values of physiologic parameters
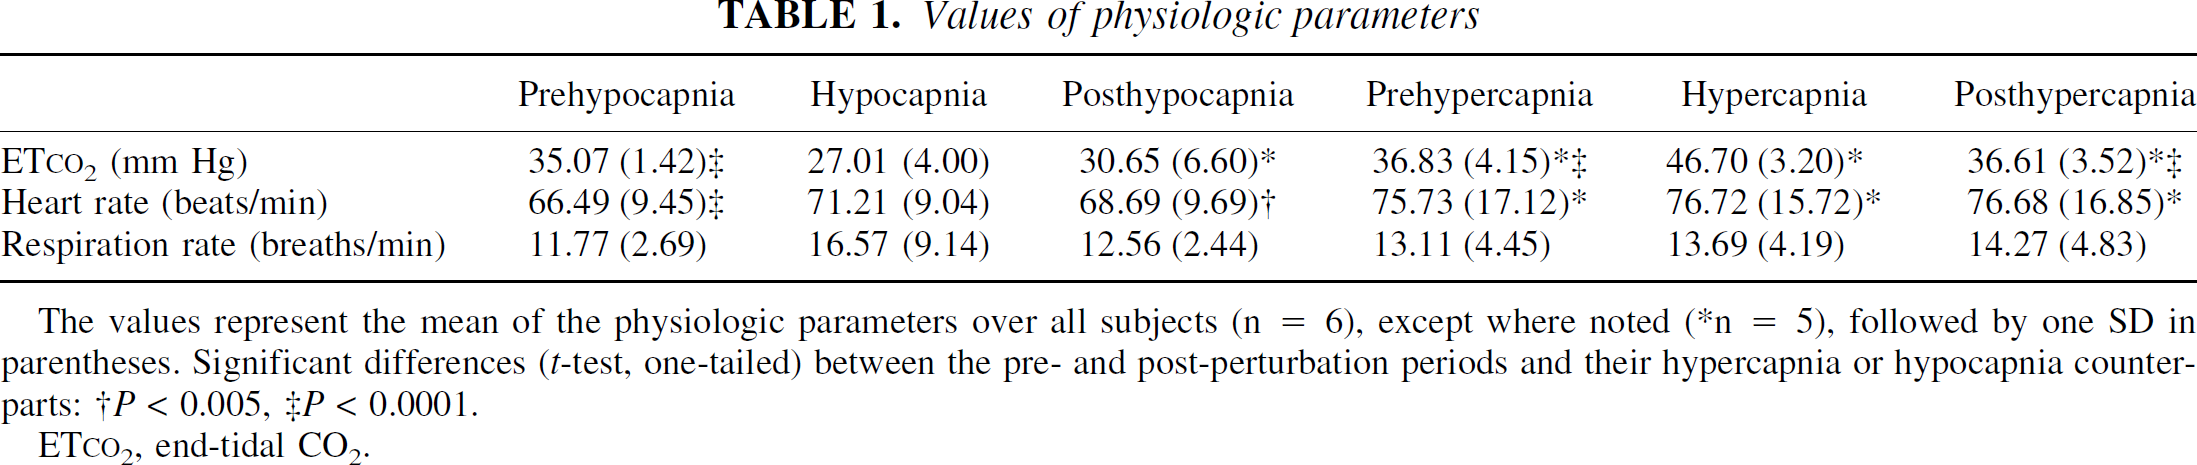
The values represent the mean of the physiologic parameters over all subjects (n = 6), except where noted (*n = 5), followed by one SD in parentheses. Significant differences (t-test, one-tailed) between the pre- and post-perturbation periods and their hypercapnia or hypocapnia counterparts: †P < 0.005, ‡P < 0.0001.
ET
In Figure 1, the normalized T2*-weighted baseline signal is plotted as a function of the average ET
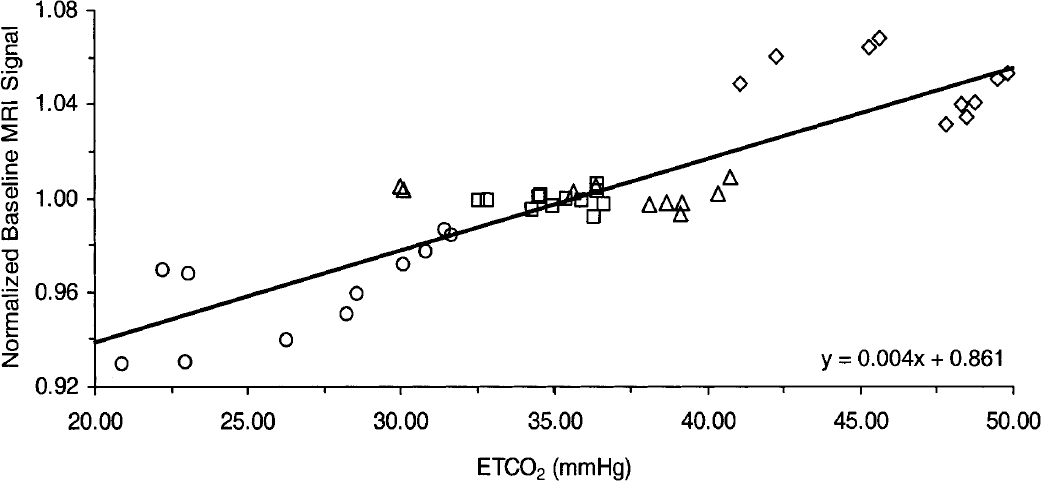
Normalized baseline magnetic resonance imaging (MRI) signal versus end-tidal CO2 (ET
Characteristics of the ETco2 and blood oxygenation level-dependent time courses
The BOLD time courses averaged over all six subjects are shown along with the average time courses of the ET
Before further analyzing changes in the magnitude and dynamics of the average signal, it was important to investigate whether all active pixels behaved similarly during the hypocapnic and hypercapnic conditions, respectively. Thus, stimulus-induced BOLD fMRI responses during prehypocapnia, hypocapnia, prehypercapnia, and hypercapnia were examined on a pixel-by-pixel basis. Data from two representative subjects are shown in Fig. 3. The relative peak height of the BOLD response during hypocapnia and hypercapnia (Figs. 3A and 3B) is plotted for each pixel versus its preperturbation normocapnic level. It can be seen that the majority of active pixels under each altered condition responded in relatively the same manner, shifting to larger amplitudes during hypocapnia and lower amplitudes during hypercapnia. Similarly, in Figs. 3C and 3D, the TTP of each pixel during hypercapnia and hypocapnia is plotted versus its preperturbation value. The general tendency is apparent, with the TTP becoming longer during hypercapnia and shorter during hypocapnia. The results of this analysis were similar for all subjects. This finding demonstrated that changes in the fMRI characteristics of all active pixels were similar, and that the average response of the active pixels is a reliable indicator of the cortical response.
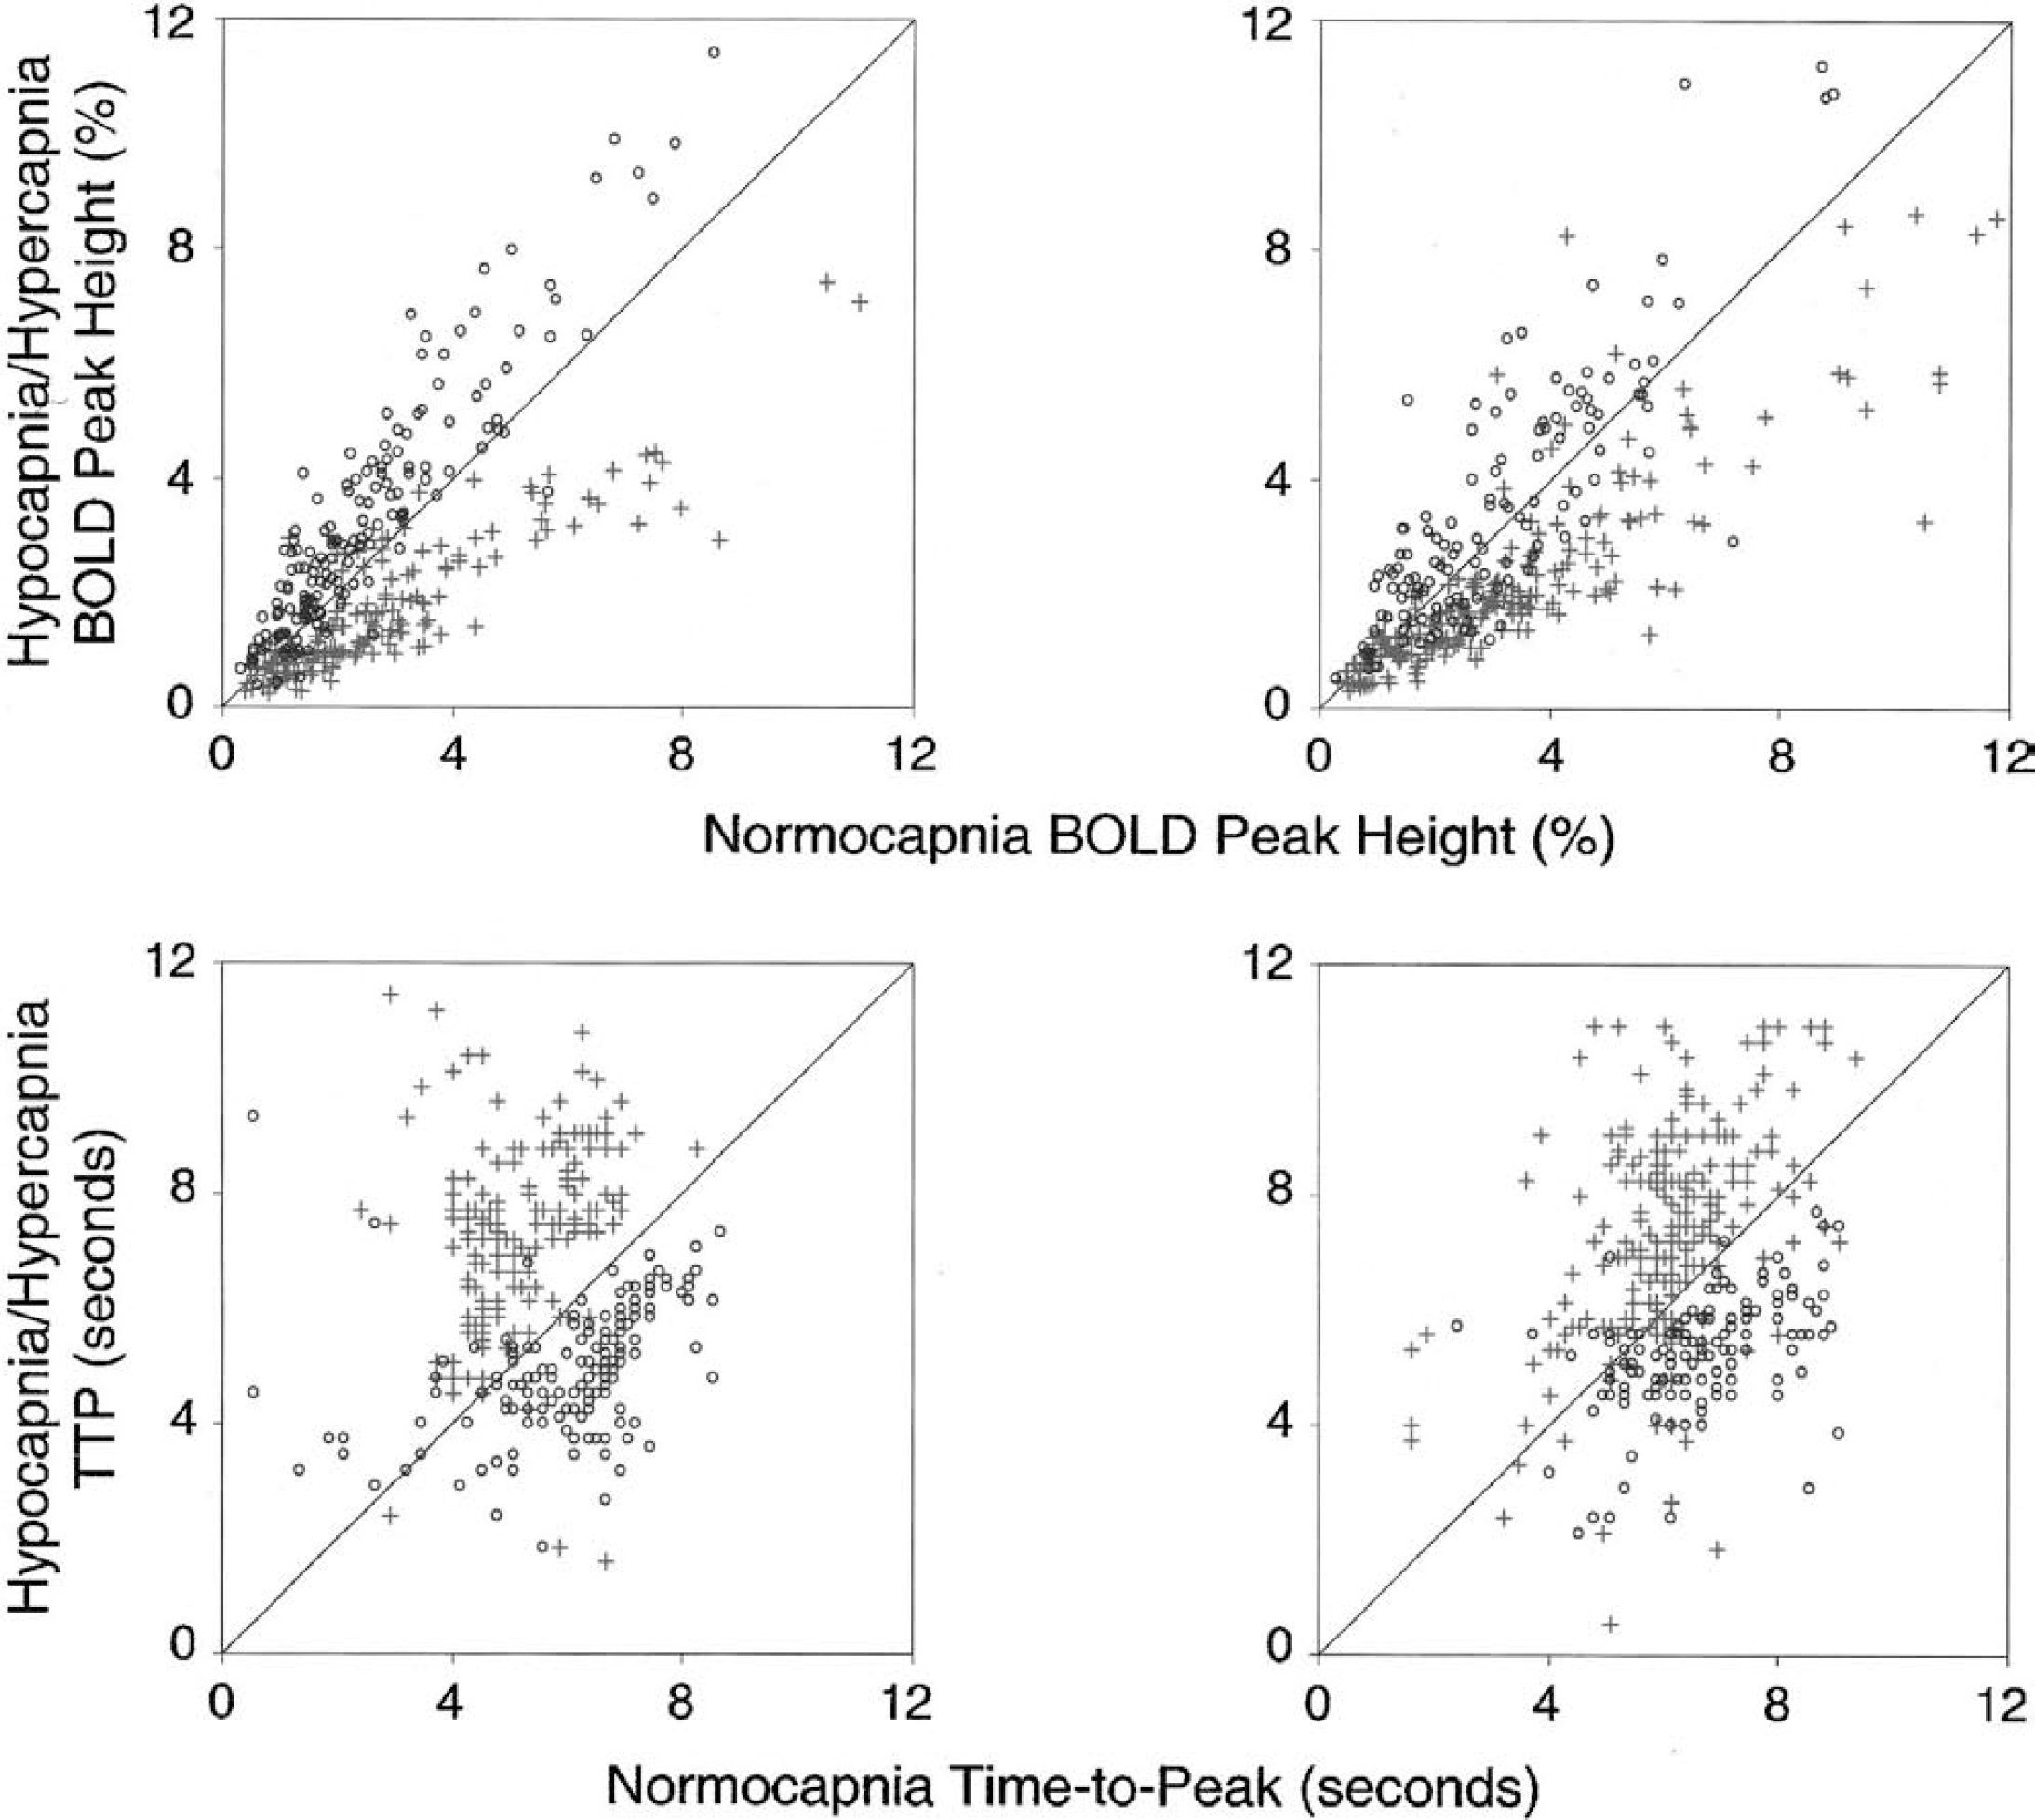
Percentage change in the blood oxygenation level-dependent (BOLD) response (
Each subject's average response was obtained from approximately 75 active pixels within a rectangular ROI in the posteromedial aspect of the visual cortex and subsequently used for intersubject averaging. Using a mean signal generated from a similar number of pixels with a high signal-to-noise ratio (i.e., pixels in V1 that were close to the surface coil) ensured that each subject's data were equally weighted. This compensated for potential biases arising from the fact that the signal-to-noise ratio varied across subjects and therefore activation maps for individual subjects generally contained different numbers of active pixels. It should be noted, however, that an analysis of the average of all active pixels was consistent with that described for the ROI-based approach.
The influence of the basal ET
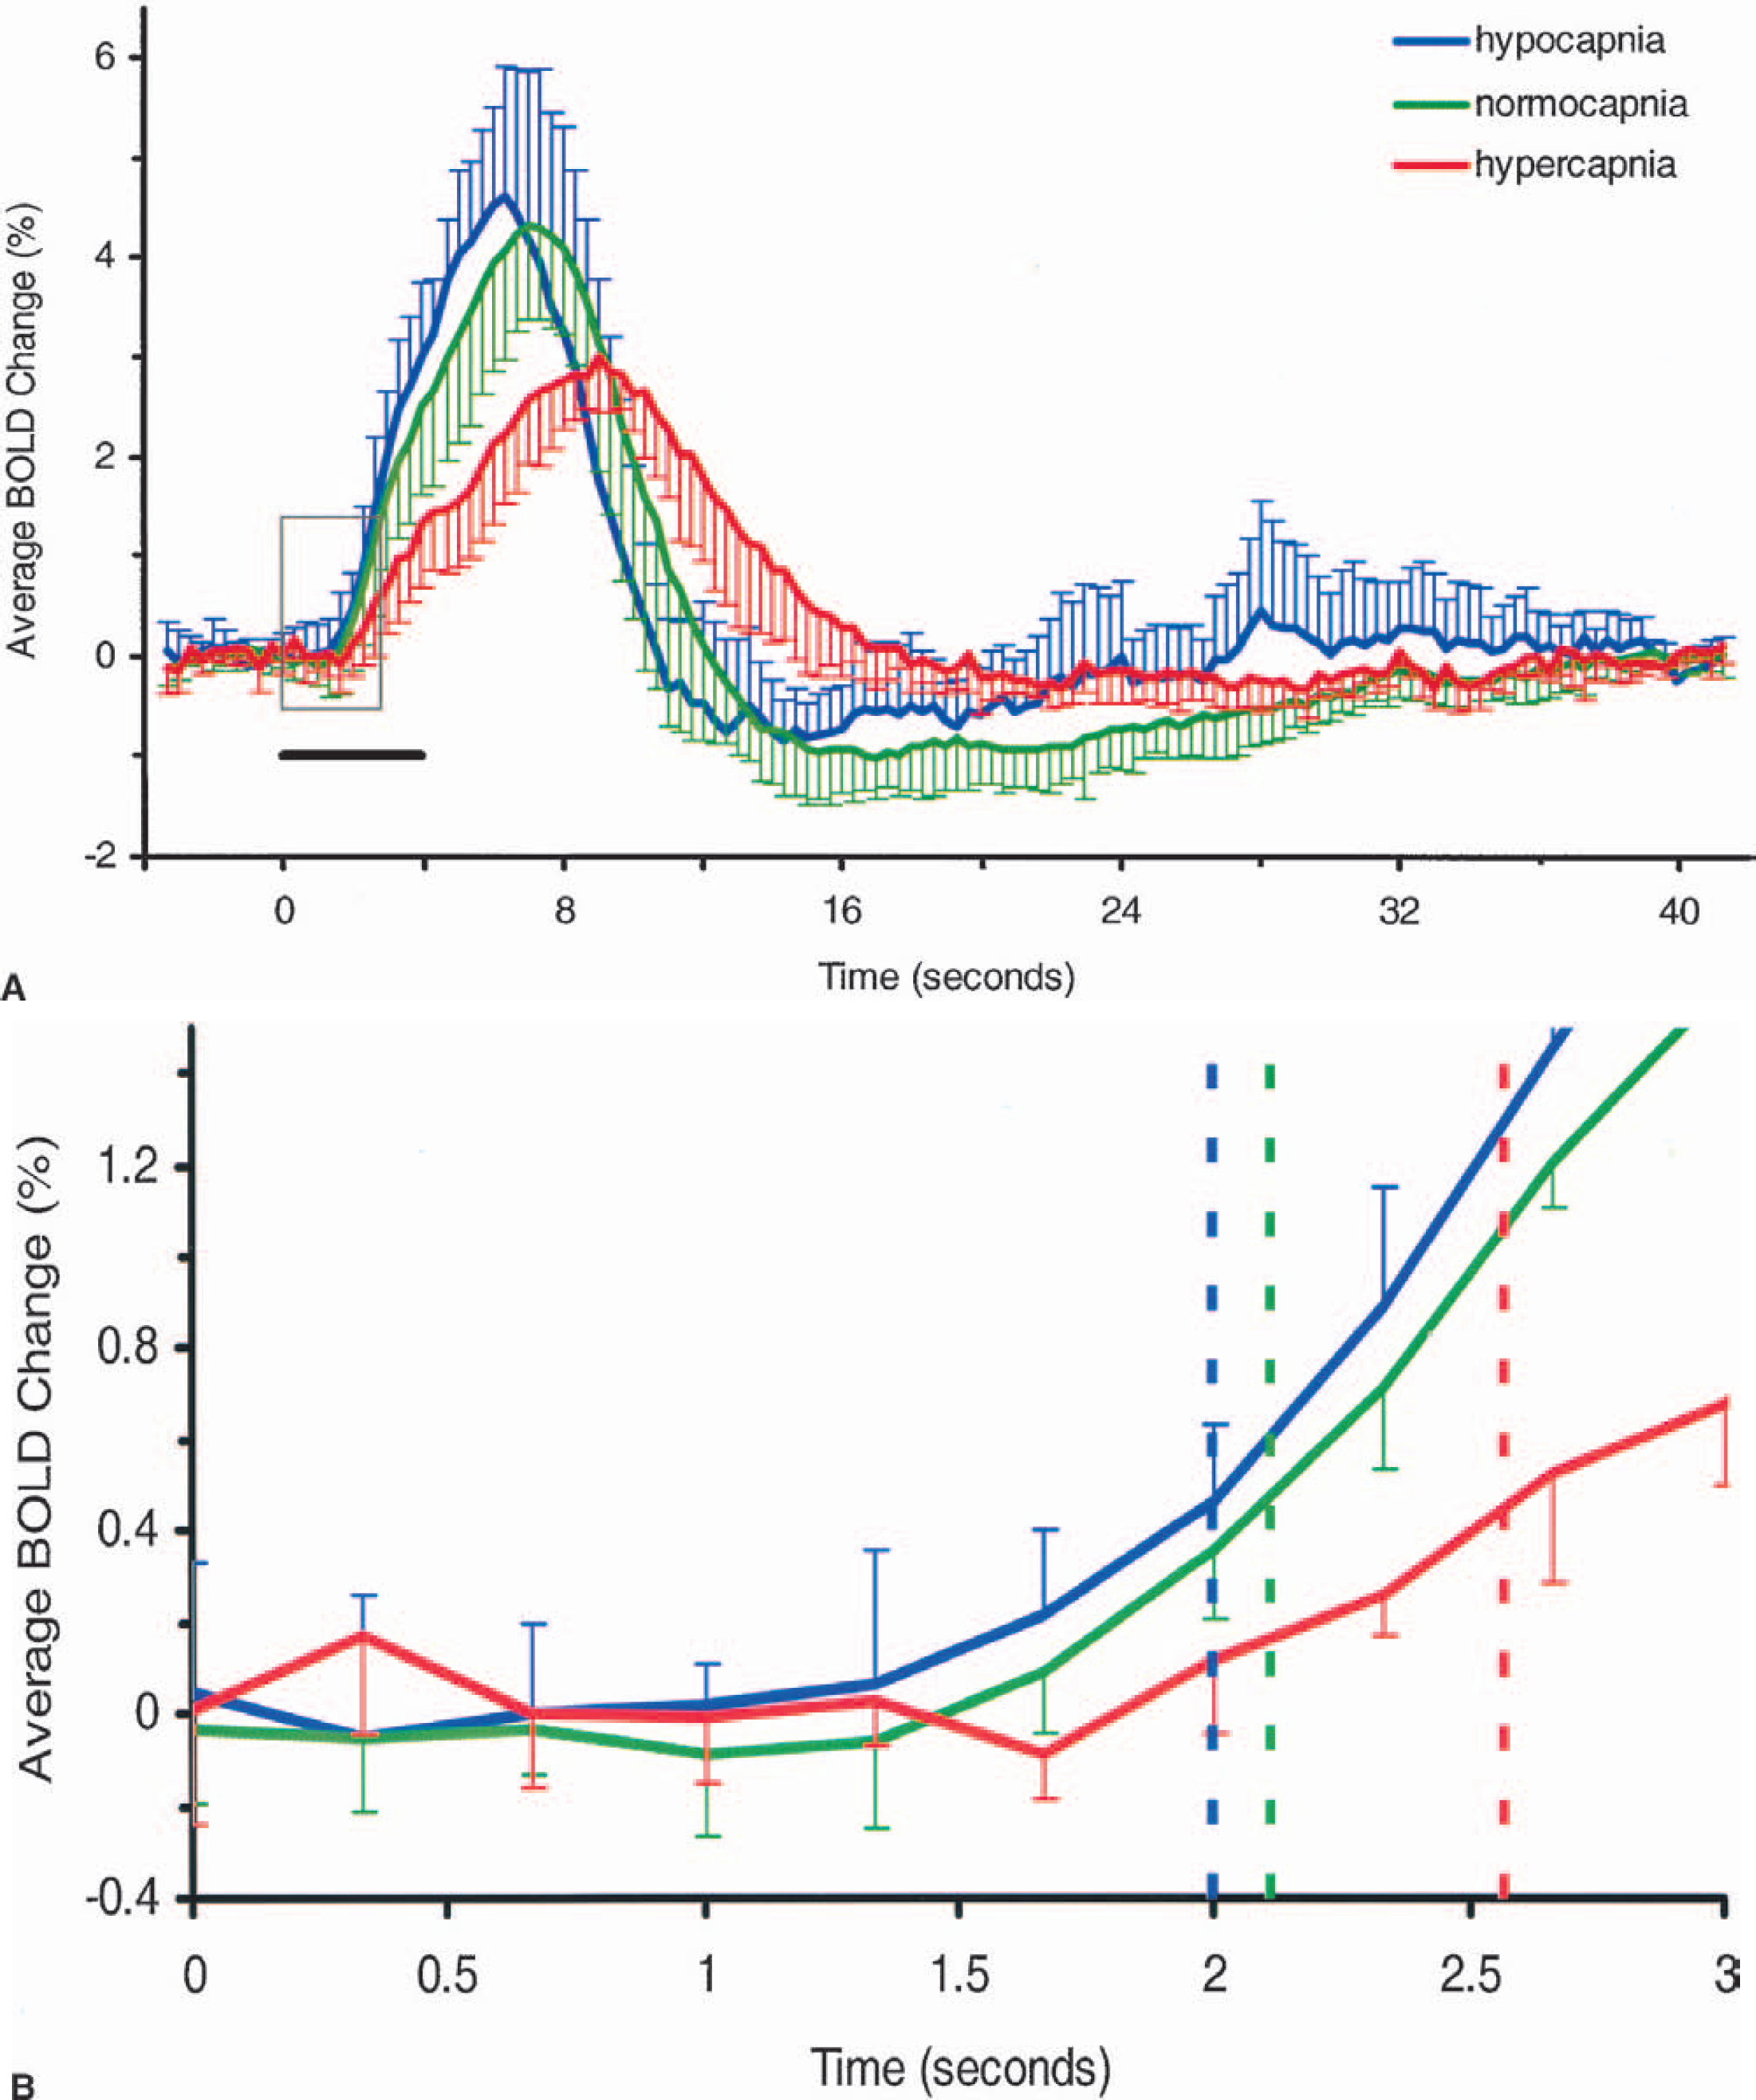
(A) Time courses, averaged over all subjects, of the visually evoked blood oxygenation level-dependent (BOLD) response during hypocapnia (blue; n = 6 subjects), normocapnia (green; n = 6 prehypocapnia subjects + 6 prehypercapnia subjects = 12 experiments), and hypercapnia (red; n = 6 subjects). The baselines have been normalized. Error bars represent one standard deviation of the means. Visual stimulation (gray bar) lasted 4 seconds starting from time 0. The time-to-peak (TTP) and width of the response clearly increase with end-tidal CO2 (ET
Characteristics of the visually evoked blood oxygenation level-dependent response at 3 ET
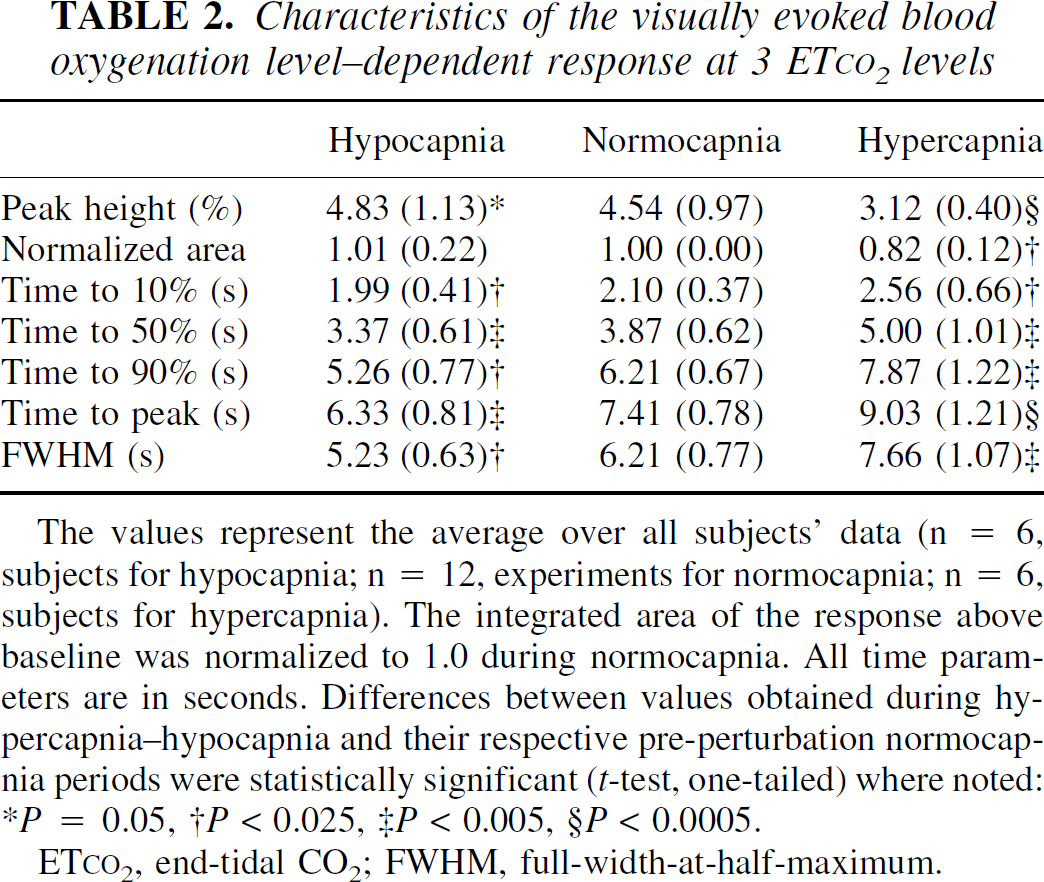
The values represent the average over all subjects' data (n = 6, subjects for hypocapnia; n = 12, experiments for normocapnia; n = 6, subjects for hypercapnia). The integrated area of the response above baseline was normalized to 1.0 during normocapnia. All time parameters are in seconds. Differences between values obtained during hypercapnia-hypocapnia and their respective pre-perturbation normocapnia periods were statistically significant (t-test, one-tailed) where noted: *P = 0.05, †P < 0.025, ‡P < 0.005, §P < 0.0005.
ET
In Figure 4, it is apparent that a poststimulus undershoot exists during hypocapnia and normocapnia but not during hypercapnia. An early negative response or “initial dip” following the onset of stimulation was not observed here under any basal condition. The initial dip has recently been observed in visual cortex at 7 T and its magnitude has been shown to increase with magnetic field strength (Yacoub et al. 2001b). It is unlikely, however, to detect the initial dip in humans in the average time course generated from a large ROI. Rather, a template of the initial dip must be used in the cross-correlation analysis to identify pixels exhibiting an early negative response (Yacoub et al. 2001b). Further, in order to detect the dip, extensive signal averaging is required. In our study, only limited signal averaging was performed and our cross-correlation template did not include a model of the initial dip. Hence, an early negative response is not apparent in the time courses presented here.
To further evaluate the dependence of the various estimated BOLD response parameters on the baseline signal and ET
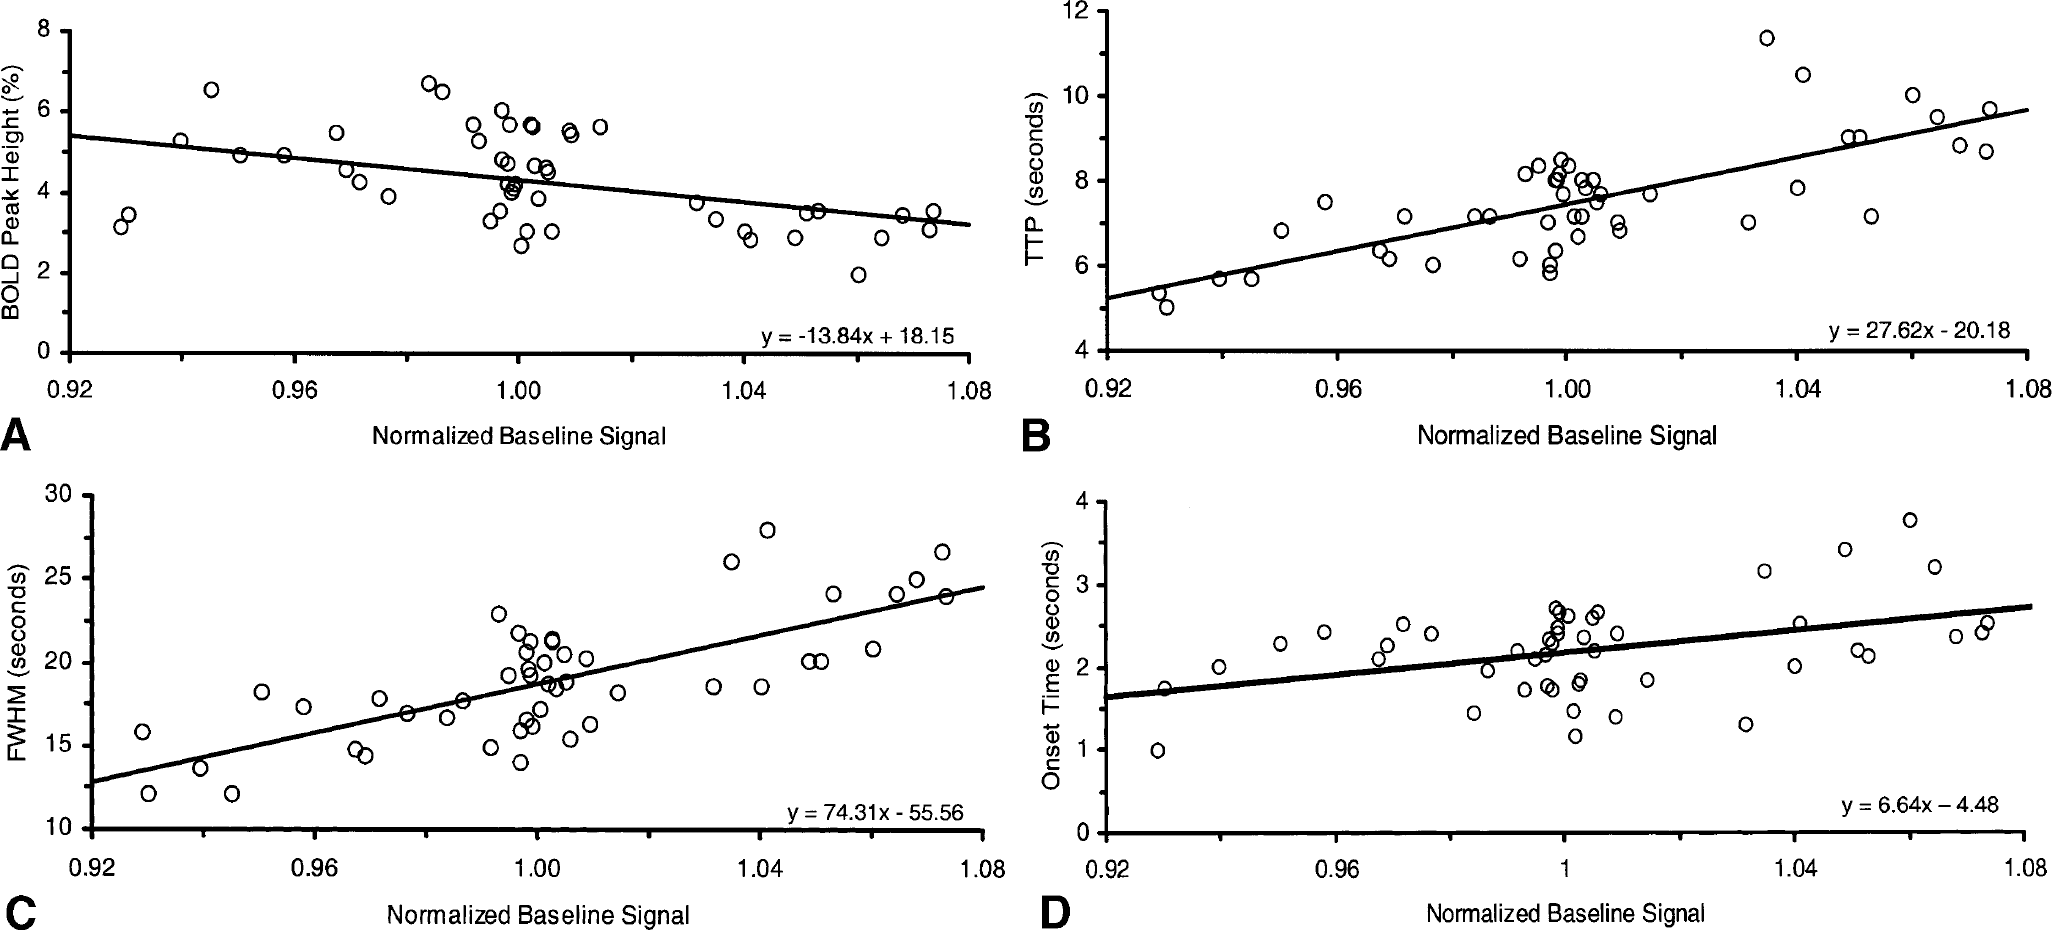
Dependence of visually evoked blood oxygenation level-dependent (BOLD) response on the normalized baseline signal. Dynamic and magnitude parameters of the BOLD response showed a significant linear dependence on the baseline signal. Individual data points (from two hypercapnia, four normocapnia, and two hypocapnia epochs for each of the six subjects) are plotted. Linear regression equations are displayed on the bottom right of the plots.
DISCUSSION
Effect of Paco2 on cerebral hemodynamics
The effects on the cerebral circulation of CO2, an end product of cellular metabolism, have been studied extensively and are well known (Grubb et al., 1974; Kety and Schmidt, 1948; Reivich, 1964). An increase in the blood CO2 level leads to a decrease in perivascular pH via the bicarbonate reaction. The tone of cerebral vascular smooth muscle is sensitive to the pH in the vicinity of the blood vessel such that a decrease in cerebral vascular resistance (vasodilation) occurs concomitantly with a decrease in extracellular pH. Therefore, an increase in Pa
Importantly, the cerebral metabolic rate of oxygen consumption (CMR
Effect of Paco2 on the magnitude of the stimulus-induced blood oxygenation level-dependent response
The effect of global CBF on the local hemodynamic response to neural activation has been studied with various techniques in both humans and animals. Two main hypotheses have emerged from human PET studies. The first states that local CBF changes induced by stimulation are independent of and additive to the global CBF (Friston et al., 1990; Maximillian et al., 1980; Ramsay et al., 1993). The other states that local changes depend on and are proportional to the global CBF such that the relative local changes remain constant (Kemna et al., 2001; Shimosegawa et al., 1995). CBF measurements made with MRI favor the additive hypothesis (Hoge et al., 1999a; Li et al., 1999; Li et al., 2000).
Human BOLD measurements have also provided conflicting results. Bandettini and Wong (1997) showed that the magnitude of the BOLD response to visual stimulation was attenuated during inhalation of 5% CO2. Similarly, Bruhn et al. (1994) using acetazolamide, a vasodilatory agent that acts by a mechanism related to that of CO2, also demonstrated a reduction in the visually evoked BOLD response when the baseline was elevated. However, the data of Hoge et al. (see Fig. 4b in 1999a) and Corfield et al. (2001) suggest that the absolute local BOLD response to visual activity is not affected by the global BOLD response, supporting the additive model. Posse et al. (2001) found a more complicated dependence of the local BOLD response on the global signal. The BOLD response was actually diminished at hypocapnic ET
Our data show a definite reduction in the local stimulus-induced BOLD response when the global BOLD level is elevated from its normocapnic level and an enhancement of the BOLD response when the global BOLD signal is lowered. These results are consistent with the findings of Bandettini and Wong (1997) and Bruhn et al. (1994) but contradict those of other studies (Corfield et al., 2001; Kemna and Posse, 2001; Posse et al., 2001; Weckesser et al., 1999). The discrepancy between our results and those of others may be due to the type of visual stimulus used, which was a flashing, red LED array in the studies by Posse's group (Kemna and Posse, 2001; Posse et al., 2001; Weckesser et al., 1999). The duration of the stimulus, which was shorter than ours in one case (Kemna and Posse, 2001) and longer in the others (Corfield et al., 2001; Posse et al., 2001; Weckesser et al., 1999), may also have contributed to varied results. Finally, and perhaps most importantly, methodologic differences in the manner and duration for which the ET
Furthermore, in our study, the BOLD response induced by a 4-second visual stimulus did not reach a steady state, and it is therefore not possible to draw definitive conclusions about the best steady-state model—additive or proportional—to describe the relationship between global and local hemodynamic signals. However, with this cautionary note, it is worthwhile to examine which model can best explain the observed pattern of the BOLD response. Seifritz et al. (2000) demonstrated theoretically that the BOLD response to stimulation would decrease with increasing CBF, but their calculations attributed a significant portion of the changes in the BOLD response to changes in total CBV, which did not address the issue of additivity versus proportionality of the CBF response. Here, we assume that the BOLD signal is linear with the change in venous oxygenation (Y) (Ogawa et al., 1993) and estimate the changes in neural activity-induced venous oxygenation by both the additive and proportional models. We set the normalized CBF during the normocapnic control period, CBFnormo(cont), equal to 1 and took the fractional venous oxygenation level during the control period, Ynormo(cont), to be 0.6. We assumed that the CBF during visual stimulation under the normocapnic condition, CBFnormo(stim), was 1.5 and that the ratio of CMR
Effect of Paco2 on the dynamics of the stimulus-induced blood oxygenation level-dependent response
We demonstrated a consistent slowing of the BOLD response to visual stimulation as the ET
Evidence to support this notion comes from a study conducted in our laboratory (Silva et al., 1999) employing forepaw stimulation of α-chloralose-anesthetized rats. Measuring the hemodynamic response with both CBF- and BOLD-based fMRI yielded similar results to those of the current study, suggesting that the slower BOLD response during hypercapnia occurs in conjunction with a slower CBF response. Other studies on α-chloralose-anesthetized rats measured the hemodynamic response to hind paw stimulation by laser Doppler flowmetry (LDF) under different global conditions (Ances et al., 2001; Bakalova et al., 2001; Matsuura et al., 2000). Matsuura et al. (2000) reported a delay in the decay rate of the response during hypercapnia and, using hyperoxia to decrease the baseline CBF, found a shortened rise time. Importantly, no difference in the local field potential was noted during the altered blood gas conditions. An increase in the TTP (Ances et al., 2001; Bakalova et al., 2001), the termination time (Bakalova et al, 2001), and the onset time (Ances et al., 2001) of the stimulus-induced LDF response under hypercapnia have also been reported. These studies confirm that the modulation of the hemodynamic response to neural activation under altered basal conditions originates on the arterial side of the circulation.
Further substantiation of the arterial origin of this phenomenon is the similarity between the dynamic BOLD signal changes and the results from human dynamic autoregulation studies using Doppler ultrasonography of cerebral arterial blood vessels. Dynamic autoregulation (Aaslid et al., 1989) is a term that describes the moment-to-moment (as opposed to steady-state) adjustment of arterial vascular resistance to meet the demands of sudden changes in arterial blood pressure. Aaslid et al. (1989) demonstrated that, during hypocapnia, the magnitude and rate of the dynamic autoregulatory response increased, whereas during hypercapnia the response was smaller and slower. Other studies of dynamic autoregulation reported similar results (Birch et al., 1995; Newell et al., 1996). A common mechanistic origin may explain the consistency between the results of these dynamic autoregulation studies (Aaslid, 1989; Birch et al., 1995; Newell et al., 1996) and our studies of the stimulus-induced BOLD response at different Pa
There are several chemical and mechanical factors that could affect the rate and magnitude of arterial smooth muscle relaxation and thereby cause a slowing in the arterial response to local neuronal activity. Metabolites such as ADP (Ashley et al., 1993), the concentration of the vasodilator nitric oxide (Carter et al., 1997), oxyhemoglobin (Carter et al., 1997), pH (Gardner and Diecke, 1988; Karaki and Weiss, 1981), and the load on muscle fibers (Lecarpentier et al., 1985) have all been shown in in vitro studies to affect the properties of muscle relaxation in a manner that is consistent with our findings and could have potentially played a role in producing the current results. Therefore, it is conceivable that the mechanical properties and chemical environment of the arterial vessels are altered enough as a consequence of changes in Pa
CONCLUSIONS
We have demonstrated that the local BOLD response induced by neural activity is closely related to the global baseline CBF. Thus, the fMRI response induced by neural activity may be susceptible to other intrinsic and extrinsic pharmacologic agents (e.g., oxygen, acetazolamide, caffeine, alcohol, adrenaline, and anesthetic agents). For example, caffeine and nicotine have known effects on CBF and may be commonly used by normal subjects participating in functional imaging studies. Other chemicals, such as ethanol and cocaine, are often studied for their effects on the central nervous system's response to external stimuli and are also recognized as having cerebrovascular effects. Finally, the controlled physiologic conditions of anesthetized animals during functional imaging studies may vary considerably within and across animals. When the stimulus-induced fMRI response is compared under different physiologic or pharmacologic states, investigators must distinguish between effects resulting from altered neural activity and those resulting merely from global hemodynamic influences (Tracey, 2001). To this end, proper control experiments (e.g., Pa
Footnotes
Acknowledgements
The authors thank Sandi Johnston from the Department of Cardiopulmonary Services at Fairview-University Medical Center for her valuable help in setting up the gas-delivery system. The authors also thank J. Thomas Vaughaun, Gregor Adriany, and Peter Andersen from the CMRR for hardware and technical support.