
Abstract
Generalized epileptic seizures produce widespread physiological changes in the brain. Recent studies suggest that “generalized” seizures may not involve the whole brain homogeneously. For example, electrophysiological recordings in WAG/Rij rats, an established model of human absence seizures, have shown that spike-and-wave discharges are most intense in the perioral somatosensory cortex and thalamus, but spare the occipital cortex. Is this heterogeneous increased neuronal activity matched by changes in local cerebral blood flow sufficient to meet or exceed cerebral oxygen consumption? To investigate this, we performed blood oxygen level-dependent functional magnetic resonance imaging (fMRI) measurements at 7T with simultaneous electroencephalogram recordings. During spontaneous spike-wave seizures in WAG/Rij rats under fentanylhaloperidol anesthesia, we found increased fMRI signals in focal regions including the perioral somatosensory cortex, known to be intensely involved during seizures, whereas the occipital cortex was spared. For comparison, we also studied bicuculline-induced generalized tonic-clonic seizures under the same conditions, and found fMRI increases to be larger and more widespread than during spike-and-wave seizures. These findings suggest that even in regions with intense neuronal activity during epileptic seizures, oxygen delivery exceeds metabolic needs, enabling fMRI to be used for investigation of dynamic cortical and subcortical network involvement in this disorder.
Thalamocortical networks are central to the functioning of the forebrain, and are capable of generating a variety of normal and abnormal activity patterns. Neuronal action potential firing and neurotransmitter release in these networks create metabolic demands that must be met by commensurate changes in oxygen and glucose delivery. Recent work has investigated the coupling between neuronal activity, metabolic demands, and cerebral blood flow (CBF), which allows delivery of needed substrates for ongoing neuronal work (Dirnagl, 1997; Hyder et al., 2000; Kida et al., 2000; Mintun et al., 2001; Shin, 2000; Smith et al., 2002; Sokoloff, 1981). However, the capacity to match increased neuronal activity, oxygen use, and delivery has not been thoroughly investigated under abnormal conditions such as epileptic seizures.
Absence seizures (petit mal) and generalized tonic-clonic seizures (GTCS)(grand mal) are two forms of generalized seizures involving thalamocortical networks (Avoli et al., 1990). Absence seizures are brief staring spells, occurring most commonly in children, which are accompanied by large-amplitude synchronized spike-and-wave discharges (SWD) on electroencephalography (EEG). GTCS are accompanied by more intense neuronal firing, with sustained discharges during the tonic phase and interrupted bursts in the clonic phase, resulting in generalized convulsive motor activity. Greatly increased neuronal firing rates occur in the cortex and thalamus during GTCS and during the spike component of SWD (Avoli et al., 1990; Blumenfeld and McCormick, 2000; Kostopoulos et al., 1981; Matsumoto and Marsan, 1964). Does oxygen delivery increase sufficiently to meet the brain's metabolic needs during this intense abnormal activity? Are increases in oxygen delivery during generalized seizures truly generalized throughout the entire brain, or do increases occur preferentially in focal regions where increased neuronal firing is most intense? How do increases in oxygen delivery differ between low-intensity epileptic events such as SWD and high-intensity events such as GTCS?
Investigation of dynamic changes in brain activity has been greatly facilitated in recent years by the development of neuroimaging techniques such as blood oxygen level-dependent functional MRI (BOLD fMRI). The BOLD signal reflects the balance between oxygen consumption and delivery, and also is dependent on cerebral blood volume (Hyder et al., 2001; Ogawa et al., 1998; van Zijl et al., 1998). Under normal conditions, increased neuronal activity is linked to increased metabolism, which in turn causes an oversupply of increased CBF (Rothman et al., 2002; Shulman et al., 2002). Thus, increased oxygen delivery normally exceeds metabolic needs, causing an increase in the steady-state BOLD signal (i.e., blood oxygenation increases), although it should be noted that some aspects of the relationship between increased oxygen metabolism and increased CBF under transient situations remains controversial. To investigate the balance between oxygen delivery and metabolism in cortical and subcortical structures during epileptic seizures, we performed BOLD fMRI experiments with simultaneous EEG recordings in Wistar albino Glaxo rats of Rijswijk (WAG/Rij), a well-established animal model of generalized epilepsy (Coenen et al., 1992; Meeren et al., 2002). WAG/Rij rats exhibit spontaneous episodes of staring and unresponsiveness accompanied by SWD, which resemble human absence seizures in terms of both behavior and sensitivity to epilepsy drugs. We measured BOLD fMRI changes throughout the brain during episodes of SWD compared to baseline, and used simultaneous EEG recordings to correlate the dynamics of oxygenation changes. We also performed BOLD fMRI in the same model during bicuculline-induced GTCS, and compared the changes to those observed during SWD. With this approach, we were able to determine the temporal dynamics and spatial distribution of changes in oxygen delivery to the brain during these two types of generalized seizures.
MATERIALS AND METHODS
Animal preparation and electroencephalographic recordings
The experiments were performed on 16 adult female rats (12 WAG/Rij and 4 Wistar) aged 120 to 240 days with an average weight of 190 ± 18 g (mean ± SD). The WAG/Rij rat colony at our institution originated from the Radiobiological Institute, TNO, in Rijswijk (Reinhold, 1966), and Wistar rats were from Charles River Laboratories (Wilmington, MA, U.S.A.). Anesthesia was induced with 1.5% halothane and then switched to fentanyl (Abbott Laboratories, North Chicago, IL, U.S.A.) 40 μg/kg intravenously + haloperidol (Novaplus, Irving, TX, U.S.A.) 1 mg/kg intraperitoneally every 45 minutes, because fentanyl-haloperidol anesthesia does not suppress SWD (Pinault et al., 1998). A tracheostomy was performed, and the animals were artificially ventilated. The femoral artery was cannulated with a fine plastic catheter for continuous blood pressure, blood gas (pO2 and pCO2) and pH monitoring. These parameters were maintained within physiologic limits throughout the experiment by adjusting the artificial ventilation and depth of anesthesia. A femoral vein catheter and an intraperitoneal line were placed for drug delivery. All animals were paralyzed with repeated intraperitoneal injections of d-tubocurarine chloride 0.5 mg·kg−1·h−1. Body temperature was monitored with a rectal thermometer and kept constant at 37°C by a heating pad.
The animal was placed in a specially designed holder with the head fixed and bregma positioned at the center of the surface coil. The intervening skin and underlying tissues were removed over the skull vertex. To record EEG, while minimizing the MRI signal distortion, we used a pair of carbon-filament electrodes (diameter = 1 mm; WPI, Sarasota, FL, U.S.A.) placed laterally between the scalp and the outside surface of the skull, in the right frontal and occipital areas. To minimize the mechanical transmission of acoustic vibrations from the MRI scanner and to reduce artifacts in the EEG that can be caused by any movements of the electrode wires in the high magnetic field, we fixed the EEG wires to the lateral surface of the holder, and bound them together using plastic adhesive tape. To further reduce artifacts, the wires were kept as straight as possible, and were supported at a single point on vibration-damping foam as they exited the Faraday cage surrounding the MRI acquisition system. EEG signals were amplified with a Grass Data Recording System Model 79D (Grass Instruments Co., Quincy, MA, U.S.A.) located outside of the Faraday cage, and filtered with low and high cut-offs at 1 Hz and 300 Hz, respectively. EEG signals were then digitized at 1 kHz and processed with CED 1401 interface using Spike 2 software (Cambridge Electronic Design, Cambridge, UK). Residual high-frequency artifacts in the EEG related to MRI data acquisition were removed by digital filtering as described below.
In four WAG/Rij rats, after acquiring enough data sets with spontaneous SWD (at least 40 minutes of recording), and in four Wistar control rats, GTCS were induced by bolus injection of 0.2 mg bicuculline intravenously. Two to three injections were performed in each rat, with a stabilization period of at least 30 minutes between the end of each seizure and the next bicuculline injection.
MRI data acquisition
All MRI and fMRI data were acquired on a 7T AVANCE (Bruker, Billerica, MA, U.S.A.) horizontal-bore (12-cm-diameter working space) spectrometer, equipped with actively shielded shim/gradient coils (18 G/cm) operating at 300.3 MHz for 1H. The transceiver system consisted of a 1H resonator (8 cm) for transmission of radiofrequency pulses and an orthogonally oriented 1H surface coil receiver (1 cm). The two magnetically isolated coils were positioned orthogonally relative to one another such that the homogeneous regions of the two coils coincided, which minimized sensitivity losses in the receiver coil and permitted localized shimming as well as homogeneous transmission.
High spatial resolution anatomic MRI data were acquired in the coronal plane with gradient echo image contrast using the following parameters: flip angle = 10°; recycle time = 100 ms/slice for 8 slices; TE = 20 ms; image matrix (x, y) = 128 × 128; slice thickness = 1,000 μm; slice-separation = 1,000 μm; in-plane resolution (x, y) = 108 × 108 μm; field of view = 1.38 × 1.38 cm. We recorded fMRI data with echo-planar imaging using sequential sampling (Hyder et al., 1995). The single-shot echo-planar imaging spatial resolution was 430 × 430 × 1,000 μm3 for an image-matrix of 32 × 32 in the coronal plane. Spin echo echo-planar imaging data were obtained with the following parameters: excitation flip-angle = 90°; inversion flip-angle = 180°; recycle time = 125 ms/slice (total of 8 slices); echo time = 45 ms; slice thickness = 1,000 μm; slice-separation = 1,000 μm; field of view = 1.38 × 1.38 cm. Epochs of 8 slices/s interleaved with 5 seconds of electrical recordings were obtained for continuous intervals of 10 to 20 minutes of simultaneous fMRI and EEG data acquisition. The data were then transferred offline to a PC for further processing.
EEG and functional magnetic resonance imaging data analysis
Modulation of radio frequency pulses and magnetic field gradients induce artifacts in the EEG signal at high and low frequencies, respectively (Allen et al., 2000; Goldman et al., 2000). Although low-pass filtering of the EEG signal can remove the artifacts induced by modulation of radiofrequency pulses, the artifact amplitude of the gradient-induced signal can be significantly reduced by optimizing the maximum loop area of the electrodes. We were able to reduce this artifact induced into our electrodes from 2,000 μV (peak-to-peak) to less than 50 μV (peak-to-peak).
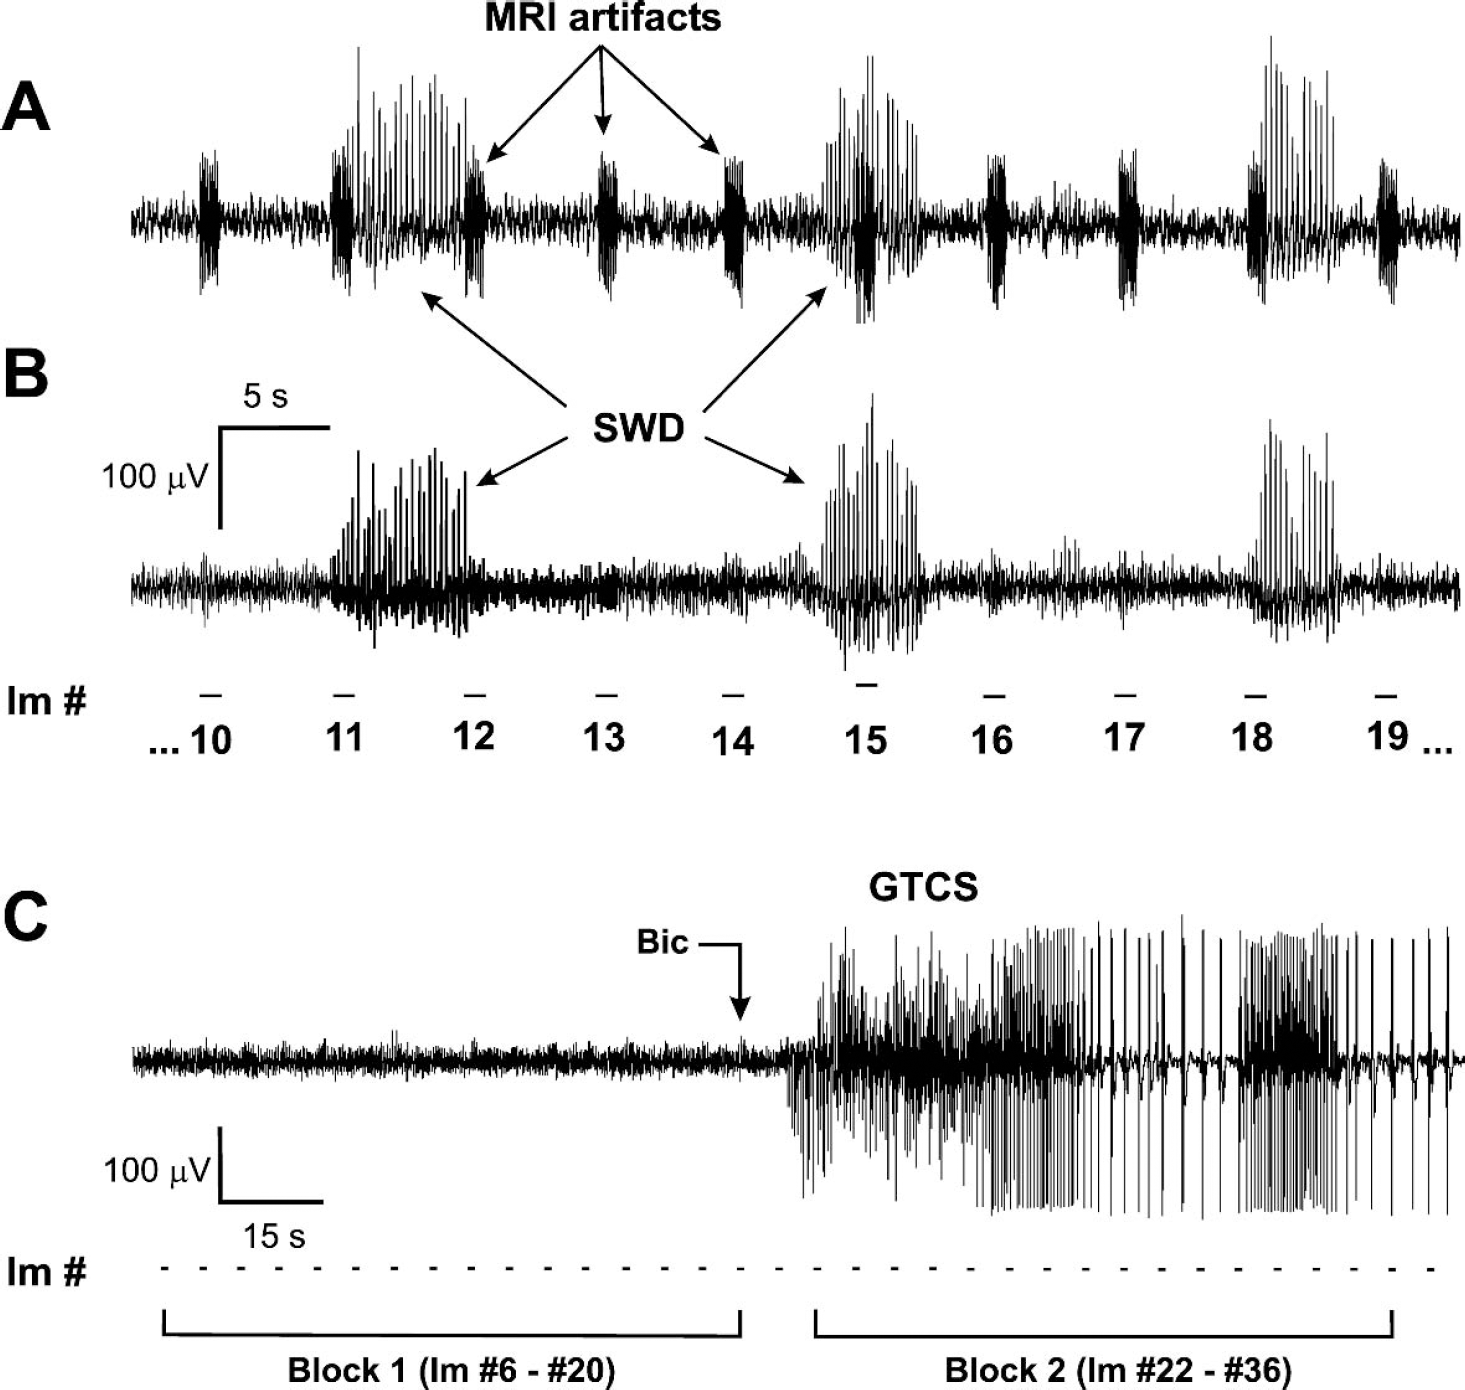
The EEG data were further processed offline using Spike 2 software. Additional low-pass filtering with 30- to 50-Hz cutoff was applied to reduce the remaining scanner artifact (Figs. 1A and 1B) and to eliminate electromyographic artifact picked up by electrodes from occasional tonic contractions of the temporal muscles. Although there was also some ballisto-cardiogram artifact, we found that it was sufficiently low in amplitude to allow reliable identification of epileptic spikes, and we did not use any special procedure to remove it.
Simultaneous EEG and fMRI recordings.
All image analysis was performed using software written by one of the authors (FH) on a MATLAB R11 (Natick, MA, U.S.A.) platform (Yang et al., 1998). Although all animals were kept anesthetized and paralyzed throughout the experiment, sometimes we observed slight movements of the tail and fur, especially during strong and long-lasting GTCS. Therefore, each 10- to 20-minute block of consecutive images was screened for movement artifact, using dynamic center of mass analysis, and all data sets exhibiting significant movement (more than one third of a pixel in either plane of the center of mass image) were removed from analysis. The center of mass analysis was restricted to voxels within the brain boundary.
Our previous measurements of CBF changes during spontaneous SWD using regional laser Doppler flowmetry have shown that typical SWD duration under these conditions is 2 to 9 seconds, and that CBF increases during SWD, reaching its maximal value approximately 3 to 4 seconds after SWD onset, and then gradually decreases to baseline within approximately 3 to 4 seconds after SWD end (Nersesyan et al., 2003a). As described below, our pixel-based measurements of BOLD signal changes during SWD had a similar time-course. Therefore, to construct functional maps of BOLD signal changes during SWD compared to baseline, we assumed as a first approximation that each BOLD image acquisition should be related mainly to SWD occurring in the preceding 5-second EEG interval (Fig. 1B). To analyze changes in BOLD signals during SWD compared to baseline, we identified pairs of consecutive images and associated pairs of consecutive EEG intervals with the following characteristics (Fig. 1B): (1) the first EEG interval contained quiet EEG baseline for the entire 5 seconds preceding acquisition of a given image, Bi; and (2) the second EEG interval contained SWD, and the SWD continued up to the time of the subsequent image, Ai, or ended no more than 2 seconds before the next image acquisition. In this manner, we selected pairs of images with Bi representing baseline immediately preceding SWD and Ai representing images during SWD. Each data acquisition lasted 10 to 20 minutes, and only data sets containing at least 5 image pairs of this kind per run were analyzed. We then constructed t-maps contrasting the set of baseline images Bi to SWD images Ai on a pixel-by-pixel basis. To ensure that the changes we saw were not caused by random fMRI signal fluctuations, we also conducted the same analysis by selecting pairs of consecutive EEG intervals in which both images within the pair contained quiet EEG baseline for the entire 5-second interval. We performed these control analyses using the same number of image pairs from the same run as each analysis of SWD images.
Generalized tonic-clonic seizures have a very different time-course in comparison to SWD. They begin with the abrupt onset of sustained, high-frequency neuronal firing during the tonic phase, followed by rhythmic high-frequency firing in the clonic phase (Avoli et al., 1990; Matsumoto and Marsan, 1964), with a total duration lasting several minutes. In this case, to compare baseline versus seizure activity during bicuculline-induced tonic-clonic seizures, we used a different, block versus block, approach (Fig. 1C). We calculated t-maps by comparing the continuous set of baseline images Bi acquired during the 90 seconds immediately preceding the bicuculline injection to the set of images Ai acquired during the first 90 seconds after seizure onset.
To analyze the temporal relationship between BOLD fMRI signal changes from the baseline (ΔS/S) and EEG signals, we plotted ΔS/S for individual voxels over time on the same time scale as the simultaneously acquired EEG recordings (as in Figs. 3 and 4B). To determine the anatomic regions involved and spared by seizures in the group data, we acquired high-resolution anatomic images as described above in the same coronal planes as the fMRI data, and superimposed the t-maps for each coronal slice on the corresponding anatomic images. Anatomic images were collected at the beginning of the experiment and after each run of fMRI data acquisition to ensure suitable coregistration of anatomy and function. Labeled contours of anatomic structures were then superimposed on the t-maps using the closest corresponding sections in the coronal plane from a standard rat brain atlas (Paxinos and Watson, 1998). We then quantified increases in the fMRI signal in each anatomic region.
RESULTS
We analyzed fMRI data from a total of 256 SWD events acquired in 22 discrete runs from 9 of 12 WAG/Rij rats. Mean seizure duration was 3.33 ± 1.32 seconds (mean ± SD; range 1.40 to 7.80 seconds). Three WAG/Rij rats were excluded from the analysis because of significant movement artifacts, very few SWD, or EEG with large amounts of random spiking activity, which made it impossible to define a clear baseline.
During SWD, BOLD fMRI signals increased compared to baseline (Fig. 2). Increases were present in several cortical and subcortical regions; however, the pattern and intensity of activation did not involve the whole brain uniformly. Increases were most prominent in focal regions of the somatosensory cortex, motor cortex, thalamus, basal ganglia, and brainstem (tectum and tegmental nuclei) (Figs. 2A and 5A). In accordance with regions spared in previous electrophysiological studies (Meeren et al., 2002; Nersesyan et al., 2003a), the occipital regions were relatively spared by BOLD fMRI increases during SWD. In most cases, the fMRI signal increased bilaterally, and had a symmetrical distribution. Although we have observed some decreases in the BOLD fMRI signal in certain animals, they were not as consistent, prominent, or symmetrical as increases in fMRI signal (data not shown). Control analyses of baseline versus baseline images did not show significant regions of change in the BOLD fMRI signal (Fig. 2B).
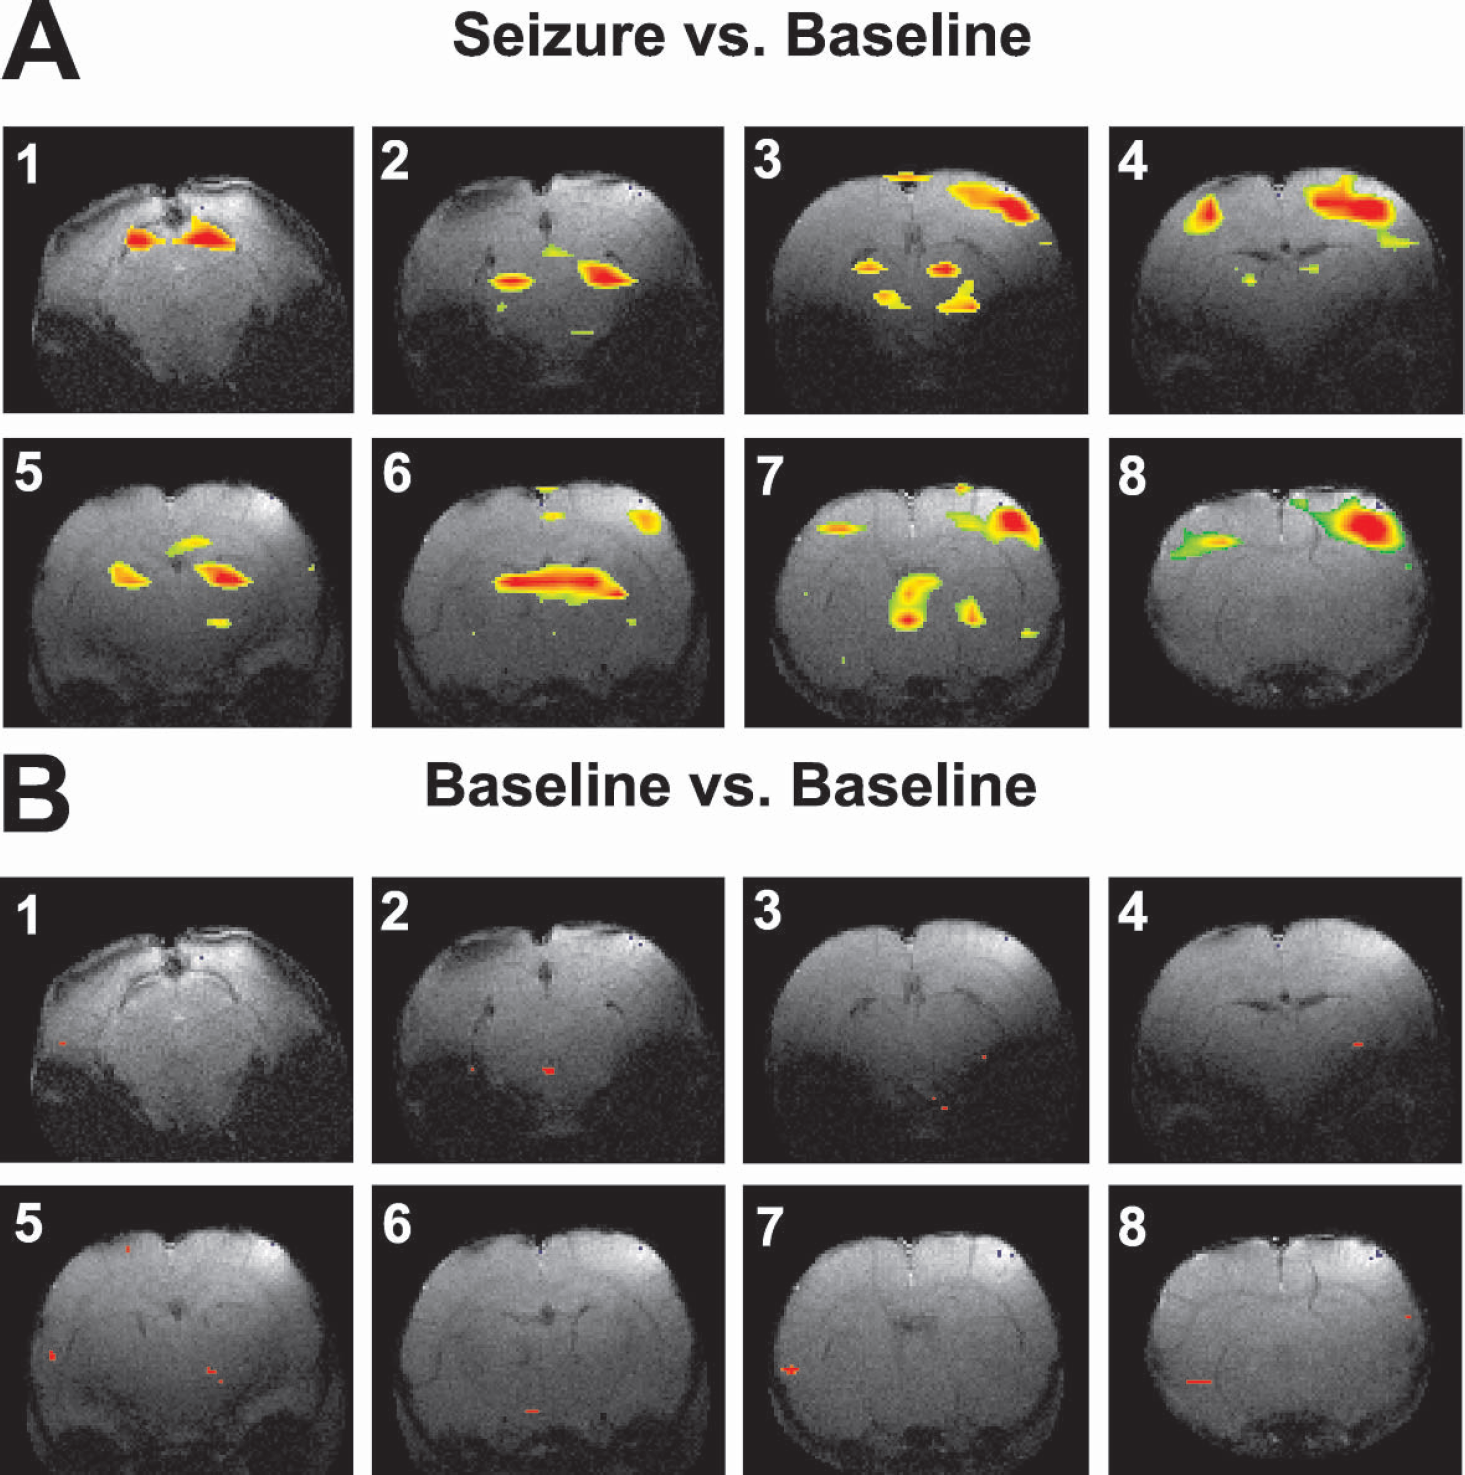
Example of BOLD fMRI activations during SWD.
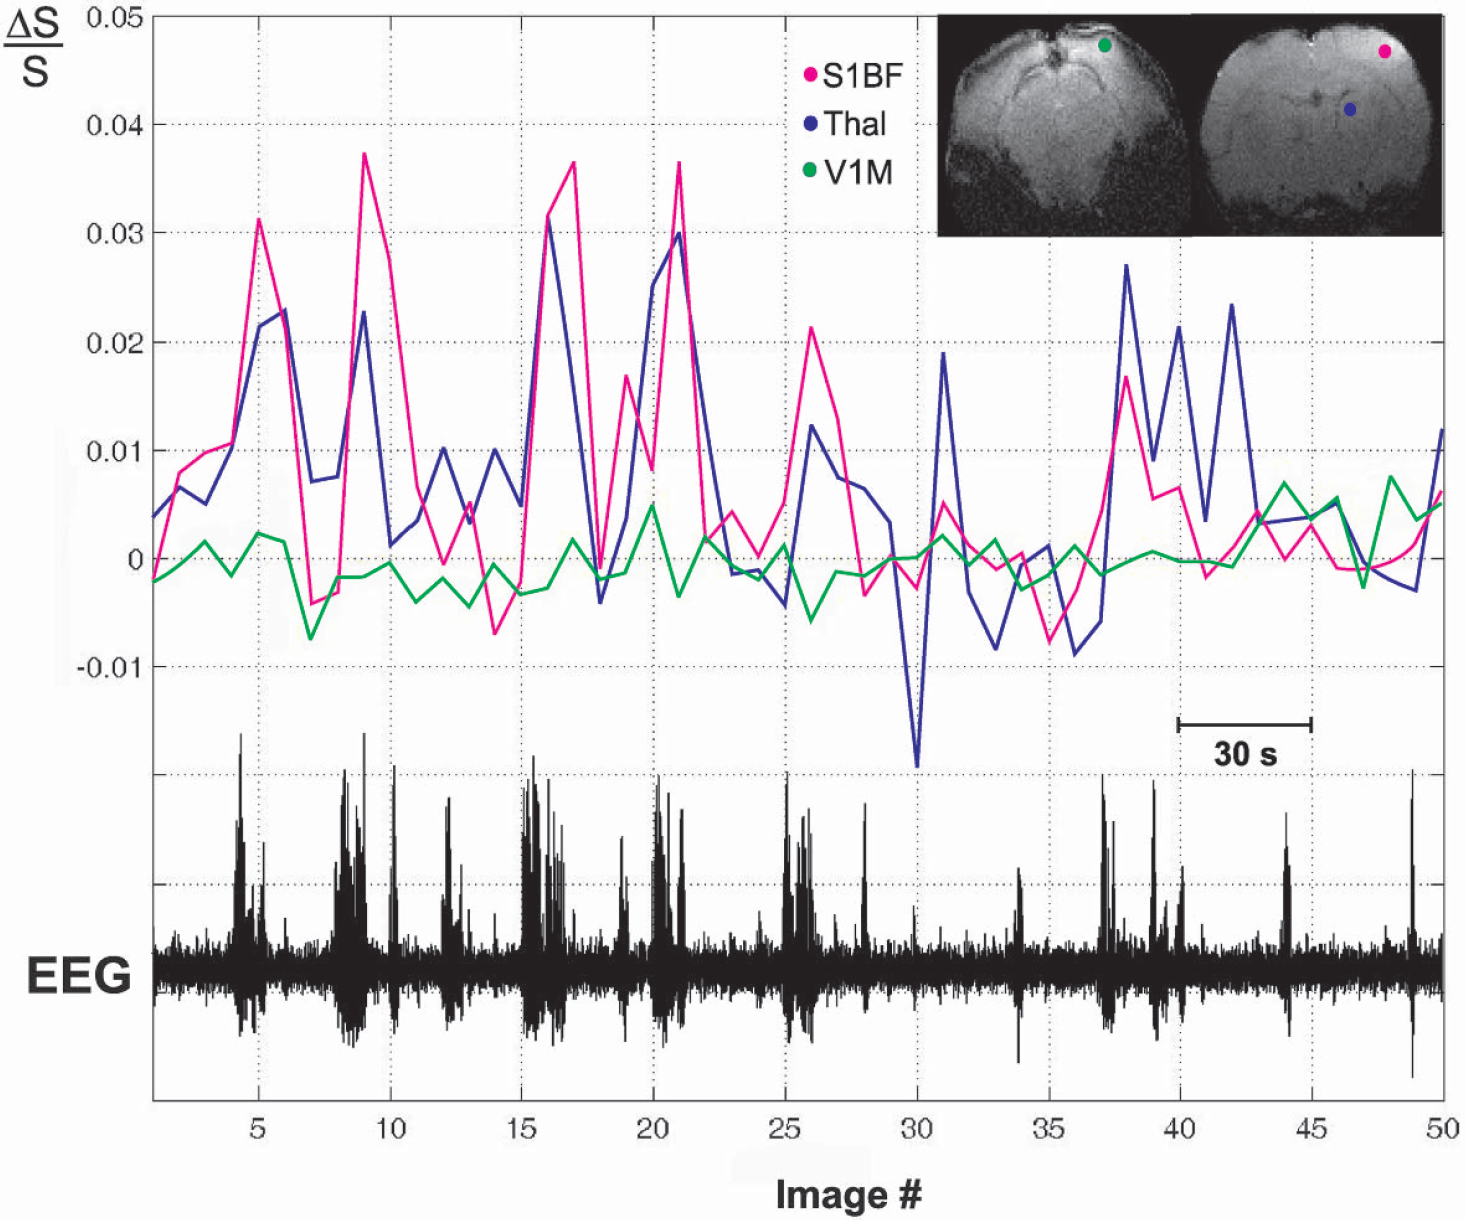
Time course of BOLD fMRI signal changes with simultaneous EEG during SWD. Increases in the BOLD fMRI signal (ΔS/S) occur in barrel cortex (red line, S1BF) and thalamus (blue line, Thal) with the onset of most SWD episodes, particularly those lasting more than 3 seconds. No significant changes related to seizure activity were observed in primary visual cortex (green line, V1M). Same experimental run, and same animal as in Fig. 2.
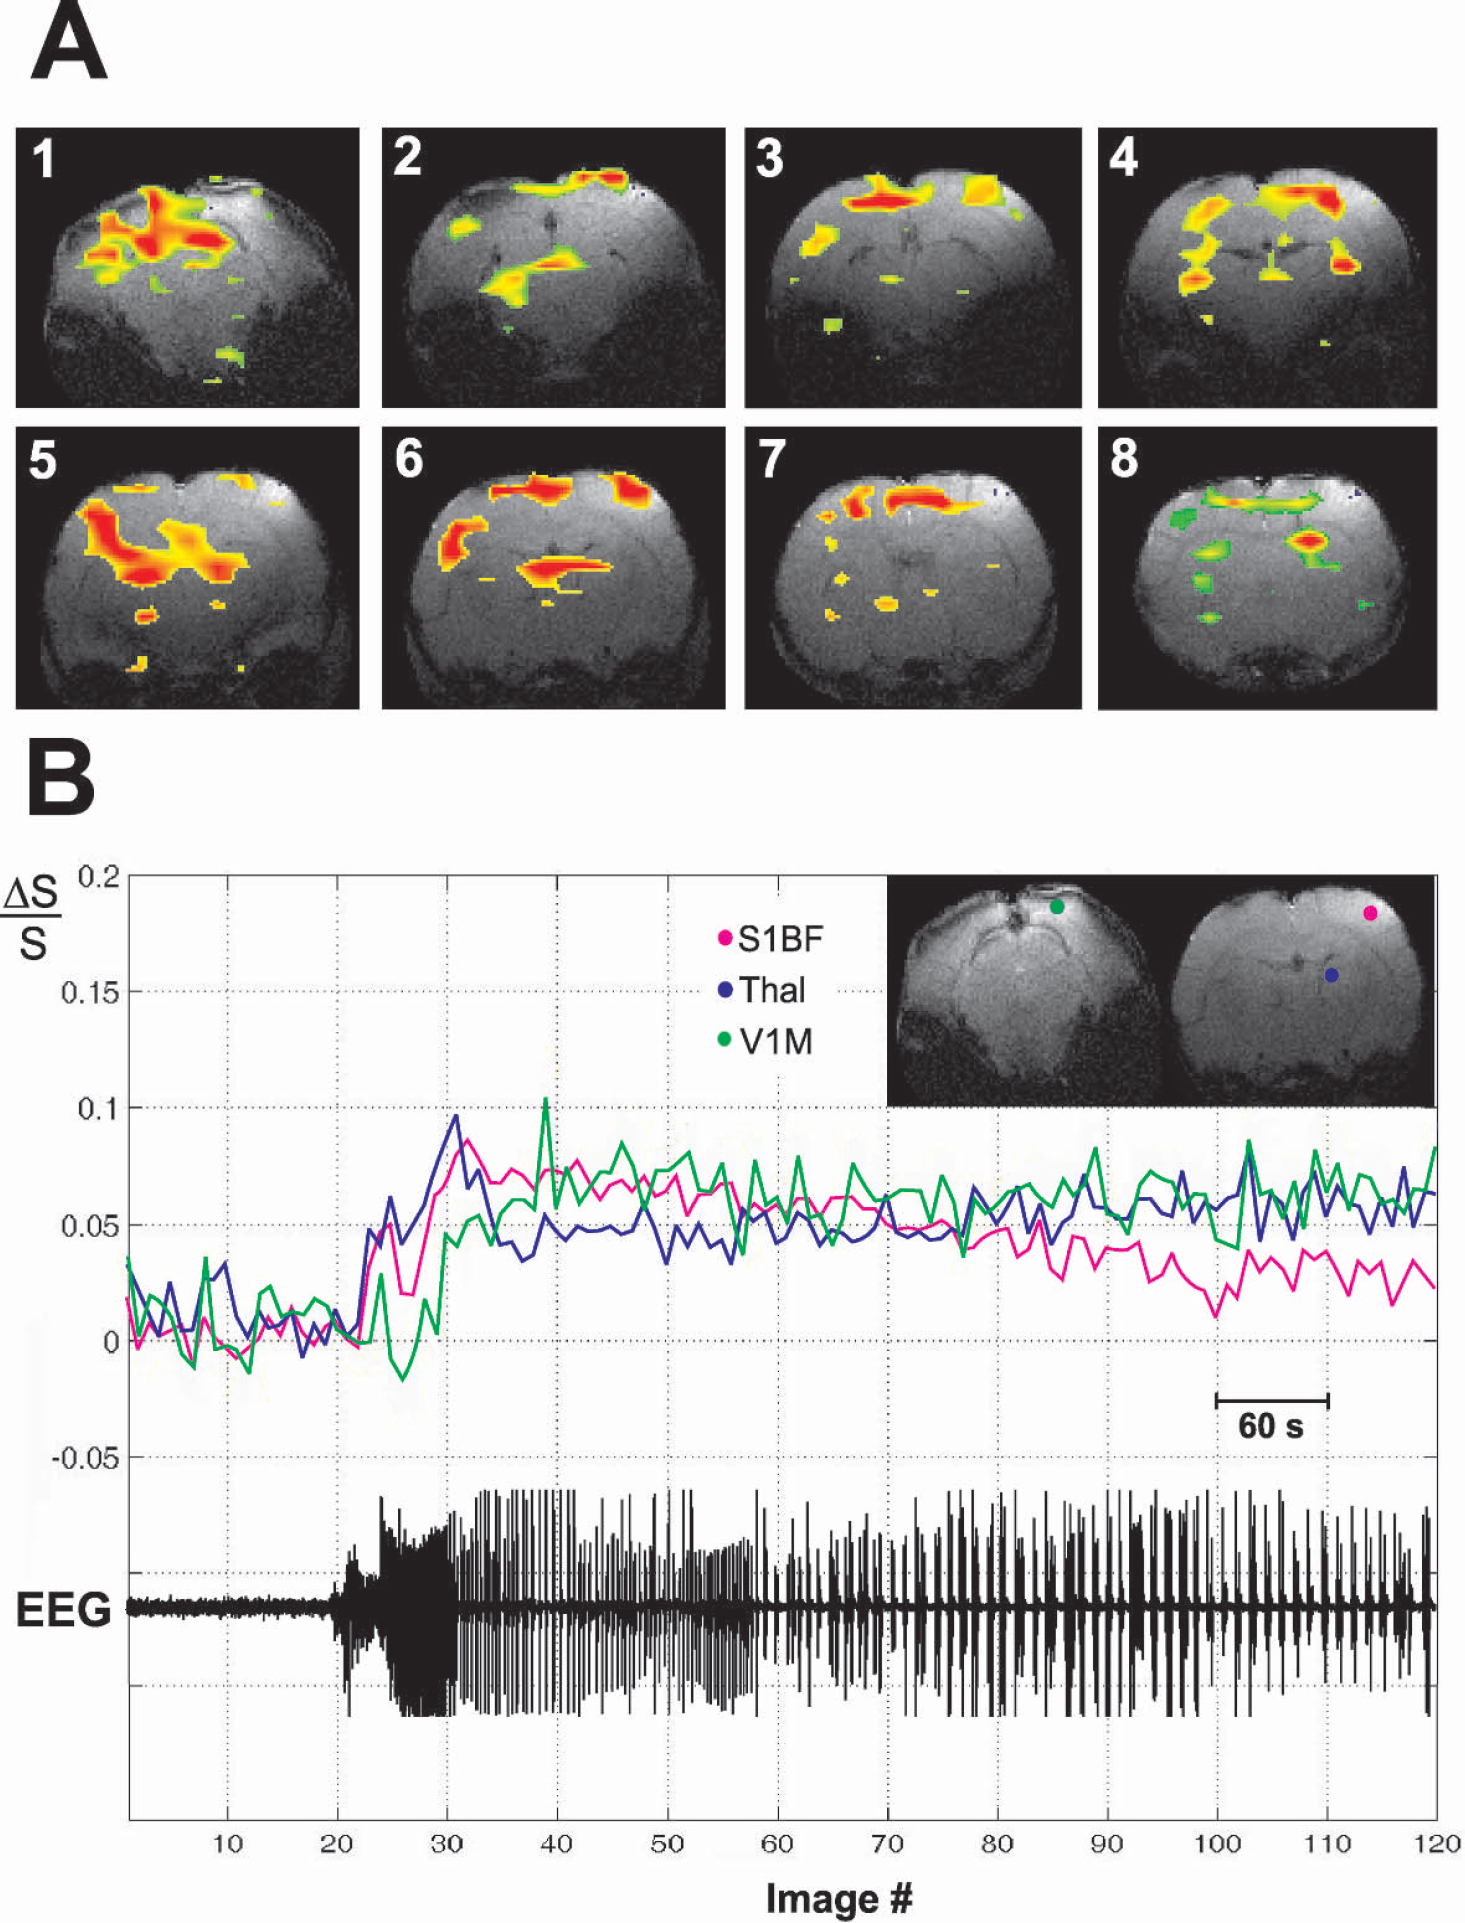
Example of BOLD fMRI activations during a bicuculline-induced GTCS.
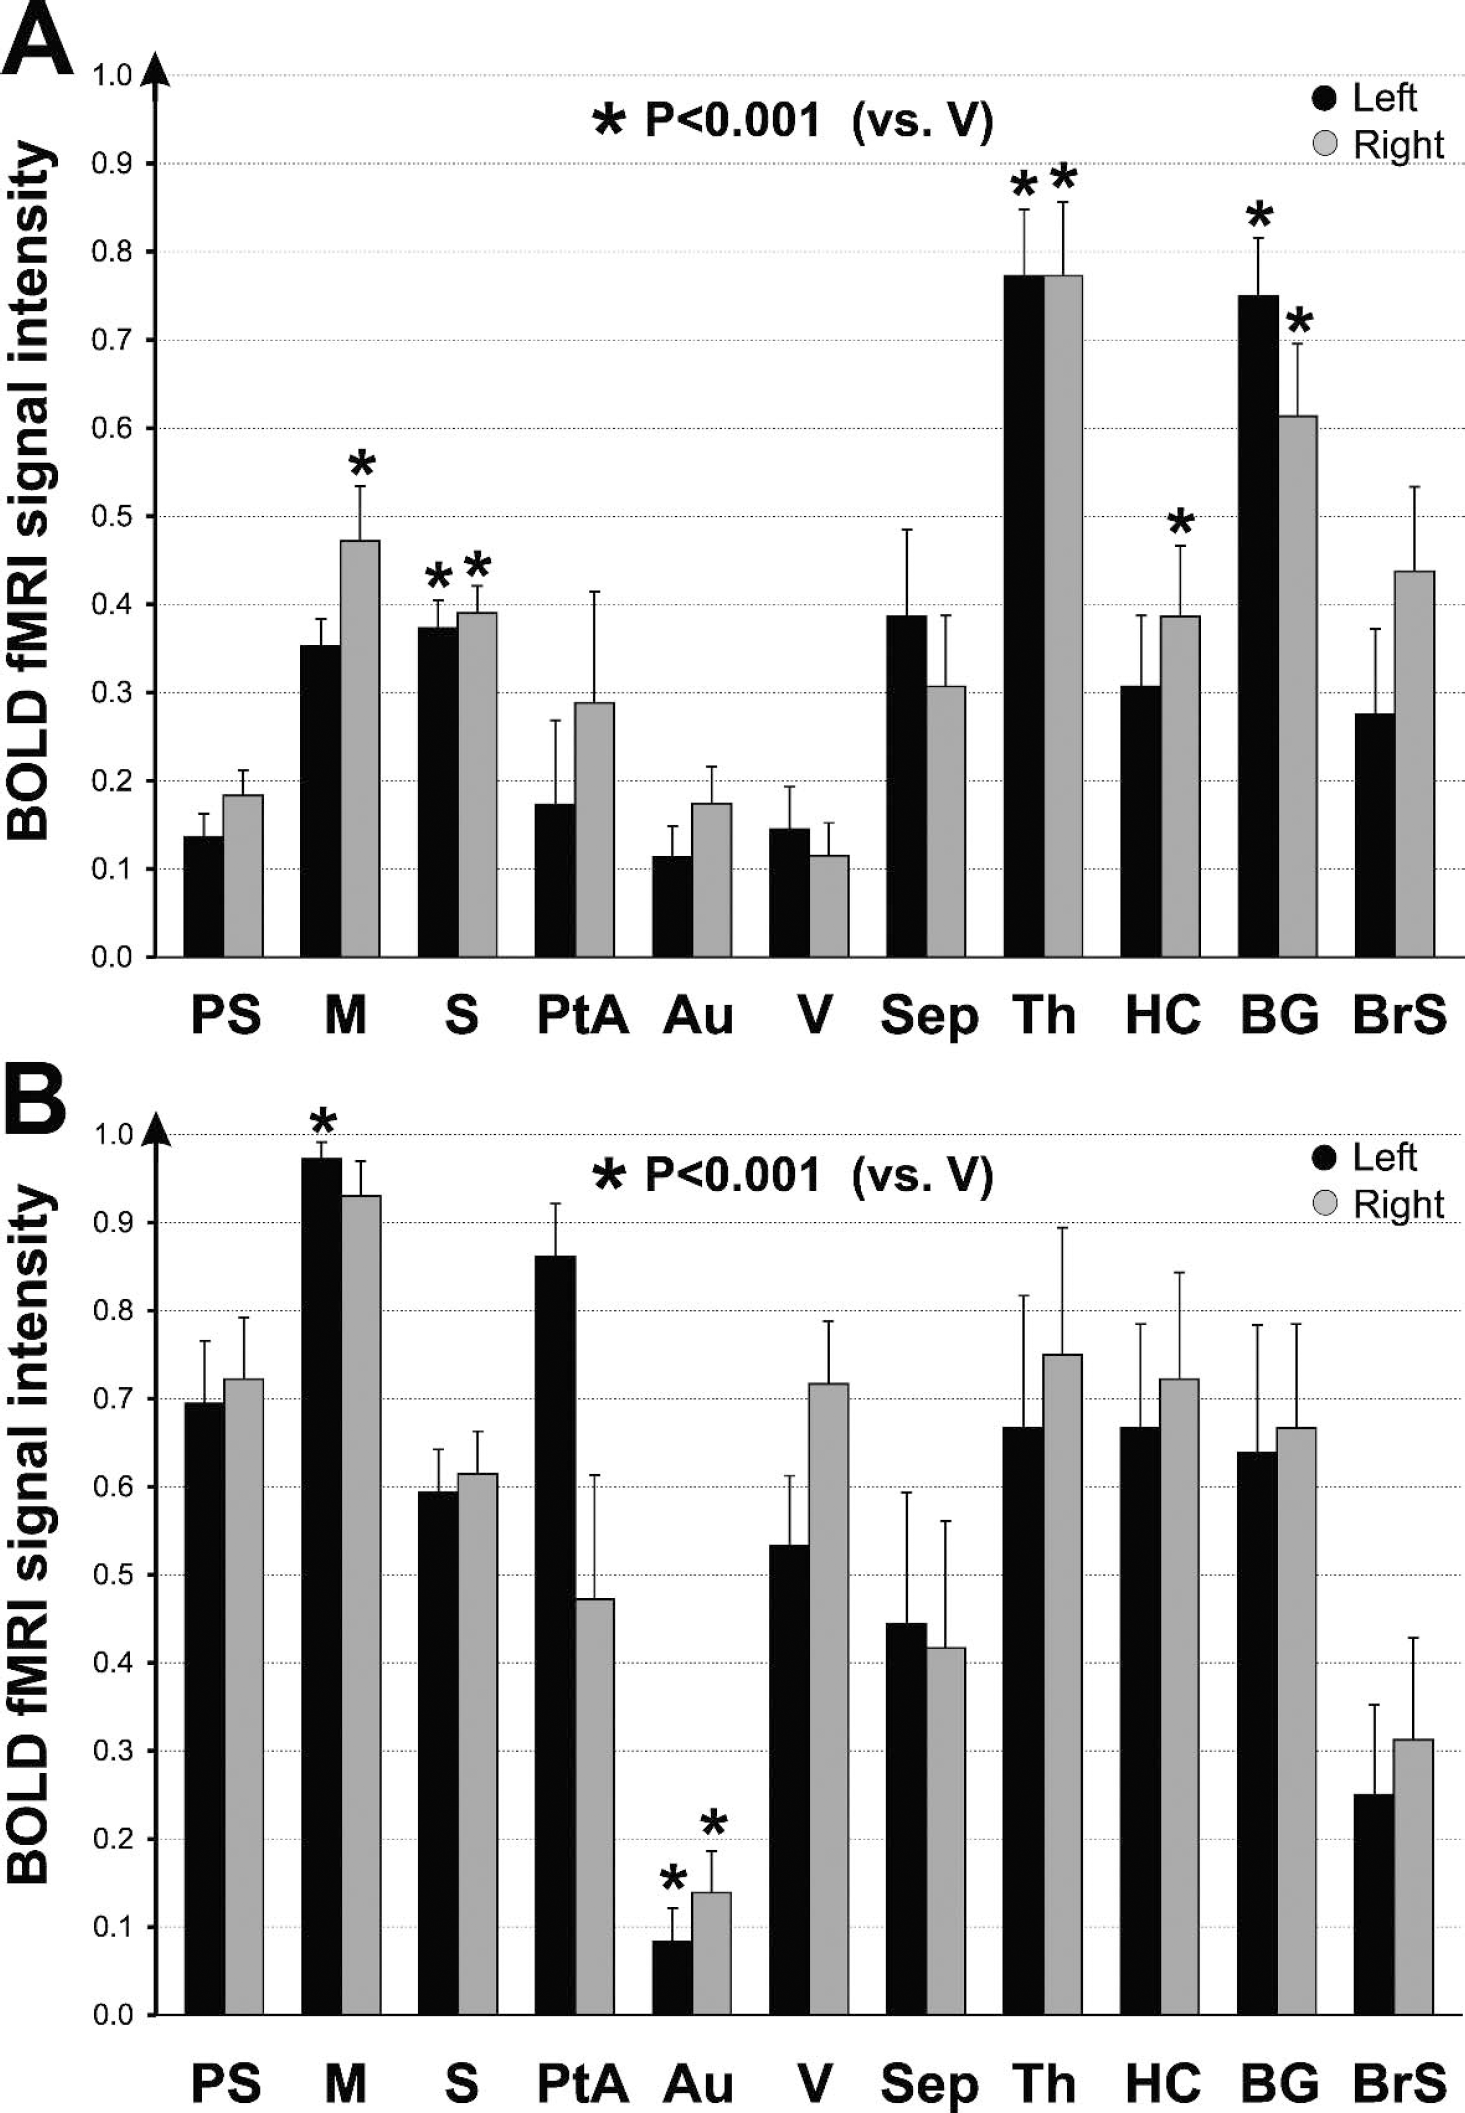
Summary of mean BOLD fMRI activations during spontaneous SWD
We next analyzed the time course of fMRI signal changes to determine their relationship to the EEG signal. Cortical and subcortical regions such as the barrel cortex and thalamus, which were intensely involved during SWD (Figs. 2A and 5A), showed increased BOLD fMRI signal during most SWD events, particularly those lasting more than 3 seconds (Fig. 3, red and blue traces). Meanwhile, regions such as the primary visual cortex, known to be relatively quiet electrically during SWD (Meeren et al., 2002; Nersesyan et al., 2003a), showed no relationship between BOLD fMRI signal changes and SWD events on EEG (Fig. 3, green trace). The increase in BOLD fMRI signal seen in regions such as barrel cortex and thalamus tended to lag behind the SWD onset by a few seconds (Fig. 3).
How do the increases in fMRI signals observed during SWD compare to more intense and long-lasting seizures? To investigate this, we measured fMRI signal changes during GTCS induced by bicuculline in the same WAG/Rij rats in which SWD were measured (Fig. 1C). A total of 9 GTCS from 9 fMRI runs were analyzed from 4 WAG/Rij rats, with mean seizure duration of 166.86 ± 82.45 seconds per bolus injection of bicuculline. During bicuculline-induced GTCS, there were marked bilateral increases in BOLD fMRI signals in cortical and subcortical structures (Fig. 4A). Although the increases were less localized and much more intense than during SWD, there were still some relatively “silent” symmetrical cortical and subcortical regions. However, these regions were relatively small, and differed from those spared during SWD. For example, primary visual cortex was relatively spared during SWD, but not during GTCS (Figs. 4A and 5B). As in the case of SWD, we observed some regional decreases in BOLD fMRI signal during GTCS (data not shown). Symmetrical decreases were mostly localized in the hippocampal area, but were not consistent throughout different experimental runs in different animals.
To determine whether fMRI changes during GTCS differed between WAG/Rij and normal rats, we also measured fMRI signal changes during 10 bicuculline-induced GTCS from 10 fMRI runs in 4 nonepileptic Wistar rats. These normal Wistar rats did not exhibit SWD under fentanyl/haloperidol anesthesia; however, the fMRI signal changes during bicuculline-induced GTCS were nearly identical to those seen in WAG/Rij rats (data not shown).
We also analyzed the time course of fMRI signal changes in WAG/Rij rats in the same regions studied during SWD, as shown in Fig. 4B. During bicuculline-induced GTCS, the fMRI signal increased in primary visual cortex as well as in the barrel cortex and thalamus. The magnitude of the signal changes during GTCS was also larger than during SWD. Thus, fMRI signal changes during GTCS differed from SWD in both amplitude and spatial distribution.
A summary of the spatial distribution of fMRI signal changes during SWD and GTCS for all experiments in WAG/Rij rats is shown in Fig. 5. During SWD, the largest increases in fMRI signals compared to baseline were in the motor cortex, somatosensory cortex, septal nuclei, thalamus, hippocampus, basal ganglia, and brainstem (Fig. 5A). In contrast, increases in visual and auditory cortex were relatively small. Increases in somatosensory cortex, motor cortex, thalamus, hippocampus, and basal ganglia were greater than in visual cortex at the P < 0.001 significance level (two-tailed Student's t-test). During GTCS, however, small regions were relatively spared (Fig. 4A), and increases were observed in the average data in nearly all brain regions, with the exception of the auditory cortex (Fig. 5B). Unlike SWD, during bicuculline-induced seizures the increases in visual cortex did not differ significantly from most other regions.
DISCUSSION
We show here through dynamic imaging of single seizure events with simultaneous EEG recordings that oxygen delivery exceeds metabolic demands in specific brain regions known to show intense neuronal firing during both SWD and GTCS. Recent electrophysiologic studies have shown in WAG/Rij rats that intense neuronal activity during SWD occurs in the somatosensory cortex and thalamus, with seizures apparently arising from the perioral somatosensory cortex in this model, whereas other regions such as the primary visual cortex are relatively spared (Blumenfeld, 2003; Meeren et al., 2002; Nersesyan et al., 2003a). In accordance with electrophysiologic studies, our BOLD fMRI recordings with simultaneous EEG also show increases in somatosensory cortex and thalamus, whereas the visual cortex is relatively spared. This suggests that increased oxygen delivery is able to meet increased metabolic demands in the regions most actively involved by these seizures. During GTCS, previous studies have shown sustained and intense increases in neuronal firing and metabolism in most brain regions (Avoli et al., 1990; Engel et al., 1982; Folbergrova et al., 1981; Handforth and Ackermann, 1995; Matsumoto and Marsan, 1964). Despite this massive increase in neuronal activity, our BOLD fMRI recordings with simultaneous EEG revealed increased signals in most brain regions, suggesting that increased oxygen delivery is sufficient to meet metabolic demands during GTCS in these regions. Thus, in SWD the more restricted regions of increased neuronal firing are accompanied by increases in oxygen delivery to the same regions, whereas in GTCS more widespread and intense neuronal firing is accompanied by commensurate widespread and larger increases in oxygen delivery.
These findings have important implications for understanding both the pathophysiology of seizures, and the neuroimaging methods used to study them. Although early theories proposed that cerebral anoxia causes neuronal injury during seizures (Simon, 1985), subsequent investigations revealed that damage can occur even in the absence of anoxia, through excitotoxic mechanisms (Meldrum, 2002; Meldrum and Brierley, 1973). However, it remains possible that focal hypoxia may occur during seizures in the regions of most intense neuronal firing and commensurate increased metabolic demands. Our findings suggest that the BOLD signal (which reflects oxygenated hemoglobin delivery to brain tissue) increases in regions intensely involved in both SWD and GTCS.
Functional neuroimaging methods are increasingly being used to localize the seizure onset zone in patients with epilepsy noninvasively (Benar et al., 2002; Lemieux et al., 2001; Spencer et al., 1995; Warach et al., 1996). Use of these methods rest on the assumption that increases in CBF and metabolism correspond to regions most intensely involved by seizures, whereas other regions are relatively spared. The results described here begin to address this assumption by demonstrating that fMRI signal changes correspond closely in space and time to regions known to be involved in seizures. However, further studies will be needed with more focal seizure types and more extensive electrophysiologic studies to fully investigate these relationships. An additional potential therapeutic benefit of dynamic functional brain imaging during seizures is the ability to identify specific cortical and subcortical networks crucial to seizure generation (Norden and Blumenfeld, 2002). Identification of these networks may ultimately help guide the placement of new targeted therapeutic devices, such as deep brain and cortical stimulators (Cohen-Gadol et al., 2003).
Our findings support other recent results, which suggest that even “generalized” seizures are not truly generalized. Focal network involvement during both SWD and GTCS has been demonstrated in animal models and human studies, where relatively intense involvement is seen in frontoparietal cortex and associated midline subcortical structures, whereas other cortical-subcortical networks are relatively spared (Blumenfeld, 2003; Blumenfeld et al., 2003; Meeren et al., 2002; Nersesyan et al., 2003a). In agreement with these studies, we found that during SWD focal regions of frontoparietal cortex and thalamus are intensely involved in BOLD signal increases, whereas the visual cortex is relatively spared. In addition, although regional analysis summarized across GTCS showed increases in nearly all brain regions, heterogeneous involvement with sparing of some regions was evident in individual animals during BOLD imaging of bicuculline-induced seizures. Additional studies with higher spatial resolution will be essential to further characterize this regional heterogeneity in GTCS. Selective network involvement during generalized seizures may explain certain behavioral features of these events. For example, preferential involvement of frontoparietal cortex and midline subcortical structures such as the thalamus and upper brainstem tegmentum may be crucial for loss of consciousness during generalized seizures (Blumenfeld and Taylor, 2003; Blumenfeld et al., 2003).
Interestingly, although in prior studies there are no major disagreements that regional CBF and metabolism increases during GTCS (Andre et al., 2002; Engel et al., 1982; Folbergrova et al., 1981; Handforth and Ackermann, 1995; Pereira de Vasconcelos et al., 2002), the data concerning CBF changes and metabolism during SWD are controversial. Human studies have been contradictory, with several positron emission tomography and single photon emission computed tomography studies showing a significant increase in CBF and metabolism during absence seizures (Engel et al., 1982; Engel et al., 1985; Prevett et al., 1995; Yeni et al., 2000), whereas other positron emission tomography, 133Xe clearance, transcranial Doppler, and fMRI studies showed decreases, variable results, or biphasic responses (Bode, 1992; De Simone et al., 1998; Diehl et al., 1998; Klingelhofer et al., 1991; Nehlig et al., 1996; Ochs et al., 1987; Salek-Haddadi et al., 2002; Sanada et al., 1988; Sperling and Skolnick, 1995; Theodore et al., 1985). Animal studies, likewise, have had complicated results, with some showing increases in metabolism and others decreases in CBF during SWD in the same model (Nehlig et al., 1991; Nehlig et al., 1996).
There are several possible explanations for this variability. One important factor is temporal resolution of the measurement technique. Because SWD typically are brief, lasting less than 10 seconds, measurements with slower positron emission tomography and single photon emission computed tomography methods will integrate changes before, during, and after SWD episodes. Differences in seizure duration between studies may also be important, because cerebral blood flow and metabolism changes may differ for brief versus very long SWD (Salek-Haddadi et al., 2002) or absence status epilepticus (Theodore et al., 1985). Finally, spatial heterogeneity of SWD amplitude in different brain regions in both humans (Coppola, 1988; Rodin and Ancheta, 1987; Weir, 1965) and animal models (Blumenfeld, 2003; Meeren et al., 2002; Nersesyan et al., 2003b; Vergnes et al., 1990) may also contribute to variability among these studies.
To overcome these confounding factors, we performed BOLD fMRI measurements throughout the brain with simultaneous EEG recordings at relatively high spatial and temporal resolution during typical brief SWD episodes. Our results demonstrate increases in BOLD signals in cortical and subcortical regions known to be involved in increased neuronal firing, with tight temporal correspondence to individual SWD episodes. By using simultaneous EEG recordings, we have also been able to study changes throughout the brain during the initial seconds of GTCS, whereas most other studies have looked at changes after several minutes. Although a number of studies have mapped interictal epileptiform spikes with BOLD fMRI (Archer et al., 2003; Benar et al., 2002; Krakow et al., 1999; Lemieux et al., 2001; Seeck et al., 1998; Warach et al., 1996), only a few have correlated seizure events with localized brain activity (Opdam et al., 2002; Salek-Haddadi et al., 2003; Van Camp et al., 2003). The main advantage of the studies reported here is the ability to follow the time course of BOLD signal changes for individual seizures at relatively high spatial and temporal resolution compared to other published reports. We achieved this by combining high field-strength fMRI measurements with artifact-free simultaneous EEG recordings (see Materials and Methods).
The results reported here are also supported by recent measurements with simultaneous co-localized extracellular multiunit recordings and laser Doppler flowmetry (Nersesyan et al., 2003a). We found that neuronal firing and CBF increase in the somatosensory cortex during SWD in WAG/Rij rats, whereas the visual cortex is spared by both increases in neuronal firing and CBF (Nersesyan et al., 2003a). During GTCS, increases in neuronal firing and CBF in these same regions were significantly greater than during SWD (Nersesyan et al., 2003a). This suggests that the increases in BOLD signals that we observed here are caused by regional increases in CBF, resulting in increased oxygen delivery to areas showing the most intense neuronal firing during seizures. Future studies with dynamic CBF mapping with MRI may be more useful for investigating regional CBF changes over the course of seizures onset (Barbier et al., 2001).
Although both absence and tonic-clonic seizures exhibit focal features, both seizure types studied in this investigation are usually classified as “generalized” (ILAE, 1981), and it will be essential to extend these studies to models of localization-related epilepsy as well. Interestingly, an early fMRI study without simultaneous EEG demonstrated coupling of thalamic and cortical activity during partial seizures similar to that seen here with SWD (Detre et al., 1996). However, the method used here measured only relative changes in the BOLD signal. Techniques are now being developed to directly quantify changes in oxidative metabolism in vivo from calibrated BOLD measurements (Hyder et al., 2001), which will greatly enhance our ability to interpret these results. Finally, because decreases in fMRI signal were so inconsistent both in location and in correlation with seizures, we focused here specifically on the stronger correlated positive fMRI signal changes. More detailed analysis of fMRI signal decreases during both SWD and GTCS is needed and will be one of the main goals of our future investigations with larger sample sizes and higher fMRI sensitivity at 9.4T.
In conclusion, we have found through combined BOLD fMRI and EEG recordings in the WAG/Rij rat that SWD are accompanied by transient focal increases in BOLD signals in regions known to be intensely involved in SWD such as the fronto-parietal cortex and thalamus, but not in regions known to be spared, such as the occipital cortex. GTCS in the same model are accompanied by BOLD signal increases that are more widespread, intense, and sustained than in SWD. These findings from two different types of seizures suggest that, as in normal brain activity, during epileptic seizures oxygen delivery increases in regions of increased neuronal firing in excess of metabolic demands, providing an opportunity to investigate cortical-subcortical networks involved in seizures through fMRI studies.
Footnotes
Acknowledgements
We thank Dr. Joshua Brumberg for helpful comments on the manuscript, Dr. Bei Wang for technical assistance in animal preparation, and Dr. Anant B. Patel for assistance in implementing fMRI recordings. We also thank the engineering staff of the Magnetic Resonance Research Center for technical support with hardware maintenance and radio-frequency probe construction.