
Abstract
Erythropoietin, a hemotopoietic growth factor, has brain protective actions. This study investigated the mechanisms of Recombinant Human EPO (rhEPO)-induced brain protection in neonates. An established rat hypoxia-ischemia model was used by ligation of the right common carotid artery of 7-day-old pups, followed by 90 minute of hypoxia (8% 02 and 92% N2) at 37°C. Animals were divided into three groups: control, hypoxia-ischemia, and hypoxia-ischemia plus rhEPO treatment. In rhEPO treated pups, 300 units rhEPO was administered intraperitoneally 24 hours before hypoxia. rhEPO treatment (300 units) was administered daily for an additional 2 days. ELISA and immunohistochemistry examined the expression of EPO and EPOR. Brain weight, morphology, TUNEL assay, and DNA laddering evaluated brain protection. rhEPO abolished mortality (from 19% to 0%) during hypoxia insult, increased brain weight from 52% to 88%, reduced DNA fragmentation, and decreased TUNEL-positive cells. Real-time RT-PCR, Western blot, and immunohistochemistry revealed an enhanced expression of heat shock protein 27 (HSP27) in ischemic brain hemisphere. Double labeling of TUNEL with HSP27 showed most HSP27 positive cells were negative to TUNEL staining. rhEPO reduces brain injury, especially apoptotic cell death after neonatal hypoxia-ischemia, partially mediated by the activation of HSP27.
Erythropoietin (EPO), a hematopoietic growth factor, binds with its receptor, EPOR (a member of the cytokine super family), to stimulate proliferation, differentiation, and maturation of erythroid progenitor cells during erythropoiesis (Acs et al., 2001; Buemi et al., 2002a; Fisher 2003). Even though EPO is mostly produced by fetal liver and adult kidneys, both EPO and EPOR are expressed in the brain tissues (Digicaylioglu et al., 1995; Juul et al., 1998; Baciu et al., 2000; Dame et al., 2000; Chin et al., 2000; Buemi et al., 2003), respond to hypoxia stimulation (Rondon et al., 1991; Ruscher et al., 2002), and are regulated by hypoxia-inducible factor-1α (Bergeron et al., 2000; Wanner et al., 2000; Chavez and LaManna, 2002; Grimm et al., 2002). The mechanisms for EPO-induced brain protection may involve antiinflammatory action (Agnello et al., 2002), anti-apoptosis (Chong et al. 2002a), and Jak2/NFκ-B signaling cascade (Digicaylioglu and Lipton 2001).
It seems that human recombinant EPO (rhEPO) can cross a dysfunctional blood-brain barrier (BBB) since systemic administration of rhEPO protects the brain from injury (Brines et al. 2000). Systemic or local administration of rhEPO offers brain protection in focal cerebral ischemia (Sadamoto et al. 1998; Sakanaka et al. 1998; Bernaudin et al. 1999; Marti et al. 2000; Brines et al 2000; Siren et al. 2001; Ehrenreich et al. 2002), hypoxiaischemia (Juul 2002), subarachnoid hemorrhage (Alafaci et al. 2000; Grasso 2001), global cerebral ischemia (Calapai et al. 2000; Catania et al. 2002), spinal cord injury (Gorio et al. 2002; Celik et al. 2002), and experimental autoimmune encephalomyelitis (Agnello et al. 2002). EPOR expresses in neonatal brain tissues (Juul 1999; Juul et al. 1999b; Bergeron et al. 2000; David et al. 2002), and rhEPO reduces brain injury in neonatal hypoxia animal models (Kumral et al. 2003; Solaroglu et al. 2003).
Neonatal hypoxia-ischemia is one of the major causes of morbidity and mortality in the perinatal period (Del Toro et al. 1991; Miller 2000; Ferriero 2001; Lauterbach et al. 2001). Even though several strategies such as magnesium or hypothermia have been investigated, no effective therapy is currently available (Vannucci 1990; Wagner et al. 1999; Fawke and McIntyre 2002). Since rhEPO has been used clinically to treat anemia in preterm infants for more than a decade and has been proven a safe therapeutic agent (Peterec 1995; Juul 1999), we examined the mechanisms of the brain protective action of rhEPO in an established neonatal hypoxia-ischemia rat model (Rice et al. 1981; Ashwal and Pearce 2001).
METHODS
Neonatal Hypoxia-Ischemia Rat Model
The Animal Care and Use Committee at Louisiana State University Health Sciences Center in Shreveport evaluated and approved the protocol used in this study. The model used was based on the Rice-Vannucci model (Rice et al. 1981; Vannucci and Vannucci 1997) as previously described (Calvert et al. 2002). Pups were housed with the dam under a 12:12 hour light/dark cycle with food and water available ad libitum throughout the study. Unsexed 7-day-old (Day 0 = day of birth) Sprague-Dawley (Harlan) rats were anesthetized by inhalation with isoflurane (0.1%) in oxygen. The rats were kept at a temperature of 37°C as the right common carotid artery of each pup was exposed and ligated with 5-0 surgical sutures and cut between the ligatures. The duration of the anesthesia did not exceed 15 minutes, and the pups were allowed to recover with their dams for 2 hours. They were then placed in a jar perfused with a humidified gas mixture (8% oxygen balanced nitrogen) for 1.5 hours. Both the jar and the gas mixture were kept at 37°C. The pups were returned to their dams after the hypoxic exposure. Control littermates were not operated on or subjected to hypoxia. Some animals underwent sham-operation procedures by exposing the right common carotid artery without ligation, followed by wound closure.
Experimental Groups
The 312 pups for this study were randomly divided into three groups: control group (without surgery/hypoxia plus sham-operated), hypoxia-ischemia no treatment group, and hypoxia-ischemia plus rhEPO treatment group. In rhEPO treated animals, pups received rhEPO (300 units i.p.) at 24 hours before hypoxia. rhEPO was then administered at 300 units per day for an additional two days. In all groups, the pups were sacrificed under deep anesthesia by inhalation with isoflurane at the following designated time intervals: 24, 48, and 72 hours, and at 1, 3, and 6 weeks after hypoxia insult. All brain samples dedicated for histology and immunohistocheistry were perfusion fixed with 4% paraformaldehyde. Freshly frozen brain samples were collected for Western blot, ELISA, DNA ladder, and microarray studies.
Brain Weight
Brain weight was determined as previously described (Calvert et al. 2002). After removal of the brain, the cerebellum and brainstem were removed from the forebrain. The hemispheres were separated by a midline incision and then weighed on a high precision balance (sensitivity ± 0.001 g). Brain damage was expressed as the actual weight in grams and as the percent reduction of the ipsilateral (right) hemisphere compared to the contralateral (left) hemisphere.
Histology and Immunohistochemistry
The animals were first perfused with 10 mL 0.1M PBS and then with 20 mL 4% paraformaldehyde in 0.1M PBS (pH 7.4). The brains were removed and post-fixed in 4% paraformaldehyde in 0.1M PBS as described (Calvert et al. 2002). Coronal sections (10 μm) were made using a vibrating microtome and then stored in PBS. For HE staining, sections were stained in Hematoxylin for 1 minute and then stained with Eosin for 45 seconds. The sections were dehydrated and mounted with parmount.
For immunohistochemistry, brain samples were sectioned (6 μm) in a cryostat. The sections were incubated in 3% hydrogen peroxide (H2O2) and diluted in PBS (10 minutes) to prevent reaction with endogenous peroxidases. After 30 minutes of 3% normal serum in PBS, the sections were incubated with primary antibodies (goat anti- EPO 1:200; rabbit anti-EPO-R 1:200 [Santa Cruz Inc.]) overnight at 4°C. After rinsing with PBS, brain sections were then treated with goat or rabbit ABC kit (Santa Cruz Inc). Brain sections were incubated with donkey anti-goat IgG conjugate FITC 1:200 (for EPO) or goat anti-rabbit IgG conjugate Texas Red (for EPO-R) as secondary antibodies (1:200) for 2 hours. All of the procedures were conducted at room temperature. The brain sections were mounted, air-dried, dehydrated, cover slipped, and observed under a microscope (OLYMPUS BX51). Applying the control serum, instead of the primary antibody, on other sections of the same brain provided negative controls.
TUNEL and HSP27 Immunohistochemistry Double Fluoresce Staining
TUNEL staining was performed on paraffin embedded sections using the In Situ Cell Death Detection Kit, Fluorescein (Roche Diagnostics, Mannheim, Germany) as described previously (Ogihara et al. 2000; Rollins et al. 2002). This kit labels DNA strand breaks that are generated during apoptosis, allowing for the differentiation of apoptosis from necrosis. The procedure was carried out according to the manufacturer's instructions. The slides were dewaxed and then rehydrated by heating the slides at 60°C. The slides were then washed in xylene and rehydrated through a graded series of ethanol and double-distilled water. Next, the slides were incubated for 30 minutes at 37°C in a 20 μg/ml Proteinase K working solution. The slides were rinsed with PBS, and the area around the sample was dried. The slides were then incubated with 50 μl of the TUNEL reaction mixture containing Terminal deoxynucleotidyl transferase (TdT) for 60 minutes in a dark, humidified atmosphere at 37°C. After the slides were rinsed 3 times with PBS, they were analyzed with a fluorescence microscope (515 to 565 nm). In some sections, double label with HSP27 were conducted as described above. The first antibody used was goat anti-HSP27 1:100 (Santa Cruz Inc.). The second antibody used was donkey anti-goat IgG conjugate Texas Red (Santa Cruz Inc.) for 2 hours at room temperature.
DNA Laddering
Analysis of DNA fragmentation was performed using methods described previously (Meguro et al. 2001a; Meguro et al. 2001b). Ipsilateral hemispheres were homogenized, centrifuged briefly, and washed twice with cold PBS. The pellet was lysed in 1.0 mL of a buffer consisting of 10 mM Tris-HCl, 10 mM ethylenediamine tetraacetic acid (EDTA), and 0.2% Triton X-100 (pH 7.5). After 10 minutes on ice, the lysate was centrifuged (13,000 ϗ g) for 10 minutes at 4°C. The RNA and fragmented DNA in the supernatant were extracted, first with phenol and then with phenol-chloroform-isoamyl alcohol (25:24:1, vol:vol). The aqueous phase was added to 300 mM NaCl, and the nucleic acids were precipitated with 2 vol of ethanol. The pellet was rinsed with 70% ethanol, air-dried, and then dissolved in 20 μL of 10 mM Tris-HCl-1 mM EDTA (pH 7.5). After digestion of the RNA with ribonuclease A (0.6 mg/mL at 37°C for 30 minutes), the samples were electrophoresed in a 2% agarose gel with Boyer's buffer (50 mM Tris-HCl, 20 mM sodium acetate, 2 mM EDTA, and 18 mM NaCl at pH 8.05). The DNA was visualized with ethidium bromide staining.
RNA Isolation
Total RNA was isolated from the ipsilateral hemisphere using START-60 (Tel-Test, Friendswood, TX). Brain tissues were treated with RNase-free DNase (Promega, Midison WI) at 1 unit per μg of RNA at 37°C for 30 minutes, followed by phenol-chloroform extraction and ethanol precipitation. RNA quantity was determined by optical density measurement or RNA 6000 Nano Assay (Agilent Technologies), as recommended by the supplier.
Quantitative Real-time RT-PCR
To detect HSP27 gene expression and validate the microarray data, TaqMan Quantitative two-step RT-PCR was used to quantify mRNA levels. First, strand c-DNA was synthesized using a TaqMan Reverse Transcription reagent kit. PCR analyses were conducted by using gene specific primers and fluorescent-labeled Tag probe (designed by Perkin Elmer Life Sciences Primer Express software) in a 7700 Sequence Detector (PE Applied Biosystems, Foster city, CA). Endogenous control (18s rRNA) was detected by TaqMan Ribosomal RNA Control Reagents. All reagents were purchased from Applied Biosystems. The 18S rRNA probe was labeled with a report dye (Vic), and the other gene's probe was labeled with Fam at the 5’ end and a quencher dye at the 3’ end. The real-time data were analyzed with Sequence Detection Systems software version 1.7. All reactions were performed in duplicate. Each run contained both negative (no template) and positive controls. The following sequence–specific primers were used for HSP-27: forward, 5'-CCT GGT GTC CTC TTC CCT GT-3'; reverse, 5'- TGG TGA TCT CCG CTG ATT GTG; probe, 5'-AGG GCA CAC TCA CCG TGG AGG CTC-3'.
Western Blot
HSP27 expression was examined by Western blot as described previously (Miao et al. 2002; Sung et al. 2003). Ipsilateral hemispheres were homogenized in extract buffer (0.32M sucrose, 1mM EDTA, 5mM Tris [pH 7.4], 0.1mM PMSF, 10 μM Leupeptin, and 1 mM β-Mercaptoethanol) and 0.1% (w/v) proteinase inhibitor. Each homogenate was centrifuged at 1000g for 10 minutes, and the pellet was discarded. The supernatant was centrifuged at 160, 000 rpm for 30 minutes and the supernatant was collected. All procedures were performed at 4°C. Protein concentrations were determined by BCA assay (PIERCE, Rock ford, IL). The samples were kept frozen at −80°C until assay.
Protein samples were diluted with 2x sample buffer (125mM Tris [pH 6.8], 4% SDS, 20% Glycerol 0.025% Bromphenol, and Blue 10% β-Mercaptoethanol) and denatured at 95°C for 5 minutes. Samples (50μg proteins) were electophoresed on 12% gel in the presence of SDS. Semiquantitative immunoblotting was performed by transferring the proteins to the nitrocellulose membrane, blocking with buffer (Tris buffered saline [TBS] pH 7.6, 5% milk, and 0.1% Tween-20) and incubating overnight at 4°C with anti-HSP27 (Goat polyclonal IgG diluted 1:500, anti-actin [Goat polyclonal IgG] diluted 1:1000 [Santa Cruz Biotechnology, Santa Cruz, CA]). The blots were washed in 0.5% TBS and incubated at 37°C for 30 minutes with a second antibody of horseradish peroxidase-conjugated anti-goat IgG (Santa Cruz Biotechnology, Santa Cruz, CA), diluted 1:3000. The specific reaction was visualized using the enhanced chemiluminescence (ECL) method (Amersham) and analyzed by quantitative densitometry using a computerized image analysis program (Quantity one, Bio-Rad).
ELISA Measurement
Protein sample was prepared as described above. The concentration of protein samples was measured by BCA assay (PIERCE, Rock ford, IL). Human EPO immunoassay kit, Quantikine IVD (R &D systems) was used for detection of recombinant human EPO (different from endogenous rat EPO). Each protein (100μl) sample was assayed in duplicate. The assay was performed as recommended by the manufacturer.
Data Analysis
Data were expressed as mean ± SEM. Statistical differences between the control and other groups were compared by one-way ANOVA and then, if a significant different was found, the Tukey-Kramer multiple comparison procedure. A probability value of P < 0.05 was considered statistically significant.
RESULTS
Expression of EPO and EPOR
In brain samples from normal pups, weak staining of endogenous EPO was observed. The insert in Fig. 1A demonstrated a few EPO positive cells in the normal cerebral cortex. After hypoxia insult, the expression of endogenous EPO was enhanced at 24 hours (Fig. 1A) and 72 hours (Fig. 1C), and lasted to 7 days (Fig. 1E) in the ipsilateral cortex. Higher magnification demonstrated that endogenous EPO was expressed in the neuronal cells, especially in the cytoplasm (Fig. 1G, 72 hours after hypoxia). More EPO positive cells were seen in the ipsilateral cortex in animals treated with rhEPO at 24 hours (Fig. 1B), 72 hours (Fig. 1D), and 7 days (Fig. 1F). Higher magnification demonstrated EPO was expressed in the cytoplasm of animals treated with rhEPO (Fig. 1H, 72 hours after hypoxia).

Immunocytochemical detection of EPO in the ipsilateral hemisphere of neonatal rats. In the insert in Fig. 1A, few EPO positive cells were identified. Fig. 1A, 1C, and 1E (scale bar 200 μm) demonstrated an elevated EPO expression in the ipsilateral cortex in animals after hypoxia-ischemia at 24 hours, 72 hours and at 7 days. Fig. 1G was the higher magnifications of Fig. 1C (scale bar 20 μm) and showed the EPO staining was mostly in the cytoplasm. rhEPO treatment enhanced markedly EPO expression in the ipsilateral cortex at 24 hours (Fig. 1B), 72 hours (Fig. 1D), and at 7 days (Fig. 1F). Higher magnification of Fig. 1D was shown in Fig. 1 H (scale bar 20 μm).
ELISA measured the concentrations of rhEPO in the ipsilateral hemisphere from 4 animals in each group. Since the ELISA kit is specific to rhEPO, endogenous EPO will not be measured. Therefore, zero rhEPO value was measured in the ipsilateral hemispheres of normal controls or hypoxia-ischemia without treatment pups. In animals treated with rhEPO, the concentrations of rhEPO in the ipsilateral hemispheres were 2.73 IU/g, 1.58 IU/g, and 0.00 IU/g (protein) at 24 hours, 72 hours, and 7 days, respectively (the last EPO treatment was at 48 hours).
Parallel to endogenous EPO expression, the expression of EPOR increased at 24 hours (Fig. 2A), 72 hours (Fig. 2C), and 7 days (Fig. 2E) after hypoxia insult. In rhEPO treated animals, an enhanced expression of EPOR was observed at 24 hours (Fig. 2B), 72 hours (Fig. 2D), and 7 days (Fig. 2F). rhEPO treatment up regulated the expression of EPOR. Higher magnification demonstrated that the expression of EPOR was in the neuronal cell membrane (Fig. 2H). A low level of EPOR expression was observed in the normal cortex in control animals (Fig. 2G).
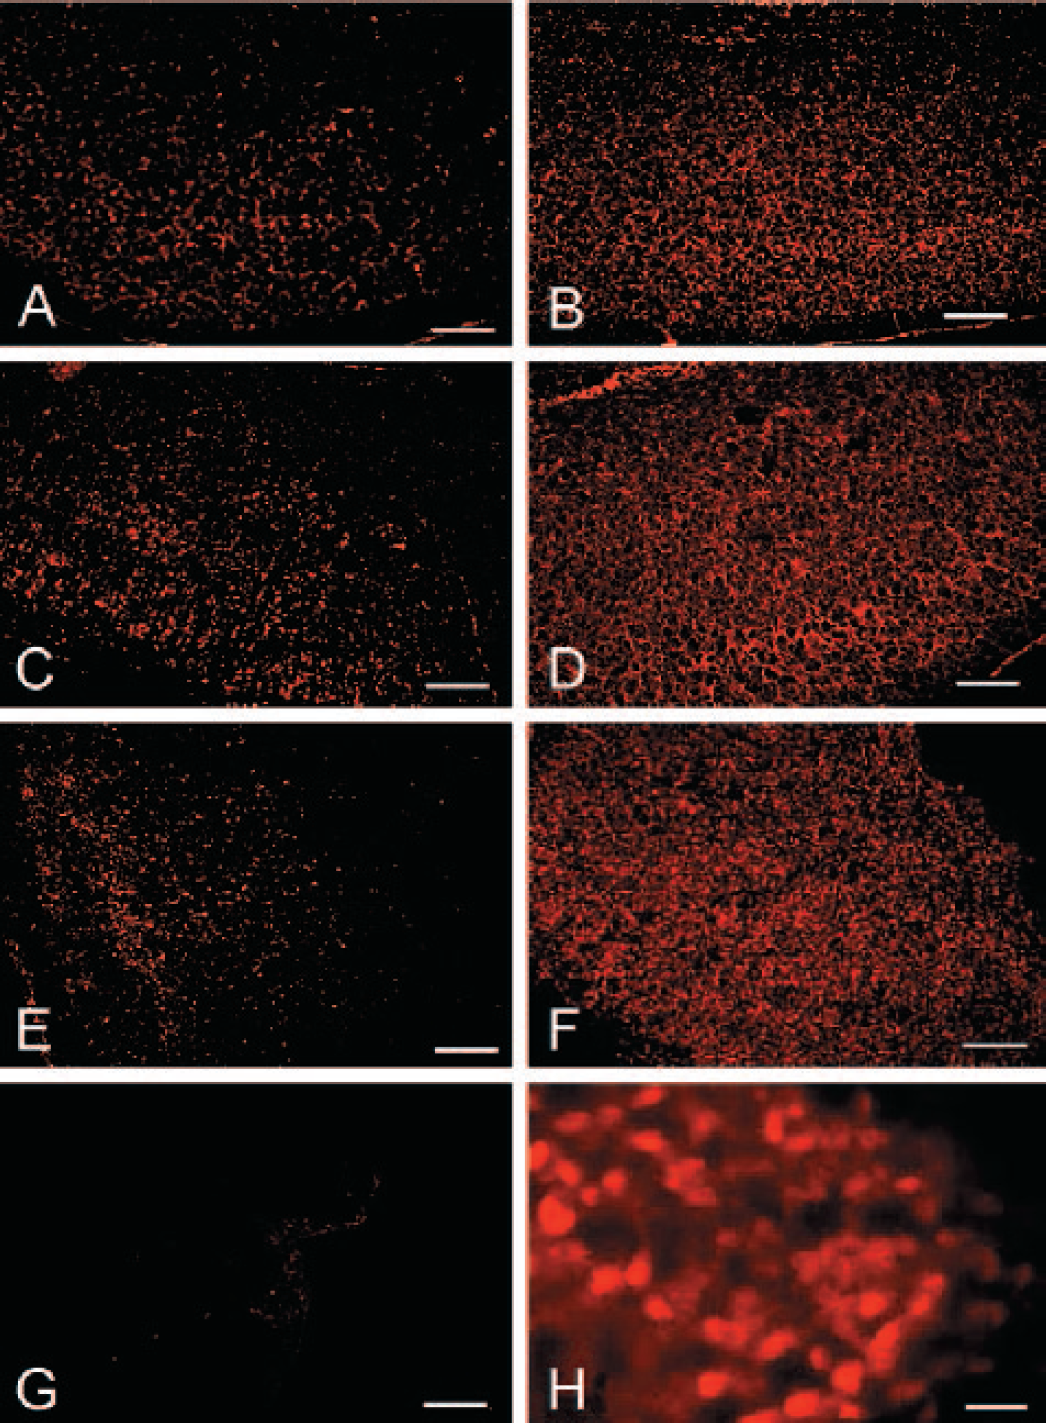
Expression of EPO receptor. Enhanced EPOR expression was observed in the ipsilateral cortex in animals of hypoxiaischemia at 24 hours (Fig. 2A), 72 hours (Fig. 2C), and at 7 days (Figure 2E), when compared with normal cortex (Fig. 2G) (scale bar 200 μm). Marked elevation of EPOR expression was obtained in the ipsilateral cortex in animals treated with rhEPO at 24 (Fig. 2B), 72 hours (Fig. 2D), and at 7 days (Fig. 2F). Higher magnification (scale bar 20 μm) of Fig. 2D was shown in Fig. 2F that EPOR was in the cell body or membrane.
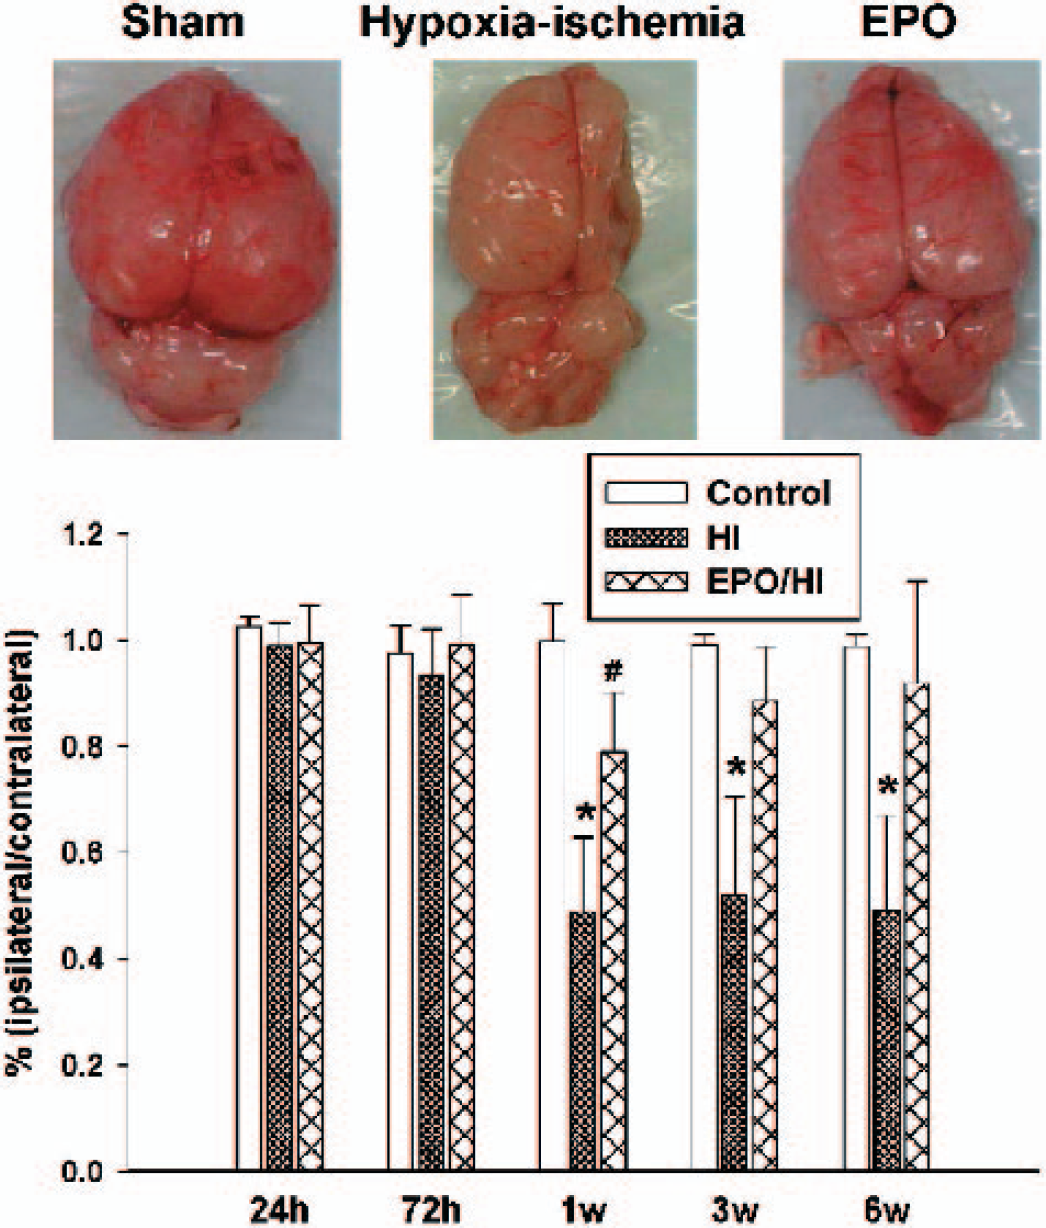
Brain weight. The top panel showed the brain photographs of pups from sham-operated (expose common carotid artery without ligation or hypoxia), hypoxia-ischemia, and hypoxia-ischemia plus rhEPO treatment groups 3 weeks after hypoxia. Severe brain atrophy occurred in hypoxia-ischemia but not in rhEPO treated pup. The low panel showed the summary of brain weight represented by ipsilateral hemisphere/contralateral hemisphere. Up to 50% brain weight loss occurred in pups suffered hypoxia-ischemia. rhEPO reduced brain weight loss at 7 days and enhanced brain weight gain at 3 and 6 weeks after hypoxia. From 8–15 samples were used from each group of pups for each designated time. * indicates P < 0.05 HI vs. control and # indicates P < 0.05 HI/EPO vs. control (ANOVA).
rhEPO Treatment Abolished Mortality
Among the 312 pups used in this study, 254 pups were subjected to hypoxia-ischemia and the rest served as normal control or sham-operated. In the hypoxia-ischemia group without rhEPO treatment, 38 out of 198 (mortality was 19%) pups died during hypoxia insult (in the hypoxia chamber). In the rhEPO treated group, none of the 56 pups died (mortality was 0).
rhEPO Preserved Brain Weight
The top panel of Fig. 3 shows photos of three representative samples from the sham-operated (expose carotid artery without ligation and without hypoxia), hypoxia-ischemia, and hypoxia-ischemia plus rhEPO treatment groups collected at 3 weeks after hypoxia insult. Severe brain atrophy occurred in the ipsilateral hemisphere after hypoxia-ischemia. rhEPO prevented brain injury and preserved brain shape at an almost normal level.
The lower panel of Fig. 3 demonstrates the brain weight of the three groups. Severe brain weight loss developed at one week and persisted up to 6 weeks after hypoxia-ischemia insult (P < 0.05 vs. control, ANOVA). rhEPO treatment reduced brain weight loss at 1 week (P < 0.05 vs. control, P < 0.05 vs. hypoxia-ischemia) and enhanced brain weight gain to an almost normal level at 3 or 6 weeks (P < 0.05 vs. hypoxia-ischemia, P > 0.05 vs. control). The absolute values of whole brain weight and ipsilateral or contralateral hemispheres are summarized in Table 1.
rhEPO Preserved Morphology
Figure 4 shows the morphology of brain sections in normal control (Fig. 4A) and hypoxia-ischemia without treatment at 4 hours (Fig. 4B), 24 hours (Fig. 4C), 72 hours (Fig. 4E), and 1 week (Fig. 4G). rhEPO reduced both brain loss and brain atrophy at 24 hours (Fig. 4D), 72 hours (Fig. 4F) and 1 week (Fig. 4H).
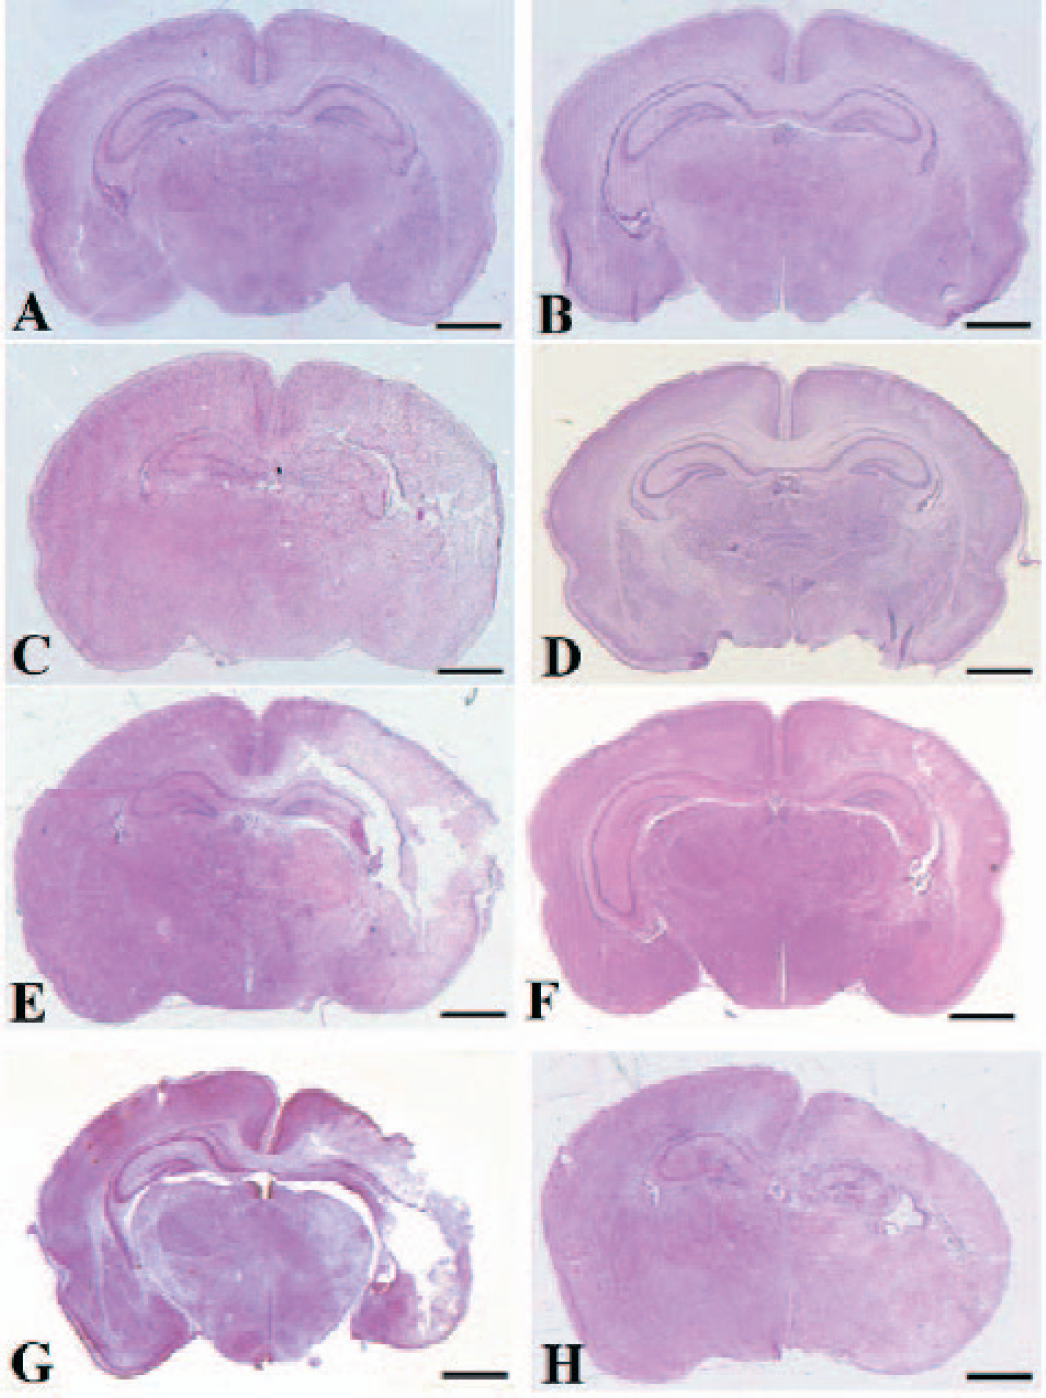
Brain morphology. Coronal brain sections at hippocampus region were shown for a normal pup (A), hypoxia at 4 hours (B), hypoxia at 24 hours (C), hypoxia pluses rhEPO at 24 hours (D), hypoxia at 72 hours (E), hypoxia pluses rhEPO at 72 hours (F), hypoxia at 1 week (G), and hypoxia pluses rhEPO at 1 week (H). Scale bar = 1mm.
rhEPO Abolished DNA Ladder and Decreased TUNEL Cells
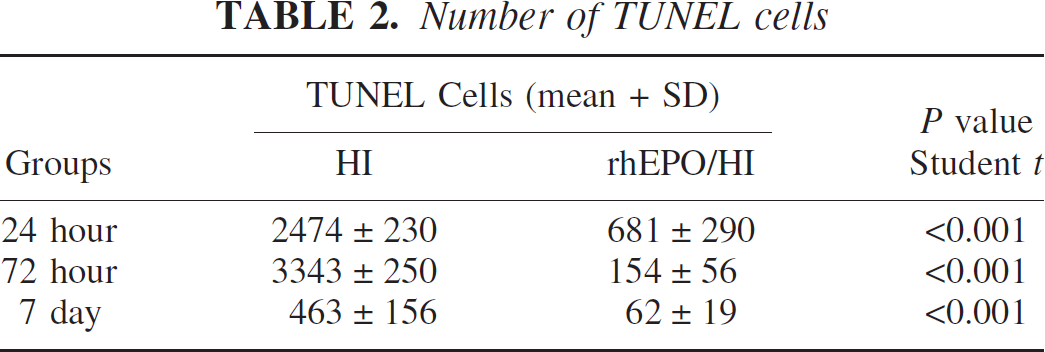
The morphological disorder observation in Fig. 4 was followed by TUNEL staining to establish a correlation between apoptosis and brain weight loss. Few TUNEL positive cells were observed in the normal control hemisphere (not shown) or in the contralateral hemisphere of the animals suffering from hypoxia-ischemia (Fig. 5). A marked increase in TUNEL positive cells was observed at 24 hours (Fig. 5A) and at 72 hours (Fig. 5C) in the ipsilateral hemisphere of animals in the hypoxia-ischemia group. A limited amount of TUNEL cells were observed in the atrophic hemisphere collected at 7 days after hypoxia-ischemia (Fig. 5E). Higher magnification demonstrated TUNEL positive staining in the nucleus in the ipsilateral cortex (Fig. 5G, area selected from Fig. 5A*). rhEPO treatment significantly reduced TUNEL positive cells in the injured hemisphere at 24 hours (Fig. 5B) and 72 hours (Fig. 5D). Higher magnification showed fewer TUNEL positive cells in the ipsilateral cortex of animals treated with rhEPO (Fig. 5H, area selected from Fig. 5B*). No apparent TUNEL staining or brain atrophy was observed in animals treated with rhEPO at Day 7 (Fig. 5F). Quantitative analysis using Imaging Pro-Plus counted TUNEL positive cells, and the results are summarized in Table 2. rhEPO treatment reduced (P < 0.01, student t-test) TUNEL cells at all time points examined.
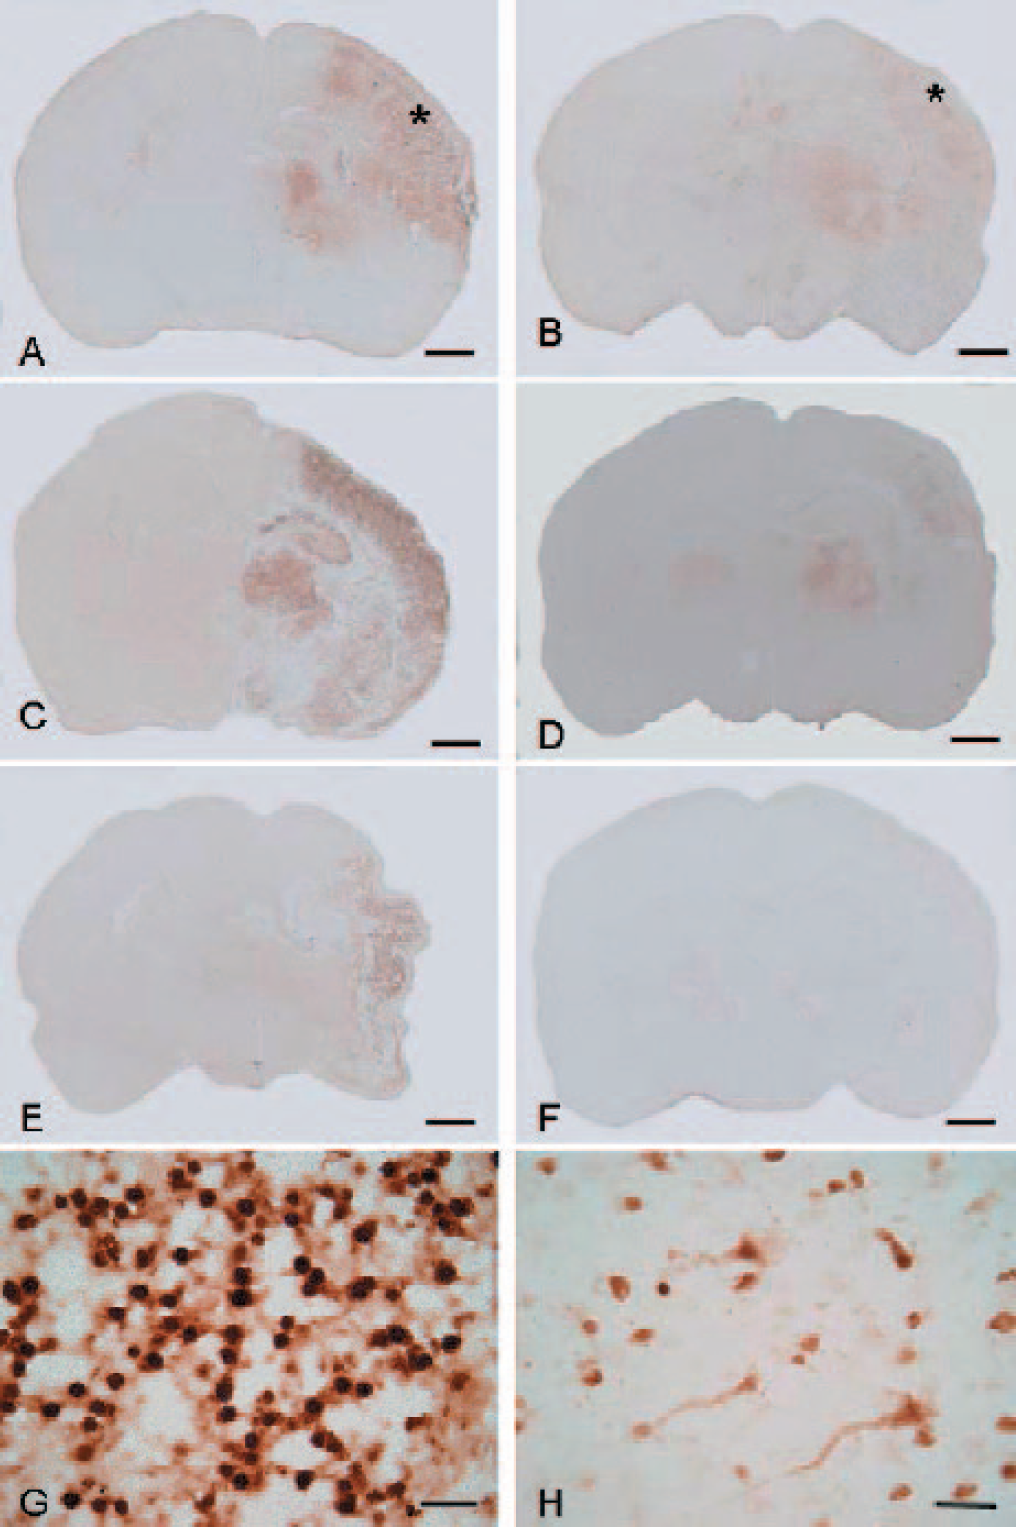
TUNEL staining. Few TUNEL positive cells were observed in the contralateral hemisphere of animals suffered hypoxia-ischemia. Samples of hypoxia-ischemia pups showed strong TUNEL staining in the ipsilateral hemisphere at 24 hours (A) and 72 hours (C) after hypoxia. Less TUNEL cells but severe brain atrophy occurred 7 days after hypoxia (E). Higher magnification (scale bar 20 μm) showed TUNEL staining is in the nucleus of neurons in the cortex (G) (area from * in A). rhEPO treatment reduced the TUNEL staining in the ipsilateral hemisphere of pups after hypoxia-ischemia at 24 hours (B) and 72 hours (D). No apparent TUNEL staining was observed at 7 days (F). Higher magnification (scale bar 20 μm) showed some TUNEL cells in the ipsilateral cortex after rhEPO treatment at 24 hours (H) (area from * in B). Scale bar = 1mm.
DNA ladder occurred in the ipsilateral hemispheres from hypoxia-ischemia animals at 48 hours and 72 hours (Fig. 6) but not in the normal control animals. No DNA ladder was observed in the ipsilateral hemisphere from pups treated with rhEPO at 48 hours, and weak DNA ladder was observed at 72 hours.
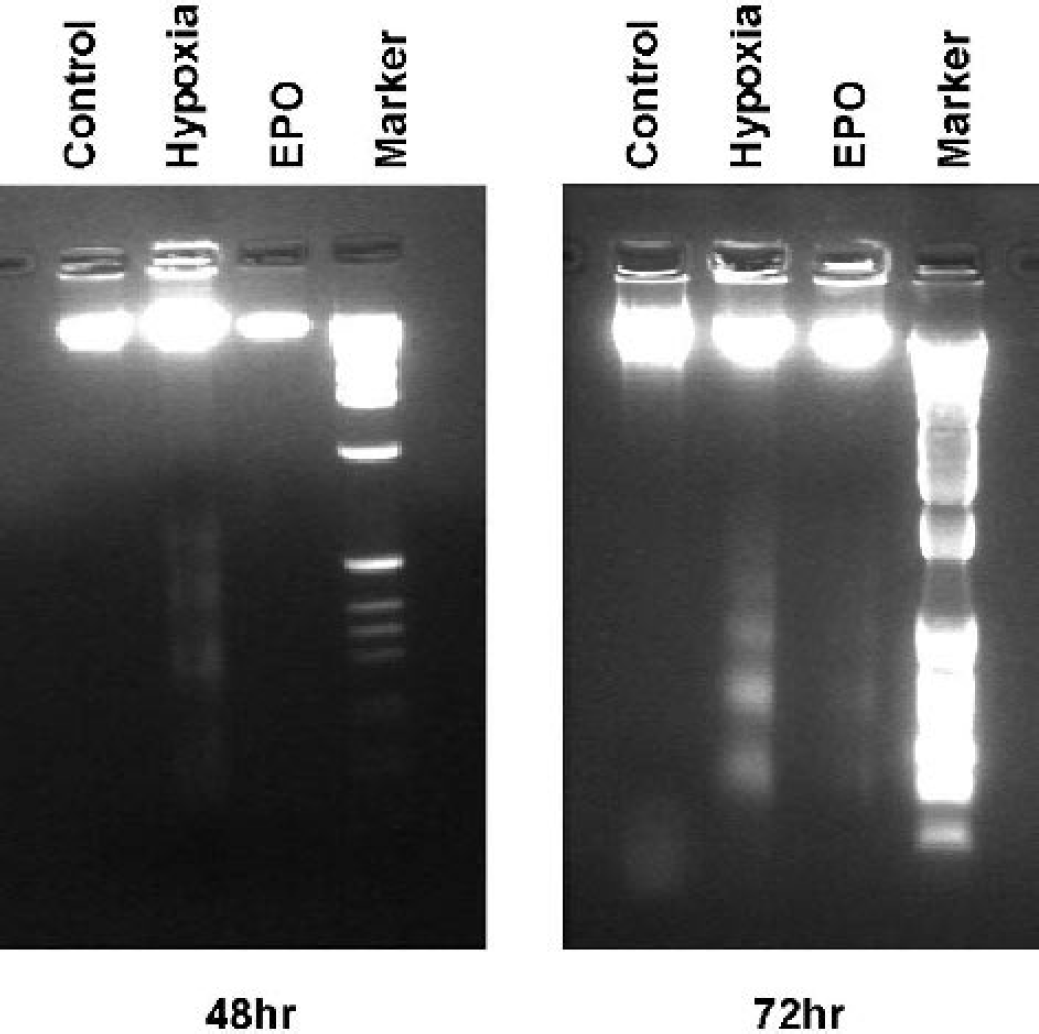
DNA ladder. DNA fragmentation was tested in the ipsilateral hemisphere of pups from normal control, hypoxia-ischemia, and hypoxia-ischemia plus rhEPO treatment groups at 48 hours and 72 hours after hypoxia. DNA ladders occurred in samples from hypoxia-ischemia pups but not in normal controls. rhEPO abolished DNA ladder examined at 48 hours after hypoxia insult. A weak DNA ladder was observed in rhEPO-treated samples at 72 hours after hypoxia. Six samples were used from each group of pups.
rhEPO Enhanced HSP27 Expression: Real-time RT-PCR
From our preliminary study using cDNA chip microarray we have found that mRNA of HSP27 was increased transiently at 4 hours in the ipsilateral hemisphere from hypoxia-ischemia pups. After rhEPO treatment, the level of mRNA of HSP27 increased persistently for 72 hours after hypoxia-ischemia insult. These results were further validated by real-time RT-PCR as shown in Fig. 7. PCR probes were designed according to the HSP27 sequence (M86389cds_s_at) in the gene bank. Without rhEPO treatment, hemispheres injured by hypoxia-ischemia showed a 60 times up regulation of HSP27 mRNA at 4 hours (P < 0.05 vs. control) and 2 times at 24 hours. With rhEPO treatment, 130 times elevation of HSP27 mRNA was observed at 4 hours and 35 times elevation was observed at 24 hours in the ipsilateral hemisphere. rhEPO significantly elevated HSP27 mRNA expression (P < 0.05 vs. control & hypoxia-ischemia).
rhEPO Enhanced HSP27 Expression: Western Blot
Figure 8 demonstrates a slight elevation of HSP27 protein at 24 hours and 72 hours after hypoxia-ischemia, which was not significantly different from normal control (P > 0.05, ANOVA). The level of HSP27 declined at 72 hours after hypoxia-ischemia to an almost normal level. rhEPO treatment markedly enhanced (P < 0.05 vs. control, ANOVA) HSP27 expression at 24 hours, 72 hours, and prolonged the expression of HSP27 up to 7 days when compared to control pups (P < 0.05 vs. normal control). No statistical significance was found between rhEPO treated and hypoxia-ischemia without treatment groups (P > 0.05).
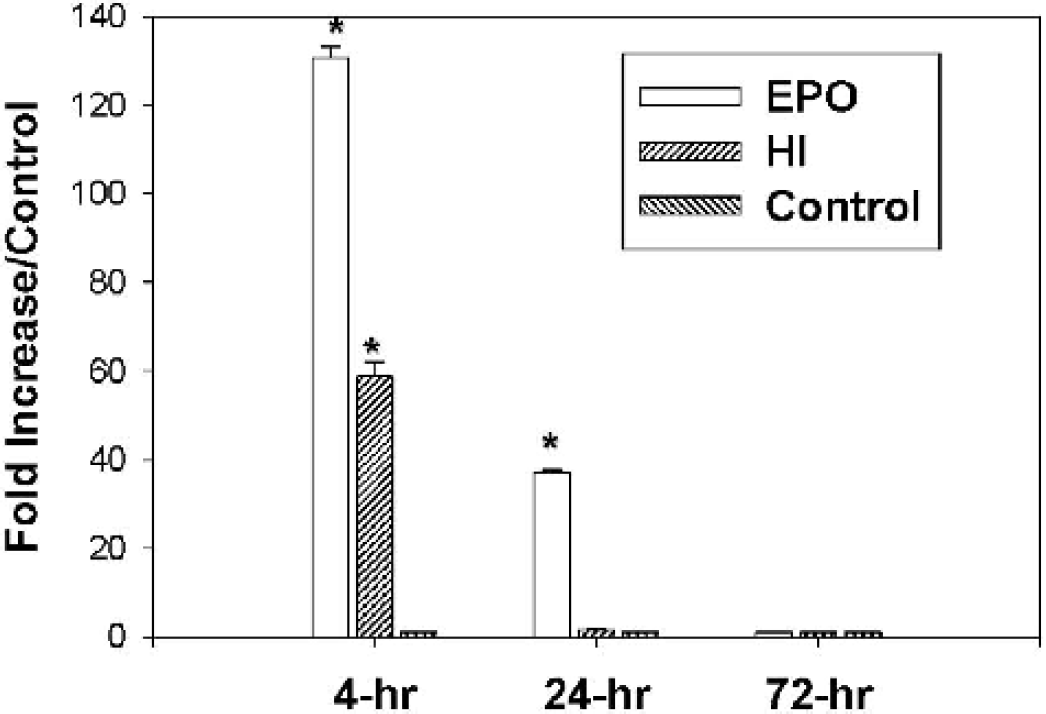
Real-time RT-PCR. An initial 60-fold increase of HSP27 mRNA was obtained in the ipsilateral hemisphere of pups at 4 hours after hypoxia-ischemia. The elevated HSP27 mRNA decayed rapidly within 24 hours. rhEPO treatment enhanced HSP27 mRNA to 130-fold at 4 hours and maintained HSP27 up to 30-fold at 24 hours after hypoxia. The levels of HSP27 dropped back to normal control level at 72 hours after hypoxia (rhEPO treatment was terminated by 48 hours after hypoxia). Eight samples were used from each group of pups.
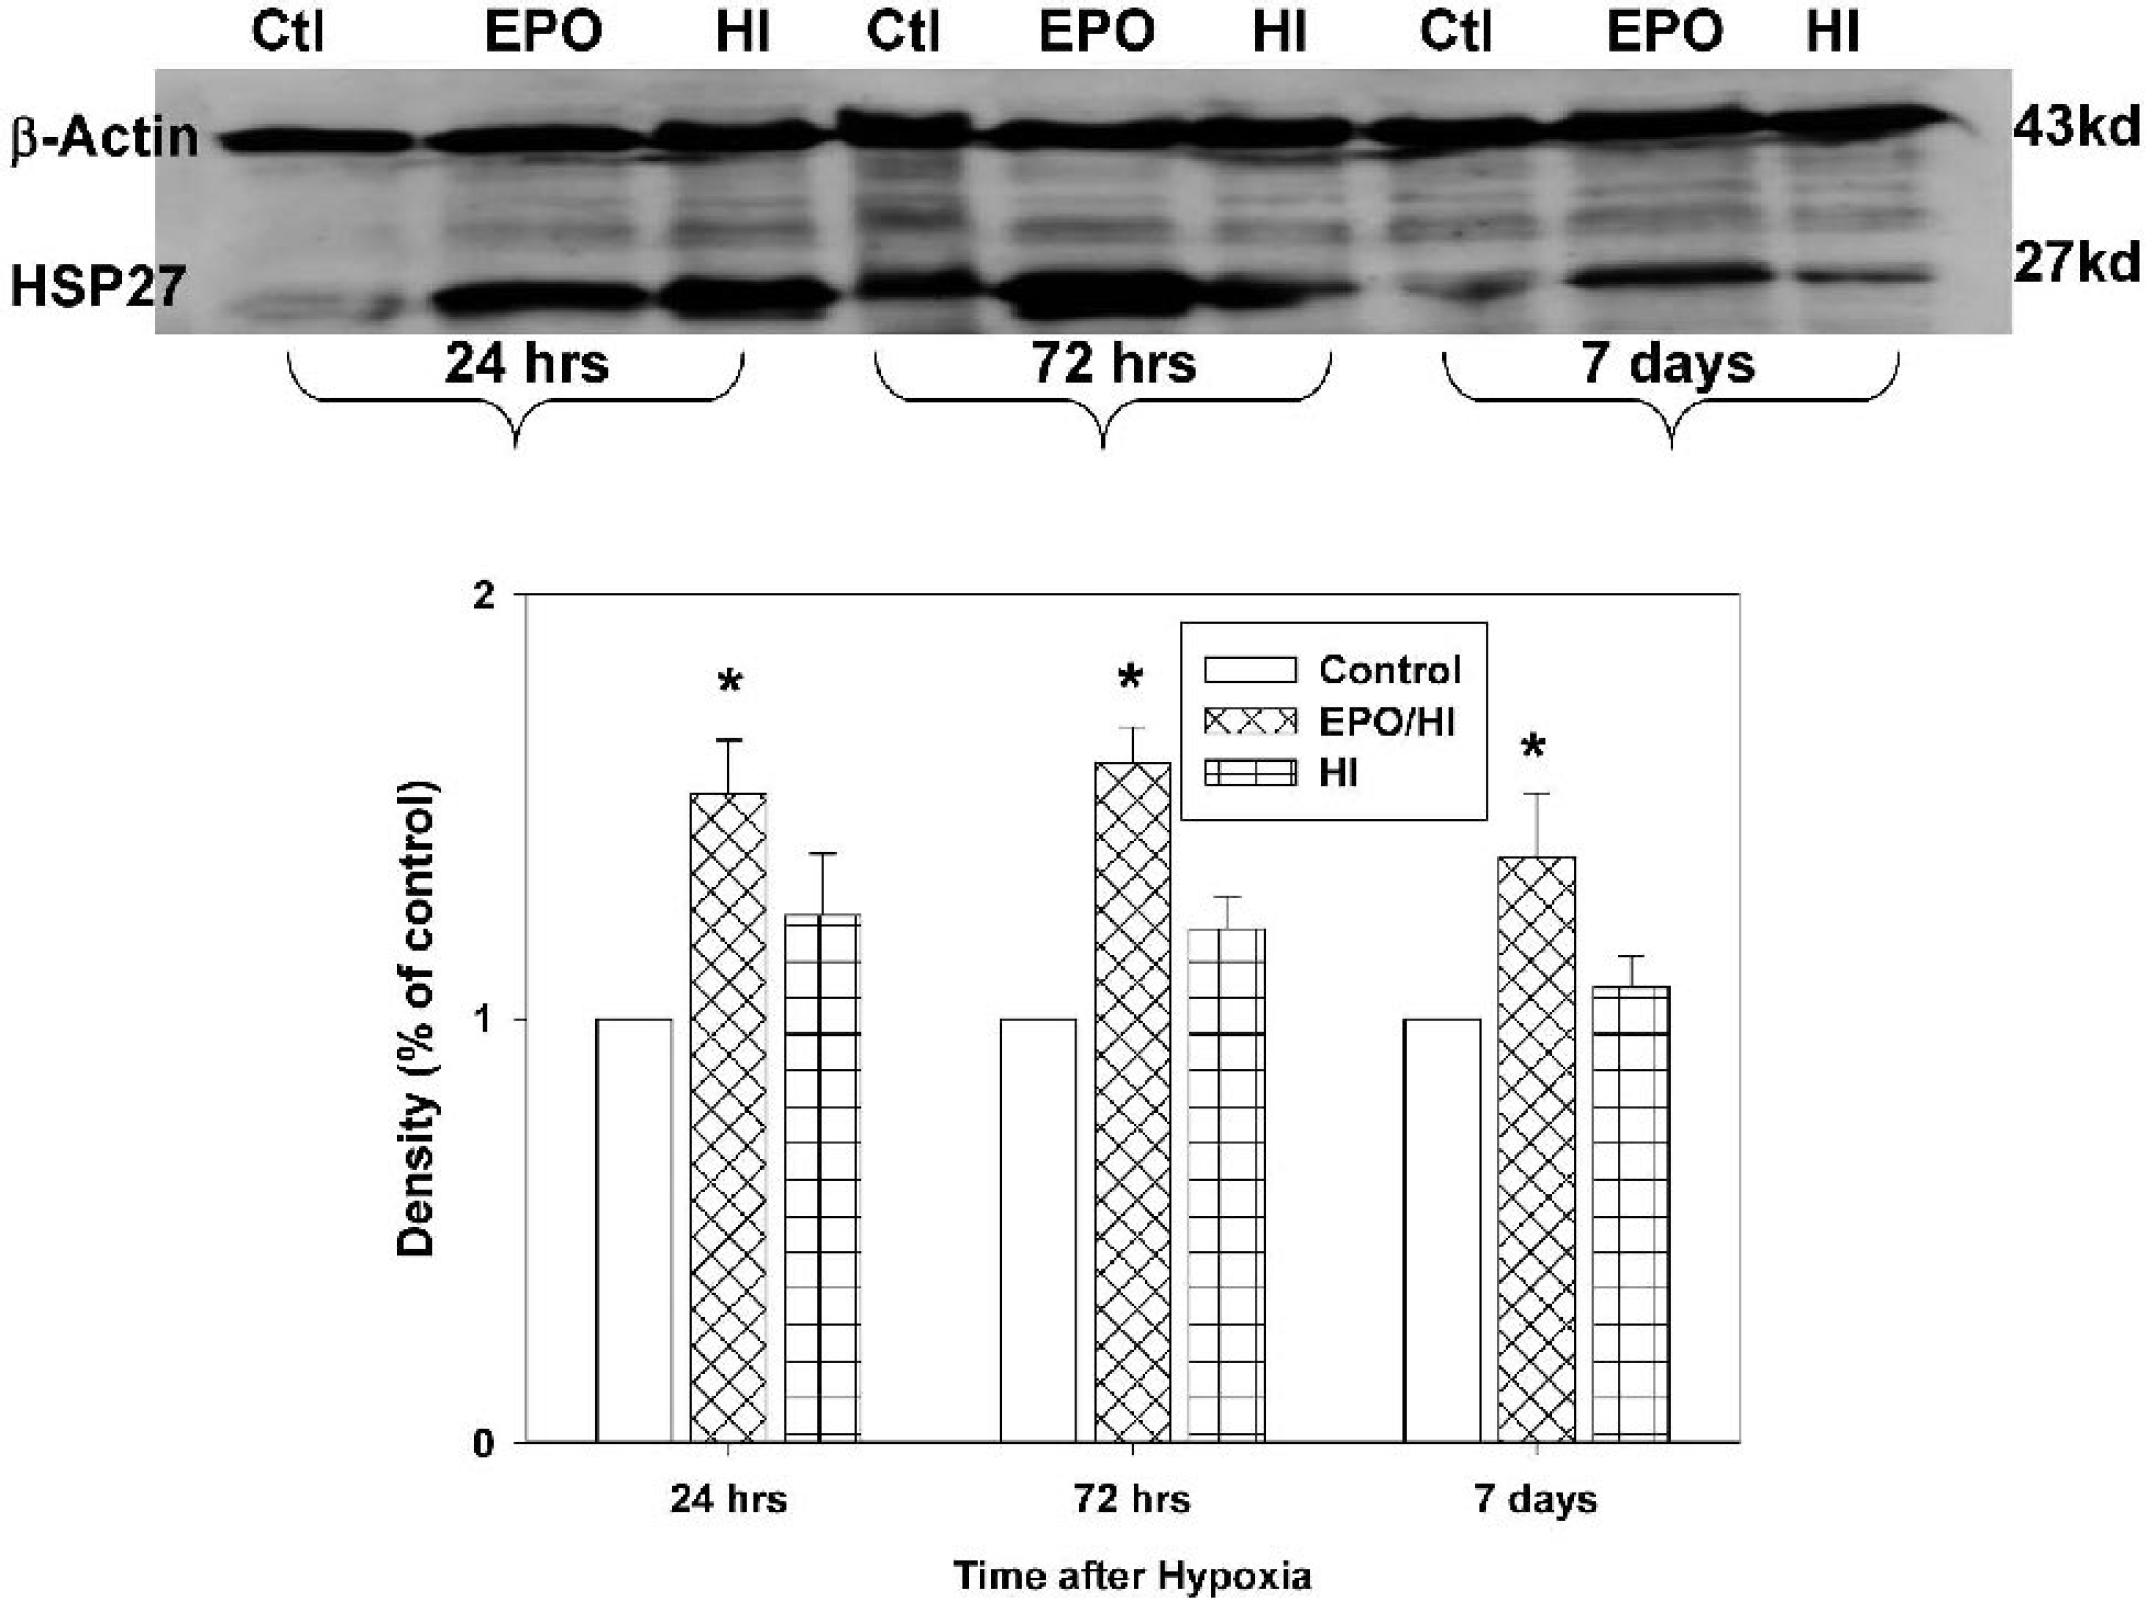
Western blot of HSP27. Hypoxia-ischemia increased insignificantly HSP27 protein expression in the ipsilateral cortex at 24 hours and 72 hours after hypoxia (P > 0.05 vs. control, ANOVA). The level of HSP27 decayed almost to the control level at 7 days (P > 0.05). rhEPO treatment enhanced the level of HSP27 at 24 hours and 72 hours (p < 0.05 vs. control, ANOVA) and prolonged the expression of HSP27 significantly higher (P < 0.05) at 7 days after hypoxia. Six samples were used from each group of pups.
rhEPO on TUNEL and HSP27 Double Labeling
Epidemiology of Stroke and Traumatic Brain Injury (USA statistics)
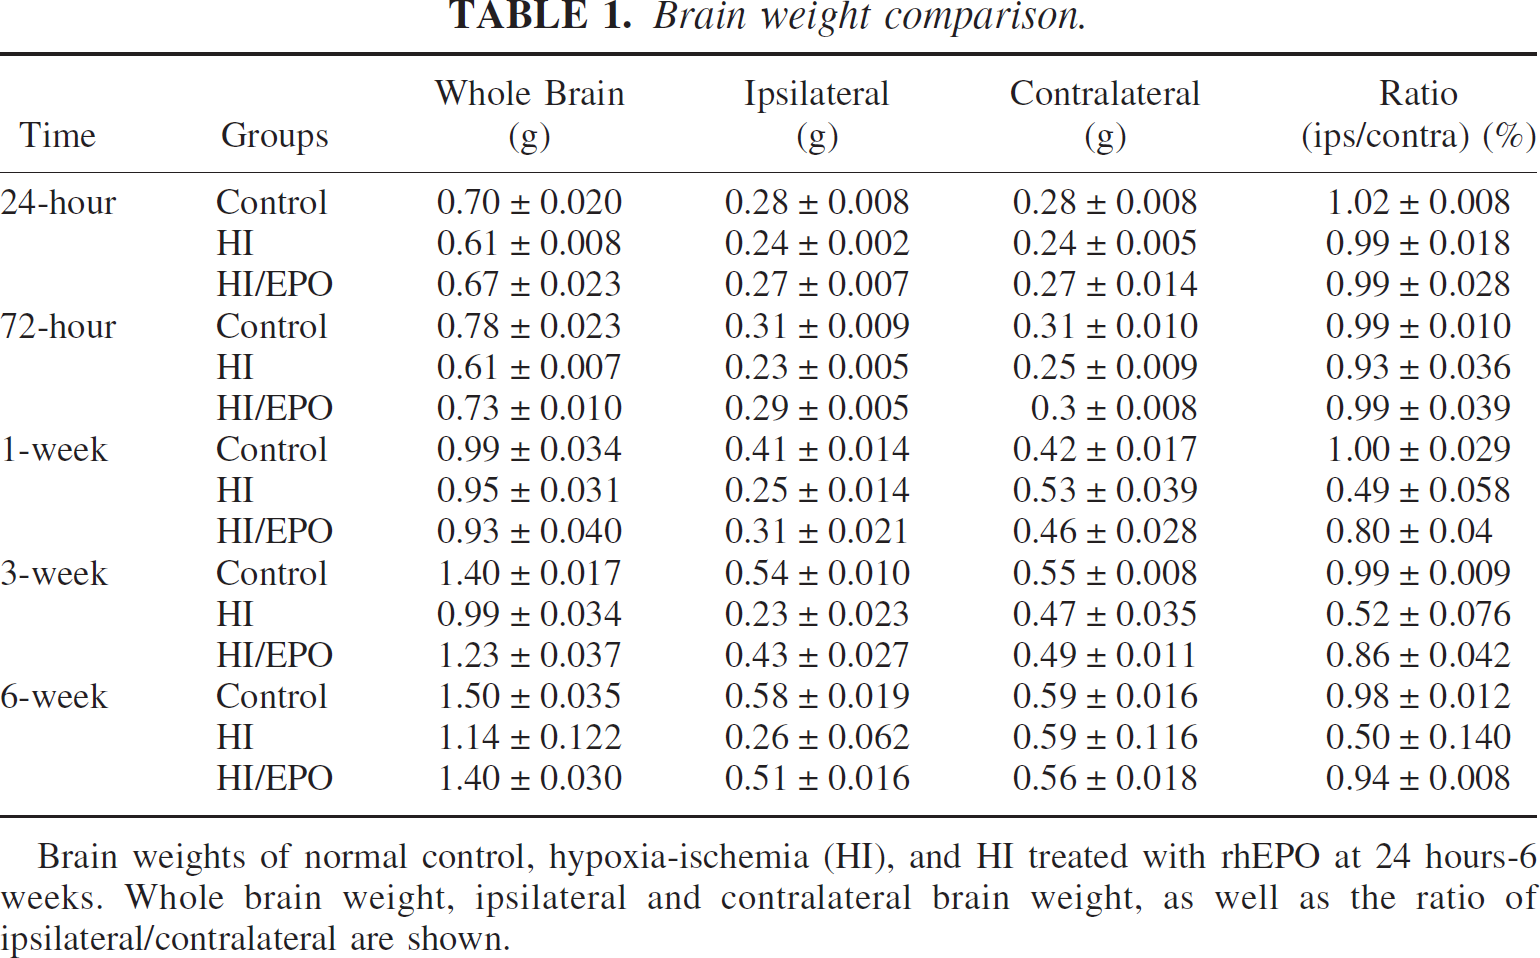
Brain weights of normal control, hypoxia-ischemia (HI), and HI treated with rhEPO at 24 hours-6 weeks. Whole brain weight, ipsilateral and contralateral brain weight, as well as the ratio of ipsilateral/contralateral are shown.
Limited TUNEL positive cells (green) or HSP27 staining (red) were observed in the contralateral side of the hemisphere (inserts in Fig. 9A-B). Significant TUNEL and HSP27 staining were shown in the ipsilateral hemisphere in an animal at 48 hours after hypoxia insult (Fig. 9A-B). In a rhEPO treated animal (48 hours after hypoxia), the staining of TUNEL cells in the ipsilateral hemisphere was diminished (Fig. 9C), and the staining of HSP27 remained highly expressed (Fig. 9D). At higher magnification, Fig. 9E1–2 shows more TUNEL positive cells and less HSP27 in the ipsilateral hemisphere after hypoxia-ischemia without treatment. Fewer TUNEL cells and more HSP27 positive cells were shown in Fig. 9F1-F2 in the ipsilateral hemisphere after hypoxia-ischemia with rhEPO treatment. Figure 9E3 was generated by superimposing Figs. 9E1 and E2. Figure 9E3 shows no HSP27 staining in TUNEL positive cells. Figure 9F3 was generated by superimposing Figs. 9F1 and F2. Figure 9F3 shows that most HSP27 positive cells were negative to TUNEL staining
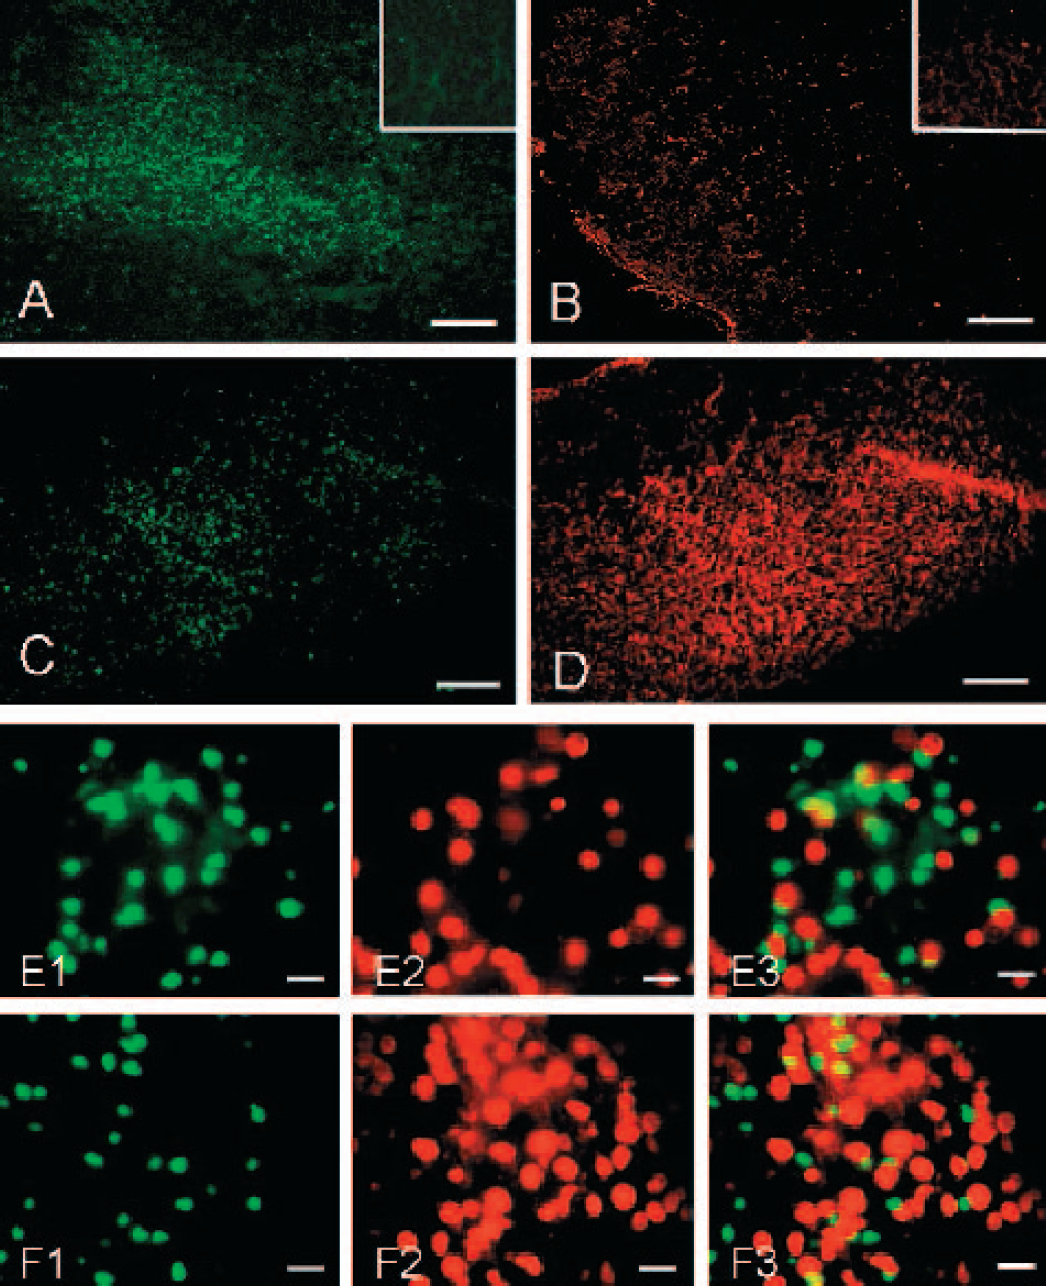
Double labeling of TUNEL and HSP27. At 24 hours after hypoxia, TUNEL (green) and HSP27 (red) positive staining cells were shown in the ipsilateral cortex (A,B) (scale bar 200 μm). The inserts showed the extremely weak staining from contralateral cortex in the same animals. Figure 9C-D demonstrated TUNEL and HSP27 staining in the ipsilateral cortex in an rhEPO treated pup: less TUNEL but more HSP27 staining observed (scale bar 200 μm). Higher magnification was shown in E1 and E2 (from A-B) and superimposed in E3 (scale bar 20 μm), implicating TUNEL cells without HSP27 staining and vice versa. After rhEPO treatment, high power pictures (scale bar 20 μm) showed less TUNEL (F1) and more HSP27 (F2) cells in the ipsilateral cortex. Superimposed picture (F3) demonstrated less TUNEL staining in HSP27 positive cells.
DISCUSSION
We have demonstrated that an increase in endogenous EPO expression was accompanied by an elevated expression of EPOR in the ischemic hemisphere of pups subjected to hypoxia-ischemia insult. Exogenous rhEPO treatment prolonged and enhanced the expression of EPO and EPOR to at least one week after hypoxia-ischemia, which is the acute injury period. rhEPO treatment remarkably preserved the brain morphology and brain weight. Part of the mechanisms for rhEPO-induced brain protection was the inhibition of apoptosis in the hypoxic-ischemic hemisphere, supported by the results from DNA ladder and TUNEL staining. One of the links between rhEPO and its anti-apoptotic action was HSP27: rhEPO enhanced the transcription expression of HSP27 at 4 to 24 hours after hypoxia. The protein level of HSP27 was markedly enhanced to at least to one week after the termination of rhEPO treatment at 48 hours. HSP27 positive cells were negative to TUNEL staining. Beyond these observations, rhEPO eliminated the mortality, which was about 19% for this animal model of hypoxia-ischemia.
Number of TUNEL cells
Higher dosages (1,000 to 5,000 units/kg) were used in studies examining the neuroprotective action of rhEPO in neonatal or fetal hypoxia-ischemia models (Kumral et al. 2003; Solaroglu et al. 2003), as well as in other animal models of CNS injuries (references see above). High doses of rhEPO are used systemically because rhEPO does not normally cross the blood-brain barrier (Buemi et al. 2000), and high doses of rhEPO might increase the rate at which rhEPO passes through a dysfunctional blood-brain barrier after brain injury (Brines et al. 2000; Cerami 2001; Dame et al. 2001; Eid and Brines 2002). However, more evidence is needed to support whether rhEPO crosses the blood-brain barrier in neonates (Juul et al. 1999a). In the present study, exogenous rhEPO preserved brain weight and morphology, reduced apoptosis, and enhanced HSP27 expression indicating that rhEPO probably crossed the blood-brain barrier. This presumption was further confirmed by the measurement of rhEPO (ELISA) in the ischemic hemisphere in the presence or absence of rhEPO therapy. rhEPO was found only in rats treated with exogenous rhEPO but not in control or hypoxia-ischemia rats, even though endogenous EPO was observed in the ipsilateral cortex of rats with hypoxia-ischemia (immunohistochemistry). Indirect evidence that rhEPO crossed the blood-brain barrier is that prolonged and enhanced expression of EPO and EPOR was observed up to one week after rhEPO treatment. An important observation in the present study was that rhEPO application for 3 days did not down regulate EPOR, but it prolonged the expression of EPOR in this hypoxia-ischemia model. Long-term rhEPO application may down regulate EPOR and reduce the therapeutic effect of rhEPO (Chong et al. 2002b). It is not clear whether large doses of rhEPO cause unwanted effects, especially hypertension, which leads to encephalopathy and seizures (Brown et al. 1990). We pre-treated animals with 300 units and then used the same dose for an additional two days (total dose: 900 units). Since the pups' body weight is around 15 to 20 g, 300 units which translate into 15,000 – 20,000 units/kg. Our dosage is similar to two studies using a similar rat pup model (Dzietko et al. 2002; Matsushita et al. 2002). In our preliminary experiments, we used rhEPO in normal pups and examined brain morphology for comparison with normal pups not treated with rhEPO. We did not find any difference between normal pups and normal pups treated with rhEPO (preliminary data). Through out the entire study, we did not observe any neurological disorders such as movement disorders or seizures (due to possible hypertensive encephalitis) or death. On the contrary, rhEPO abolished mortality in the present study. In addition, we did not observe any changes in eating or drinking in pups treated with rhEPO. Overall, we did not observe marked toxicity associated with large dosages of rhEPO in the present study.
Infants have lower EPO levels than adults, and premature neonates have even lower levels of EPO (Eckardt 1995). The level of EPO in the blood or cerebral spinal fluid is used as a marker for infant stress or hypoxia (Ruth et al. 1988; Eckardt 1995; Juul et al. 1999a). Hypoxia induces EPO expression in the ischemic or hypoxic brain regions in adults (Chavez and LaManna 2002) and in neonates (Bergeron et al. 2000). The endogenous EPO induced by hypoxia is believed to offer brain protection in adults and in neonates (Juul 2000; Dame et al. 2001). Indeed, administration of a soluble EPOR, which neutralizes EPO, enhances ischemic brain injury (Sakanaka et al. 1998). In the present study, we have found that EPO expression was limited in a few cells in the hemispheres of normal pups, but was enhanced and expressed mainly in the cytoplasm of neuronal cells in the hypoxic hemisphere. A corresponding elevated expression of EPOR occurred after hypoxia insult. These enhanced expressions of EPO and EPOR may offer a certain degree of brain protection (Bergeron et al. 2000; Chavez and LaManna 2002; Bernaudin et al. 2002). These possible limited neuroprotective actions of endogenous EPO, however, were not sufficient to counter the hypoxia-induced brain injury. Brain weight loss and extensive apoptosis occurred, as shown in our results. Exogenous EPO is required to prevent or reduce brain injury after neonatal hypoxia-ischemia.
The mechanisms of rhEPO-induced brain protection involve multiple pathways, including anti-apoptosis, activation of tyrosine kinase and, especially, mitogen-activated protein kinase for proliferation and differentiation. Some of these actions are mediated by NF-κB, Jak2, and Akt (Digicaylioglu and Lipton 2001; Chong et al. 2002b). In addition to these mechanisms, we have identified another factor, HSP27, in the present study. HSP27 may promote or mediate the action of rhEPO on apoptosis. Heat or other stressors induce heat shock proteins in a variety of cell types, which protect cells from insults such as ischemia, oxidative stress, and noxious chemicals (Kogure and Kato 1993; Kitagawa et al. 2001). The expression of HSP has been reported in the neonatal hypoxia-ischemia model, including HSP68 (Dwyer et al. 1989), HSP70 (Gubits et al. 1993; Munell et al. 1994), and HSP72 (Ferriero et al. 1990). HSP27 is one of the small heat shock proteins and expresses in many cell types and tissues involved in cell development and differentiation. In the present study, we have found an up regulated mRNA of HSP27 (real time RT-PCR) at 4 hours and 24 hours and an elevated protein level of HSP27 at 24 hours to 7 days (Western blot) after rhEPO treatment. More interestingly, we have found that most neurons that expressed HSP27 after rhEPO treatment were negative to TUNEL staining, and most neurons that stained positive to TUNEL without rhEPO treatment were negative to HSP27 (Fig. 9). These observations indicated that rhEPO enhanced and prolonged the activation of HSP27, which expressed in the ischemichypoxic hemisphere and protected cells from apoptosis. Since most apoptotic changes occurred around 24 hours to 72 hours after hypoxia insult in this neonatal model (Cheng et al. 1998; Blomgren et al. 2001), an elevation of HSP27 during this period provided additional or synergistic contributions to the anti-apoptotic action ofrhEPO. Similar observations that HSP70 binds with caspase-3 to reduce apoptosis (McLaughlin et al. 2003), HSP72 prevents ischemic brain injury (Nowak and Jacewicz 1994), and HSP27 is responsible for thrombin-induced brain tolerance (Xi et al. 2000) have been reported. Others have reviewed detailed roles and mechanisms of HSP27 in neuronal survival and differentiation (Calabrese et al. 2002).
Footnotes
Acknowledgements
We thank Mrs. Caraline Domb for proof-reading and editing this article.