
Abstract
Pixel-by-pixel spatiotemporal progression of focal ischemia (permanent occlusion) in rats was investigated using quantitative perfusion and diffusion magnetic resonance imaging every 30 minutes for 3 hours. The normal left-hemisphere apparent diffusion coefficient (ADC) was 0.76 ± 0.03 × 10⁻³ mm2/s and CBF was 0.7 ± 0.3 mL · g−1 · min−1 (mean ± SD, n = 5). The ADC and CBF viability thresholds yielding the lesion volumes (LV) at 3 hours that best approximated the 2,3,5-triphenyltetrazolium chloride (TTC) infarct volumes (200 ± 30 mm2) at 24 hours were 0.53 ± 0.02 × 10⁻³ mm2/s (30% ± 2% reduction) and 0.30 ± 0.09 mL · g−1 · min−1 (57% ±11% reduction), respectively. Temporal evolution of the ADC- and CBF-defined LV showed a significant “perfusion-diffusion mismatch” up to 2 hours (P < 0.05, n = 11), a potential therapeutic window. Based on the viability thresholds, three pixel clusters were identified on the CBF-ADC scatterplots: (1) a “normal” cluster with normal CBF and ADC, (2) an “ischemic core” cluster with markedly reduced CBF and ADC, and (3) a “mismatch” cluster with reduced CBF but slightly reduced ADC. These clusters were color-coded and mapped onto the image and CBF-ADC spaces. Lesions grew peripheral and medial to the initial ADC abnormality. In contrast to the CBF distribution, the ADC distribution in the ischemic hemisphere was bimodal; the relatively time-invariant bimodal-ADC minima were 0.57 ± 0.02 × 10⁻³ mm2/s (corresponding CBF 0.35 ± 0.04 mL · g−1 · min−1), surprisingly similar to the TTC-derived thresholds. Together, these results illustrate an analysis approach to systemically track the pixel-by-pixel spatiotemporal progression of acute ischemic brain injury.
Predicting tissue fate in ischemic injury is of critical importance in the treatment of ischemic brain injury. Data from experimental animal stroke models and stroke patients have shown that there is usually a gradual progression of potentially reversible cerebral ischemic injury toward infarction (Hossmann, 1995). A central core with severely compromised CBF is surrounded by a rim of moderately ischemic tissue with diminished CBF and impaired electrical activity but preserved cellular metabolism and viability, frequently referred to as the “ischemic penumbra” (Astrup et al., 1981). The transition from reversible to irreversible injury is complex and highly dependent on the duration and severity of ischemia, and as such different areas of the penumbra could have variable outcomes. Reestablishing tissue perfusion and/or administering neuroprotective drugs in a timely fashion can salvage some ischemic tissues (Albers, 1999; NINDS, 1995). For example, clinical trials have shown the benefits of thrombolytic therapy within 3 hours after the onset of ischemia (Kidwell et al., 2000). To potentially help to expand the time window for thrombolytic therapy, it is critical to have the means to identify “tissue signature” and “clock window” to achieve the maximum benefit and to avoid devastating intraparenchymal hemorrhage (Albers, 1999). It is therefore important to establish noninvasive imaging techniques and analysis approach that can differentiate “salvageable” versus “nonsalvageable” tissues (Kaufmann, 1999; Schlaug et al., 1999).
Diffusion-weighted (DWI) and perfusion-weighted (PWI) magnetic resonance imaging (MRI) have been widely used to investigate cerebral ischemic injury in animal models and humans. Hyperintense regions on DWI correspond to tissues with a reduced apparent diffusion coefficient (ADC) of water. Although the biophysical mechanism(s) underlying ADC reduction remains poorly understood and controversial (Duong et al., 1998, 2001; Moseley et al., 1990; Neil et al., 1996; Silva et al., 2002; van der Toorn et al., 1996; Wick et al., 1996; Zhong et al., 1993), the ADC decline has been correlated with energy failure and breakdown of membrane potential in animal models (Back, 1994; Hossmann, 1995; Kohno et al., 1995). Similarly, PWI yields a qualitative index of tissue perfusion. The most widely used PWI approach is based on dynamic imaging of an exogenous paramagnetic MRI contract agent (Calamante et al., 1999). Hypointense regions on the PWI are indicative of reduced tissue perfusion. Quantitative perfusion and diffusion imaging could potentially yield a finer discrimination of tissue status based on their intrinsic diffusion and perfusion characteristics.
In humans, the “perfusion-diffusion mismatch” is presumed to approximate the ischemic penumbra. Although the strict definition of ischemic penumbra requires correlation with energy metabolism (Back, 1994; Hoehn-Berlage et al., 1995; Kohno et al., 1995) and such correlation is not feasible in humans, the ischemic penumbra and viability thresholds have been operationally defined based on DWI, PWI, and equivalent modalities. Schlaug et al. (1999), using DWI and PWI, reported the CBF in the ischemic core to be 12% of normal and the CBF in the penumbra to be 39% of normal. Kaufmann et al. (1999), using xenon computed tomography, reported a quantitative CBF value in the ischemic core of 0.06 mL · g−1 · min−1, and in the ischemic penumbra between 0.07 and 0.20 mL · g−1 · min−1 in humans. Most studies to date involved region-of-interest (ROI) analysis. Although ROI analysis is helpful in simplifying a complex analysis problem, these ROIs contain tissues with different ADC and CBF characteristics, thereby inadvertently mixing the characteristics that one is trying to resolve. Pixel-by-pixel analysis combining quantitative diffusion and perfusion data without ROI prescription could offer a unique means to identify and predict ischemic tissue fate of individual pixels.
Although the “perfusion-diffusion mismatch” is widely observed in acute human stroke (Albers, 1999; Heiss and Graf, 1994; NINDS, 1995; Schlaug et al., 1999; Rohl et al., 2001), similar observations in animal stroke models have been limited and the temporal evolution of the perfusion-diffusion mismatch in animal models has yet to be systematically investigated. Animal models where focal ischemia can be reproducibly studied under controlled conditions would be important for identifying and predicting the severity of ischemic injury and for evaluating the efficacy of therapeutic intervention. In this study, we used quantitative perfusion and diffusion imaging to investigate the temporal and spatial evolution of focal ischemia after permanent intraluminal middle cerebral artery occlusion (MCAO) in rats during the acute phase. We focused on quantitative perfusion and diffusion imaging of the acute phase because proton density (given by M0), T1 and T2 relaxation times are generally unaffected early after stroke onset and only begin to change with the advent of vasogenic edema (i.e., typically > 4 hours) (Helpern et al., 1993; Knight et al., 1994). The main goals were to establish and validate the absolute ADC and CBF viability thresholds below which tissues are destined to become infarcted, and to evaluate, pixel-by-pixel, the temporal and spatial evolution of ischemia using combined diffusion and perfusion analysis. These results were correlated with histology at 24 hours after ischemia.
MATERIALS AND METHODS
Animal preparations
Male Sprague-Dawley rats (300 to 350 g, Taconic Farms, NY, U.S.A.) were initially anesthetized intraperitoneally with choral hydrate (400 mg/kg, Sigma, St. Louis, MO, U.S.A.). The right femoral artery was catheterized for blood-gas sampling, continuous blood-pressure and heart-rate monitoring (BIOPAC, Santa Barbara, CA, U.S.A.). Permanent focal brain ischemia of the right hemisphere was induced using the intraluminal suture occlusion method (Li et al., 1999). Rectal temperature was maintained at 36.5°C to 37.5°C and respirations were recorded throughout the study. Anesthesia was switched to ∼1% isoflurane once the animal was in the magnet and during imaging. Imaging was performed at 30, 60, 90, 120, and 180 minutes after occlusion, followed by TTC (2,3,5-triphenyltetrazolium chloride) staining for infarct volume at 24 hours (Li et al., 1999). Two groups of rats were studied. In group I (n = 5), ADC and CBF thresholds were established. In group II (n = 6), these thresholds were tested for reliability. All stroke rats survived 24 hours after ischemia.
Magnetic resonance experiments
Magnetic resonance imaging was performed on a Bruker 4.7-T/40-cm magnet (Billerica, MA, U.S.A.) and a 20-G/cm gradient insert (12-cm inner diameter, 120-μs rise time). The animal was placed into a stereotaxic headset and on the cradle, which had a built-in surface coil (2.3-cm inner diameter) for brain imaging and a neck coil for CBF labeling. Coil-to-coil electromagnetic interaction was actively decoupled.
The average apparent diffusion coefficient (ADCav) of water was obtained by averaging three ADC maps acquired separately with diffusion-sensitive gradients applied along the x, y, or z direction. Single-shot, spin-echo, echo-planar images (EPI) were acquired with a 64 × 64 matrix, 2.5 × 1.9-cm field of view, six 1.5-mm slices, 2-second repetition time (90° flip angle), 43-millisecond echo time, b values of 10 and 1,504 s/mm2, 20-millisecond Δ, 6.5-millisecond δ, and 16 averages.
Quantitative CBF was measured using the continuous arterial spin-labeling technique (Duong et al., 2000; Sicard et al., 2003; Silva et al., 2000) with single-shot, gradient-echo EPI. MRI parameters were similar to the ADC measurement except that the echo time was 13 milliseconds. Labeling used a 1.78-second square radiofrequency pulse applied to the neck coil in the presence of a 1.0-G/cm gradient (Detre et al., 1992). Fifty pairs were acquired before and 50 pairs after the ADC measurement for signal averaging. Multislice CBF measurements prevented the use of spin-echo EPI acquisition because of the relatively long spin-echo time. Although differences between spin-echo and gradient-echo EPI could cause pixel misalignment at the skull-brain interface and around the ear canals, this difference was minimized by using short gradient-echo time and careful shimming. Further, a conservative ROI avoiding the skull-brain interface was used for data analysis.
Data analysis
For histologic analysis, brain slices were photographed and analyzed using the software BioScan OPTIMAS (Edmonds, WA, U.S.A.). Edema correction was applied (Tatlisumak et al., 1998). The MRI analysis used codes written in Matlab (Math-Works, Natick, MA, U.S.A.) and STIMULATE software (Strupp, 1996). Analysis was performed on conservative ROIs avoiding the brain-skull interface, which were carefully drawn based on CBF maps with reference to ADC maps and anatomical images to verify alignment. Statistical analysis was performed with the Student's paired t-test or repeated measure analysis of variance. A P value < 0.05 was considered to be statistically significant. Data are reported as mean ± SD, and error bars on graphs are standard errors of the means (SEM).
RESULTS
Blood gases, typically measured once during surgery and then 1 and 3 hours after occlusion, were not statistically different from each other and were grouped together. All blood gases (pH = 7.36 ± 0.02, P
Establishing and validating the ADC and CBF thresholds
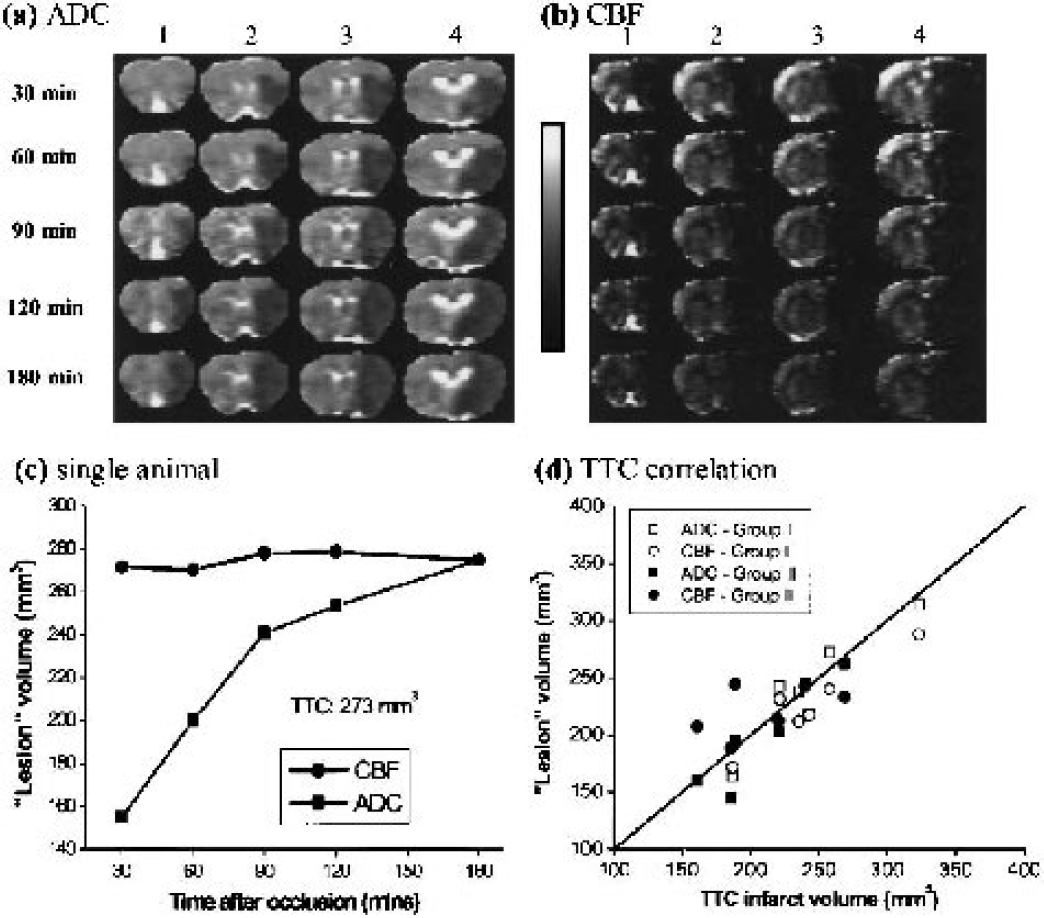
The ADC and CBF thresholds were derived by setting the ADC-derived and CBF-derived LV at 3 hours after ischemia equal to the TTC-infarct volume at 24 hours (group I). The group-average (n = 5) TTC-infarct volume was 200 ± 30 mm3, normal CBF was 0.7 ± 0.3 mL · g−1 · min−1, CBF threshold was 0.30 ± 0.09 (57 ± 11% reduction), normal ADC was 0.76 ± 0.03 × 10⁻³ mm2/s, and ADC threshold was 0.53 ± 0.03 × 10⁻³ mm2/s (30% ± 2% reduction). Figures 1a and 1b show representative ADC and CBF maps as ischemia progressed from one animal. Hypointensity in the ADC and CBF maps indicates reduction in ADC and CBF values. Figure 1c shows the evolution of CBF and ADC lesion volumes from the same animal derived using the group-average viability thresholds. The CBF-defined LV was relatively constant across time. The ADC-defined LV started out small and grew with time. A significant perfusion-diffusion mismatch during the early acute phase was observed; as ischemia progressed, the ADC LV increased until it converged with the CBF LV at 3 hours.
Representative (
These ADC and CBF thresholds were independently tested for reliability on a separate group of animals (group II, n = 6) using only the ADC and CBF thresholds derived from group I. The group-average thresholds were also applied to group I. A repeated-measure analysis of variance of the temporal progression of MRI-derived LV curves showed no statistical differences between groups I and II (P > 0.05); therefore, all subsequent analysis was applied to all 11 animals. There was a significant perfusion-diffusion mismatch between the CBF-derived and ADC-derived LVs during the acute phase. At 30, 60, 90, and 120 minutes, the ADC-derived LVs were 68% ± 10%, 81% ± 9%, 87% ± 10% and 90% ± 7% of the CBF-derived LVs, respectively (P < 0.05 up to 2 hours, n = 11). ADC-derived (230 ± 50 mm3) and CBF-defined (230 ± 40 mm3) LV at 3 hours was not statistically significant from the TTC infarct volumes at 24 hours (220 ± 40 mm3) (P > 0.05, n = 11). Excellent correlation and one-to-one correspondence analysis between the MRI-derived LV at 3 hours and TTC infarct volume at 24 hours further validated the ADC and CBF thresholds (Fig. 1d).
Pixel-by-pixel analysis of ischemic progression
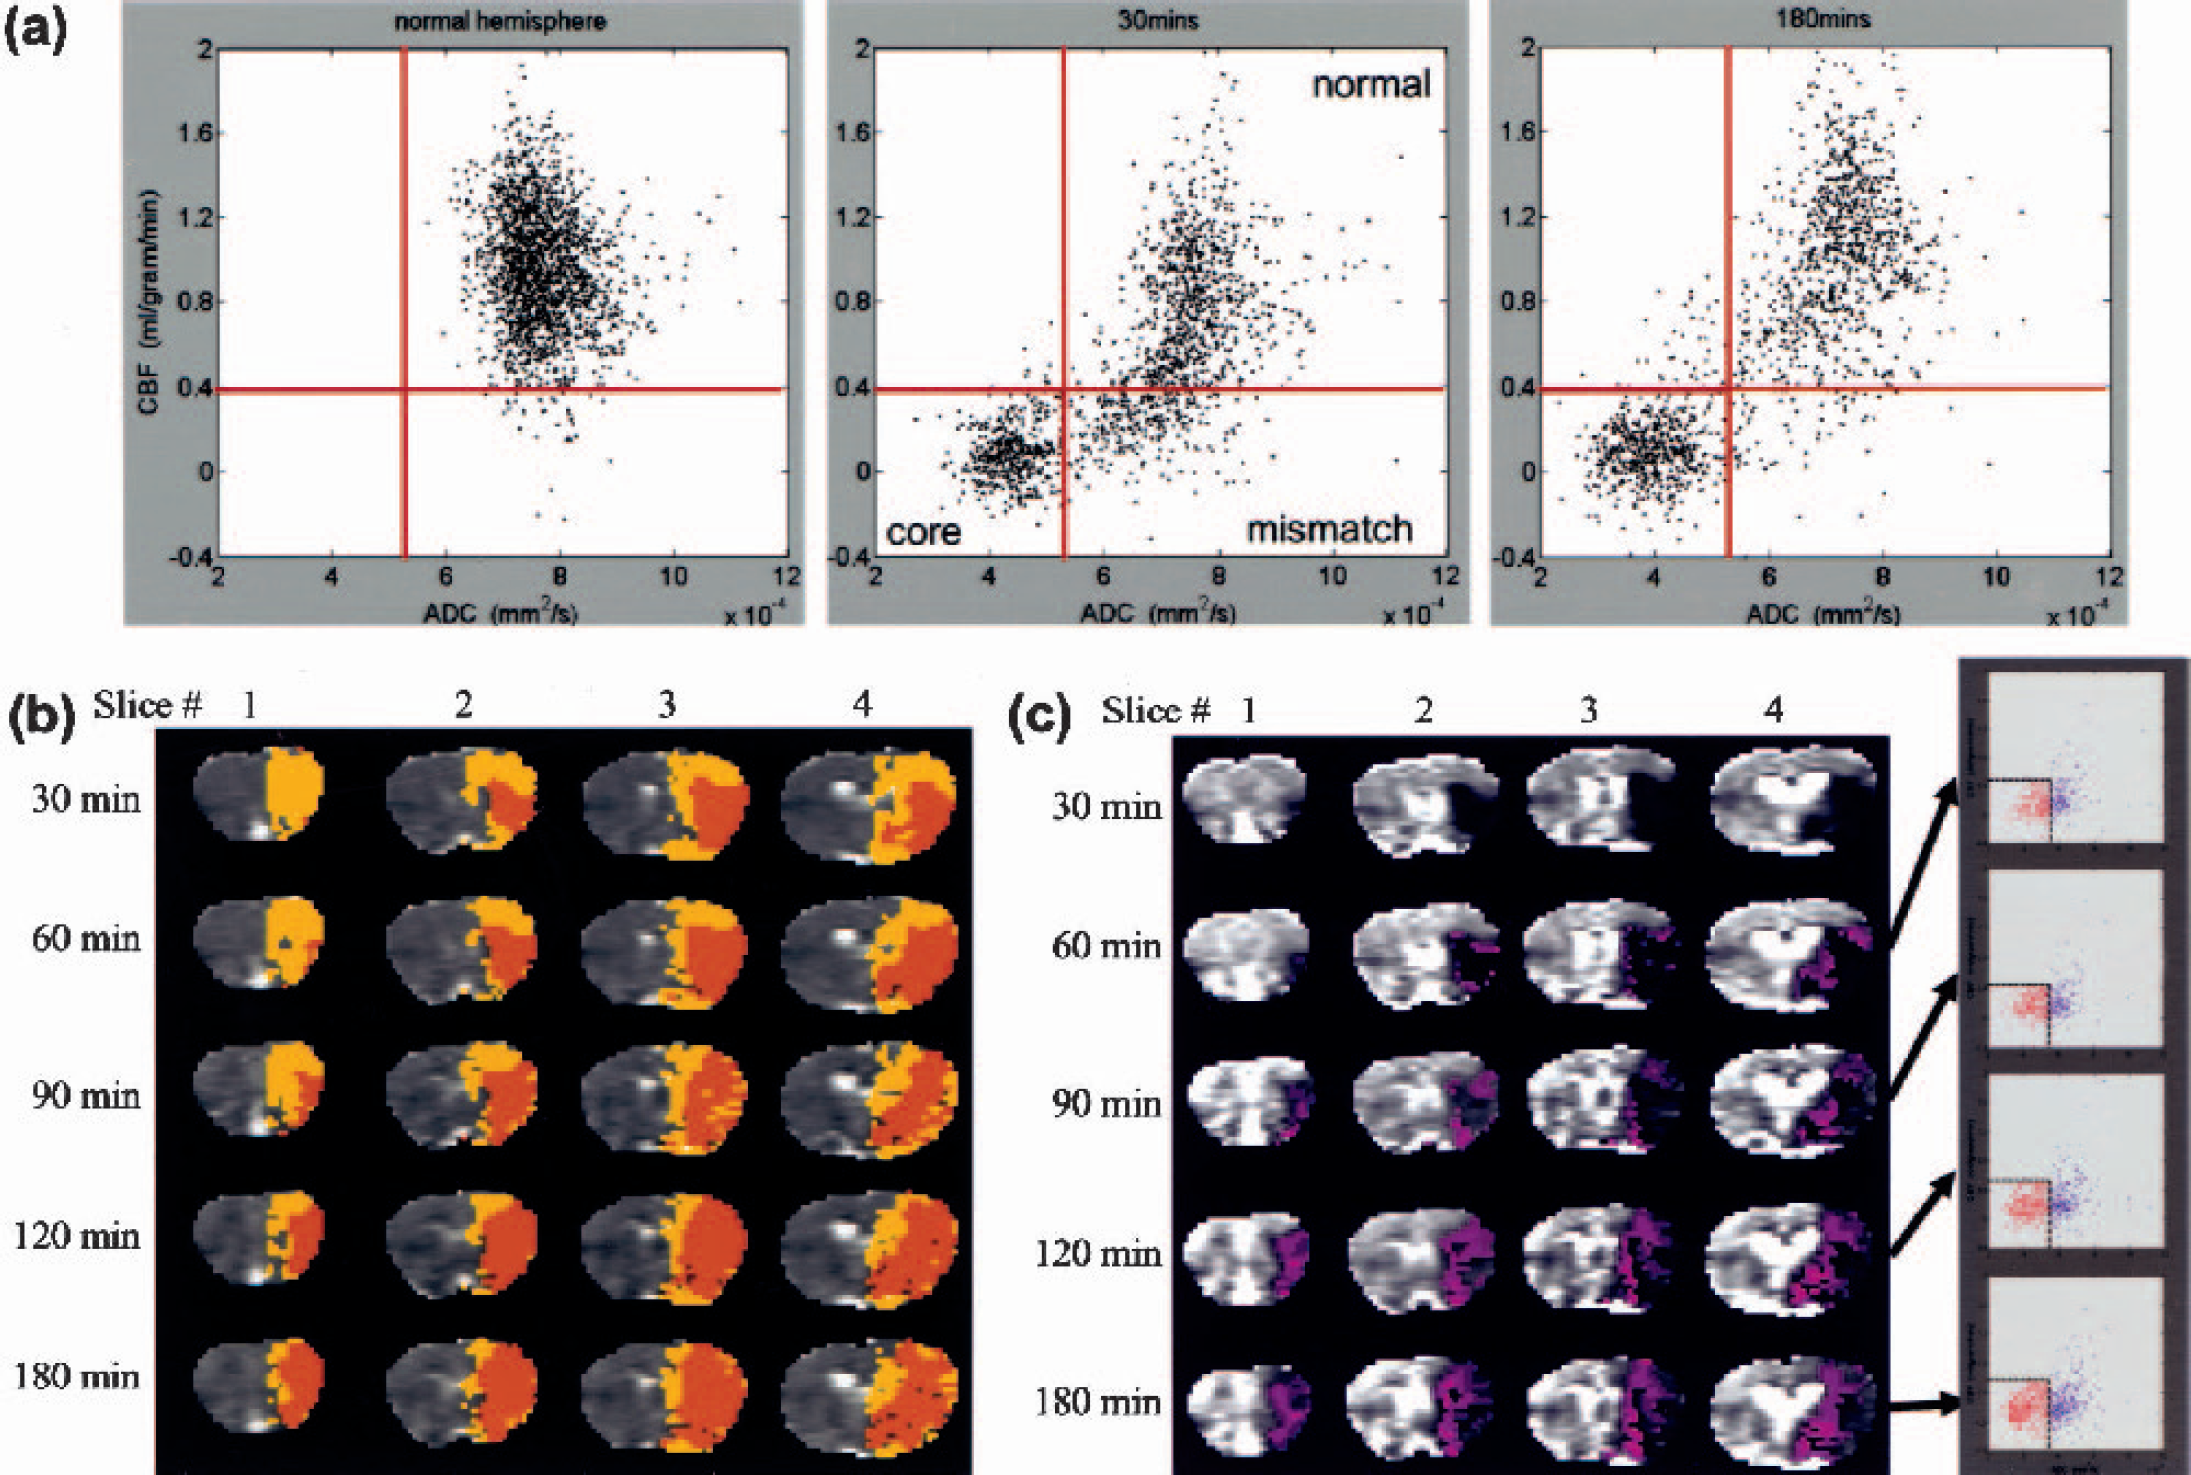
To further investigate the spatial dynamics of ischemia progression, pixel-by-pixel analysis was performed. Figure 2a shows the quantitative CBF-ADC scatterplots from one animal. The ADC-CBF distributions of the left hemisphere (LH) were markedly different from those of the right hemisphere (RH) at 30 and 180 minutes. In contrast to the single cluster in the normal LH, multiple clusters were observed in the ischemic RH and four zones were operationally defined based on the TTC-derived ADC and CBF thresholds. The three biologically relevant zones were: (1) the normal cluster with normal CBF and ADC; (2) the core cluster with marked reduced CBF and ADC; and (3) the “mismatch” cluster with reduced CBF but slightly reduced ADC. Essentially no pixels fell in zone 4 (reduced ADC but normal CBF) for this animal. The “mismatch” pixels were substantial at early time points and the majority of them migrated to the “core” zone by 180 minutes.
(
Pixels from the three zones were color-coded and mapped onto the image space (Fig. 2b). At 30 minutes after ischemia, the mismatch pixels (yellow) were substantial. As time evolved, the mismatch area decreased and, at 180 minutes, the majority (∼80%) of the mismatch pixels had migrated into the core (orange); the remaining ∼20% presumably arose from viable tissues with normal ADC but mild and sustained CBF reduction. The normal zone, on the other hand, was relatively time invariant. The “ischemic core” pixels (orange) grew as ischemia progressed and essentially all came from the mismatch zone. The detailed history of the core pixels at various time points is shown in Fig. 2c. In the ADC-CBF space, pixels that eventually became infarcted predominantly (90%) came from the mismatch zone, whereas only 10% of the pixels came from the normal zone. In the image spaces, ischemia developed predominantly medial and peripheral to the initial ischemic core.
Group-average results are shown in Fig. 3 (n = 11). The ADC and CBF of the LH were individually normalized to a zero mean for each animal. The ADC and CBF of the RH were computed relative to the LH at each time point. It should be noted that these group-average scatterplots contained variations of different tissue types and across subjects. Consistent with the single animal, the three biologically relevant zones in the RH were identified as follows: (1) the normal cluster with normal CBF (0.8 ± 0.3 mL · g−1 · min−1) and ADC (0.75 ± 0.08 × 10⁻³ mm2/s); (2) the core cluster with markedly reduced CBF (0.1 ±0.1 mL · g−1 · min−1) and ADC (0.43 ± 0.06 × 10⁻³ mm2/s); and (3) the mismatch cluster with reduced CBF (0.18 ± 0.10 mL · g−1 · min−1) but slightly reduced ADC (0.7 ± 0.1 × 10⁻³ mm2/s). The mean ADC and CBF values of various clusters were not statistically different across time. Unlike the single animal data, some (20% of mismatch volume at 30 minutes) pixels remained in the mismatch zone at 180 minutes and there were some (17% of the core pixels) pixels in zone 4. The remaining mismatch pixels at 180 minutes arose from viable tissues with normal ADC but sustained (mild) CBF reduction, and/or from intersubject variations associated with the fixed thresholds. The former was visually confirmed by the ADC and CBF maps still showing a small persistent mismatch at 3 hours in some animals (data not shown). Pixels in zone 4 arose from intersubject variations associated with the use of fixed thresholds. Most of these pixels were identified as the ischemic core after overlaying them on the image spaces; zone 4 pixels were classified and plotted as “core.”
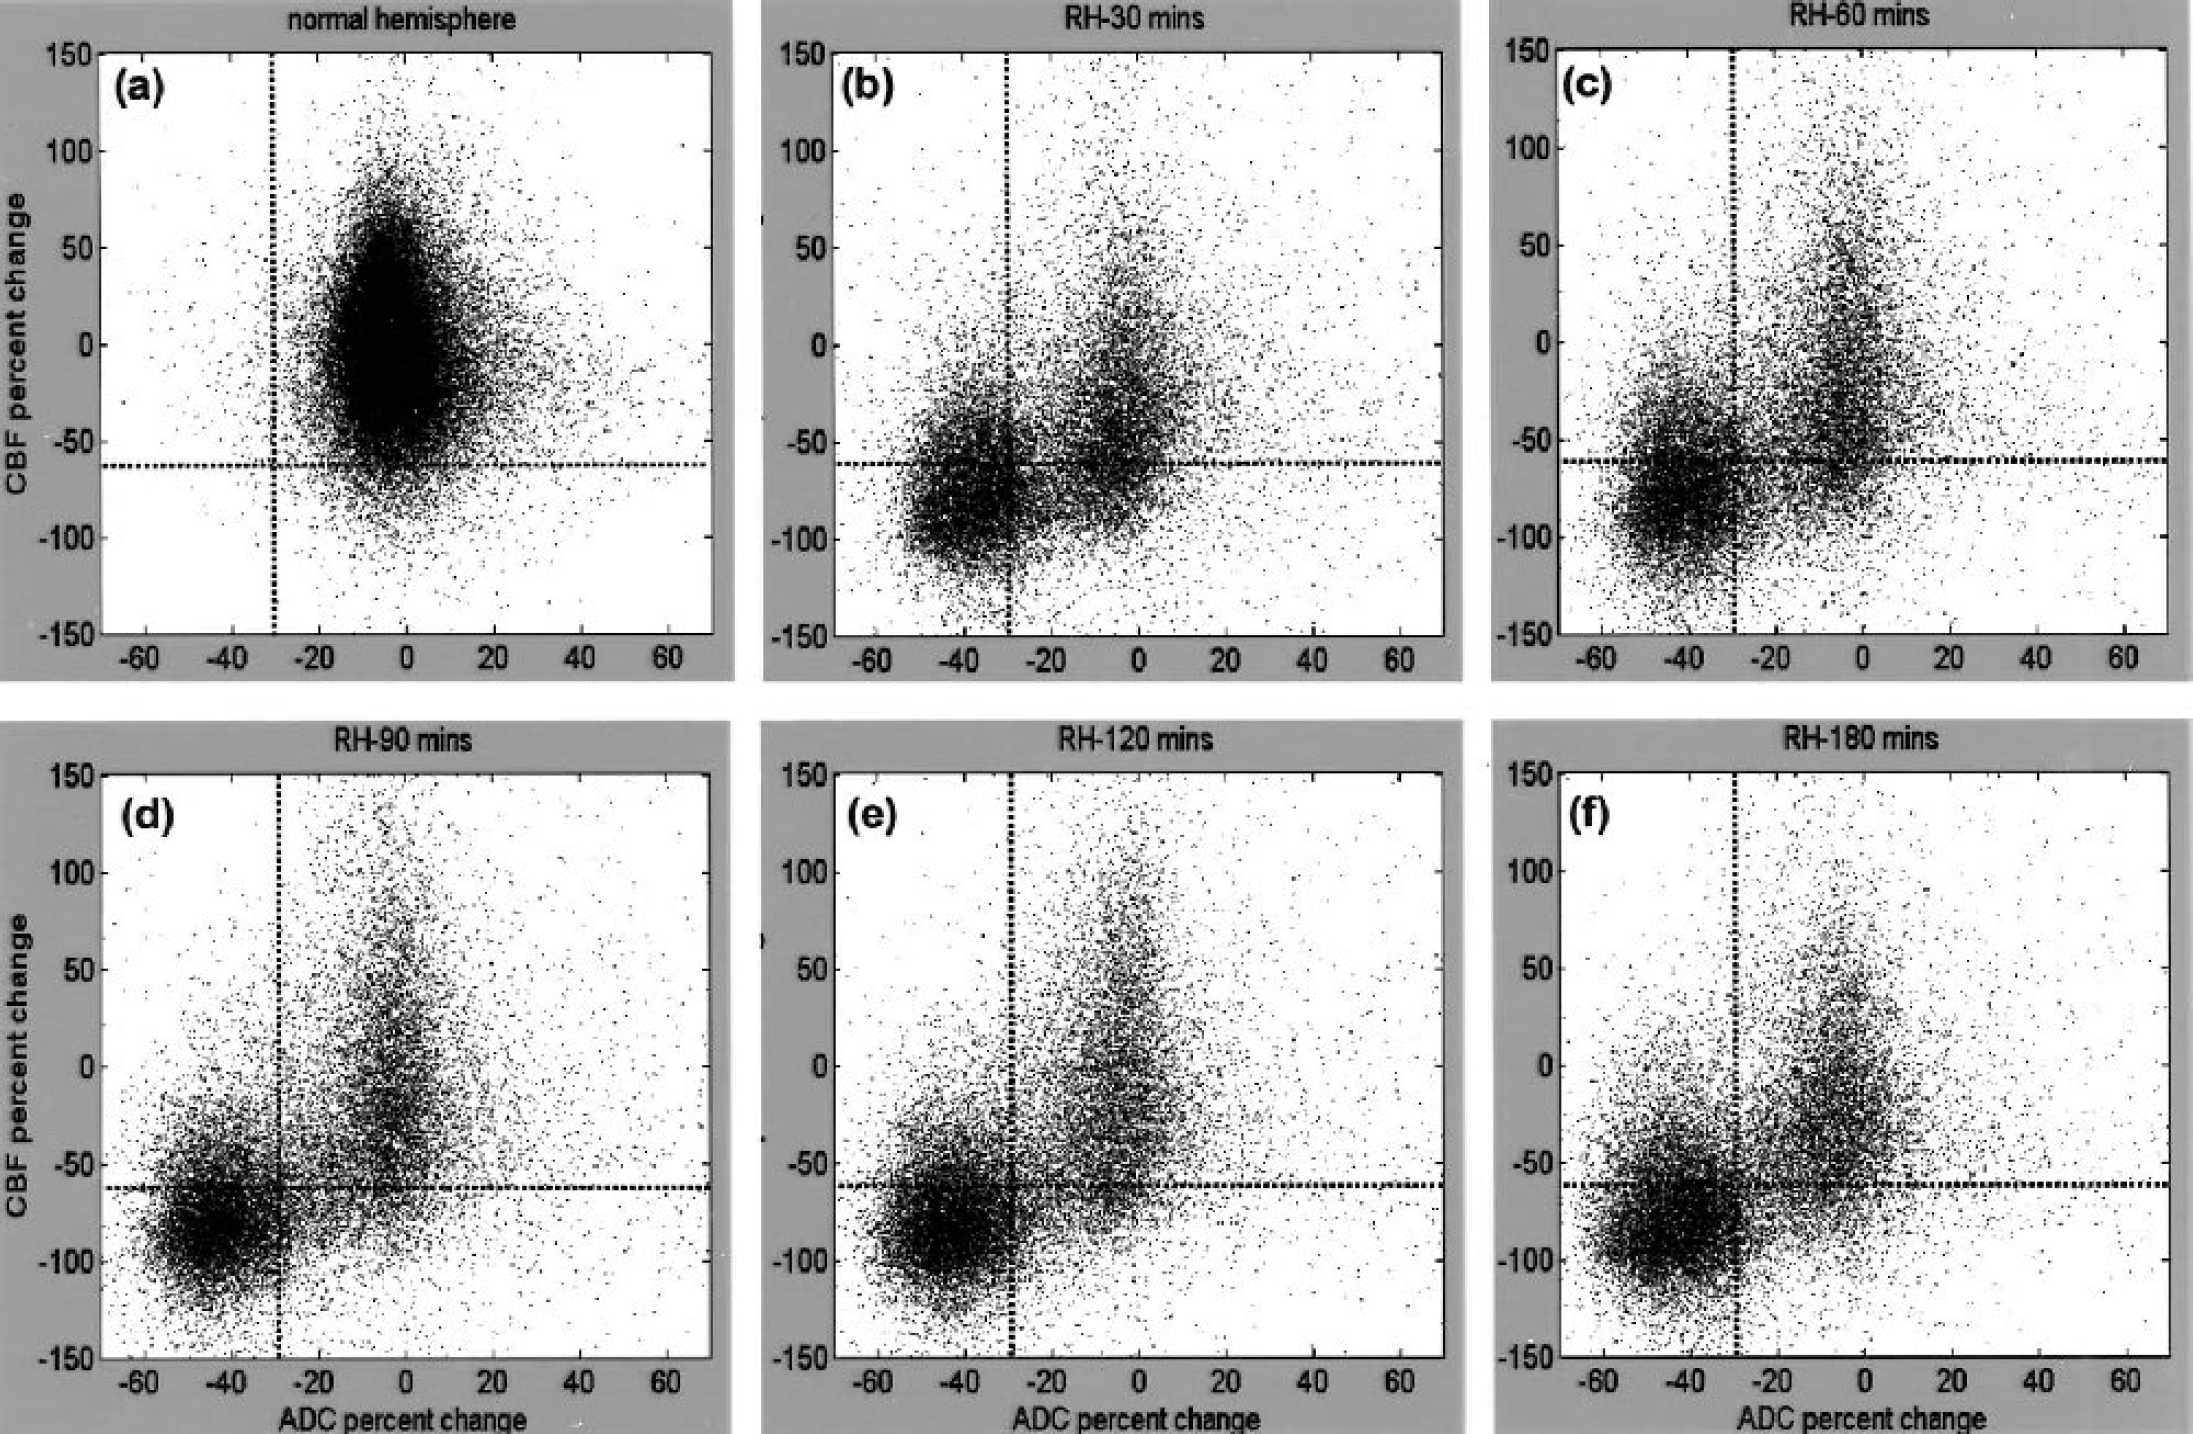
Normalized pixel-by-pixel ADC-CBF scatterplots from all animals (n = 11). Scatterplots were obtained from (
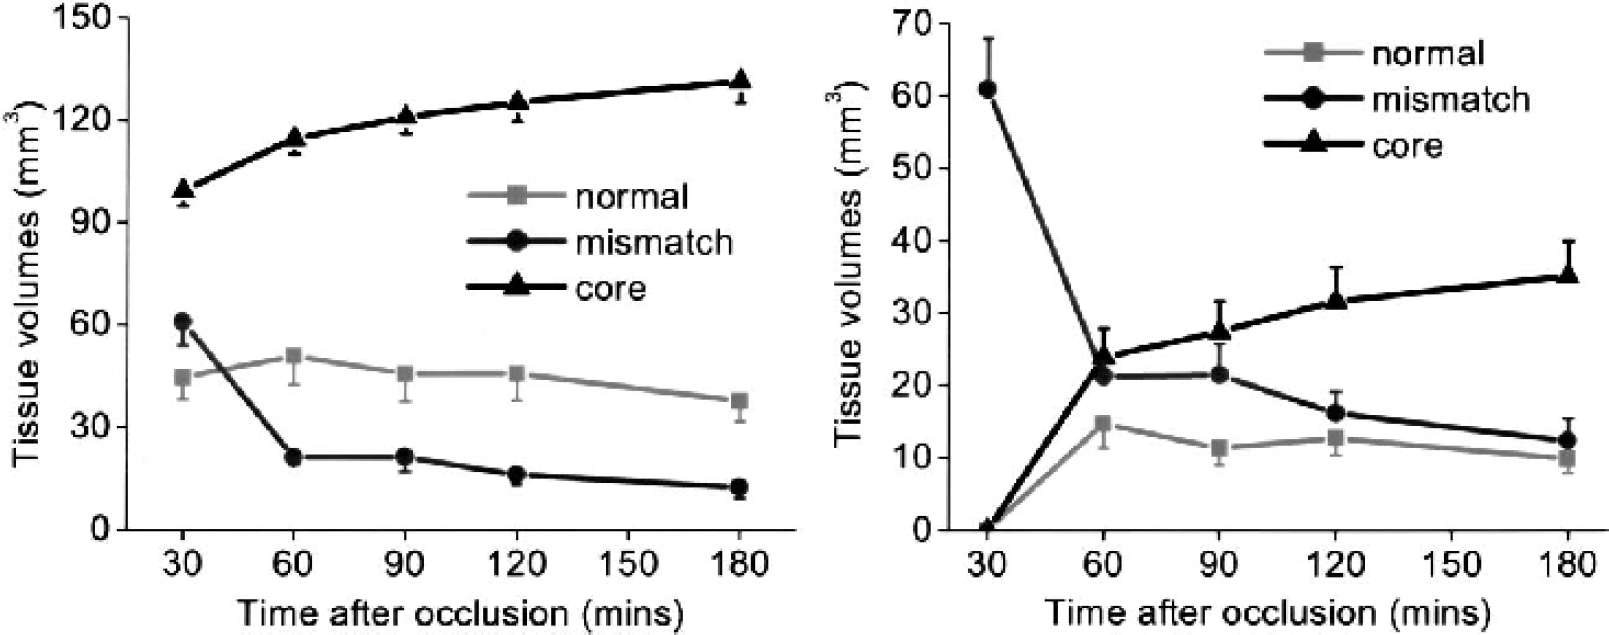
Figure 4a shows the volume evolutions of the three clusters. As expected, the core volume increased as ischemia progressed and, at 180 minutes after ischemia, it reached 133% of the volume at 30 minutes. The mismatch volume, however, consistently decreased as ischemia progressed and, at 180 minutes after ischemia, it was 23% of the volume at 30 minutes. The normal volume decreased slightly as ischemia progressed and, at 180 minutes after ischemia, was 85% of the volume at 30 minutes.
(
Volume evolutions of the mismatch pixels at 30 minutes, as they evolved into different zones, are shown in Fig. 4b. By definition, the number of mismatch pixels at 30 minutes was maximum. As ischemia evolved, the mismatch volume decreased and, at 180 minutes after ischemia, the majority (80%) of the initial mismatch pixels migrated to the core.
Projection-profile analysis
Projection profiles of the ADC and CBF distributions were analyzed. In contrast to the LH, the RH ADC distribution was bimodal with a distinct separation (a minimum); such minima did not substantially change with time (Fig. 5a). The ADC biomodal minimum (ADCbimodal) was −24% reduction (0.57 ± 0.02 × 10⁻³ mm2/s), and the corresponding CBF value (CBFbimodal) −56% reduction (0.35 ± 0.04 mL · g−1 · min−1), were surpringly similar to the TTC-derived ADC (30% reduction, 0.53 ± 0.02 × 10⁻³ mm2/s) and CBF (—57% reduction, 0.30 ± 0.09 mL · g−1 · min−1) thresholds, respectively. The small differences were likely due to errors in cross-modality comparison between histology and magnetic resonance data. The mean left-mode RH ADC (0.47 ± 0.07 × 10⁻³ mm2/s) was markedly lower than the LH ADC and shifted to a lower ADC as ischemia progressed, whereas the mean right-mode RH ADC (0.71 ± 0.07 × 10⁻³ mm2/s) was similar to the LH ADC and did not shift with time. The left-mode ADC volume increased and the right-mode ADC volume decreased as ischemia progressed. For the CBF distributions, the RH CBF was markedly lower than the LH CBF as expected. Unlike the RH ADC profiles, the RH CBF profiles were unimodal, so different clusters could not be readily resolved based on CBF differences alone (Fig. 5b).
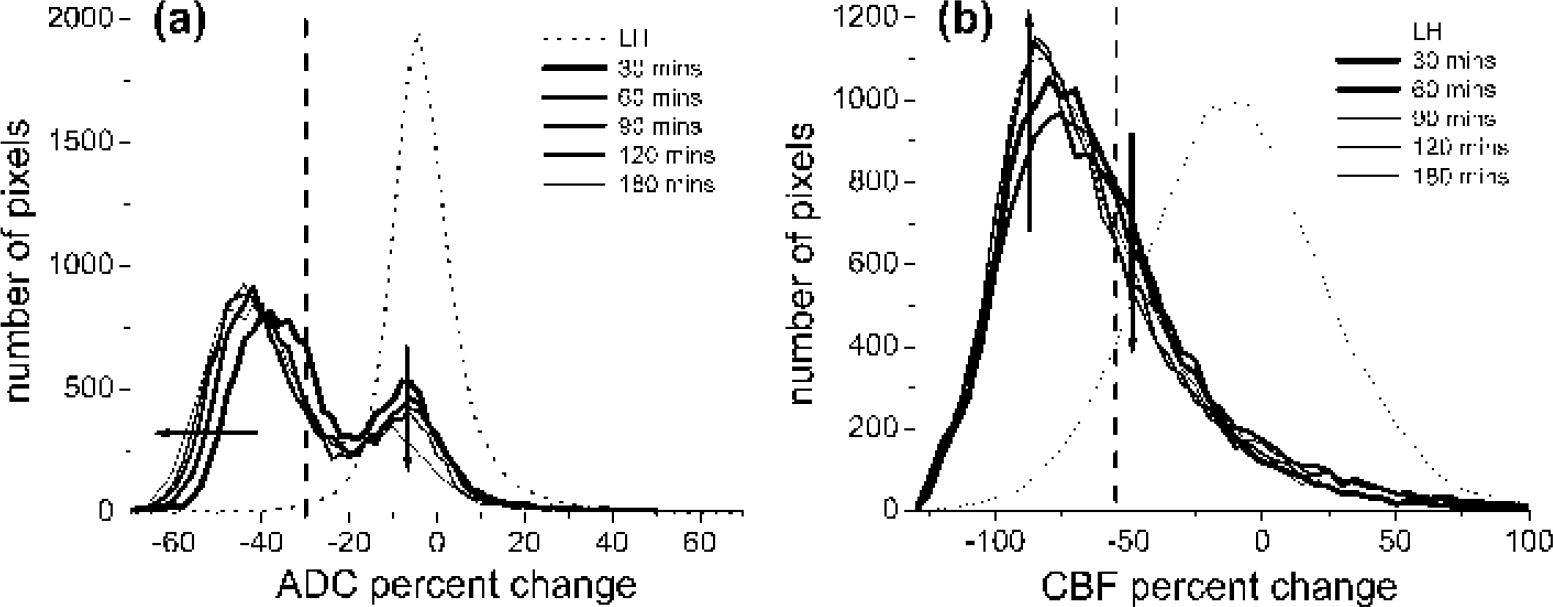
Profiles of (
DISCUSSION
The major results of this study can be summarized as follows. (1) With the use of quantitative perfusion and diffusion imaging, CBF and ADC viability thresholds in the permanent MCAO model in rats were established and independently tested for reliability. (2) Analysis of ischemia progression using these viability thresholds demonstrated that tissues at risk for infarction could be identified. (3) Pixel-by-pixel analysis of the ADC and CBF tissue characteristics yielded three biologically relevant “clusters.” Tissue volumes, means, and standard deviations of the ADC and CBF distributions of each cluster could be quantified. Pixels of different clusters could be mapped onto the image and ADC-CBF spaces, thereby making it possible to evaluate the spatiotemporal ischemic progression on a pixel-by-pixel basis without prescribing ROIs. (4) Projection profiles showed bimodal ADC, but unimodal CBF, distributions. The ADCbimodal and the corresponding CBFbimodal were relatively time independent, similar to the TTC-derived thresholds. The ADCbimodal and the corresponding CBFbimodal could potentially be used to resolve different tissue clusters without histologic correlation.
Most of the analyses of stroke data were performed using the volumetric approach and involved the use of ROI analysis. Although ROI analysis is helpful in simplifying a complex analysis problem, these ROIs contain tissues with different ADC and CBF characteristics, thereby inadvertently mixing the characteristics that one is trying to resolve and oversimplifying the complex task of characterizing tissue viability. The complex temporal and spatial evolution of focal cerebral ischemia had prompted the use of various combinations of MRI parameters and more sophisticated analysis methods (Bezdek et al., 1993; Carano et al., 1998, 2000; Jacobs et al., 2000, 2001a,b; Jiang et al., 1997; Mitsias et al., 2002; Welch et al., 1995; Wu et al., 2001) for performing multiparametric segmentation on a pixel-by-pixel basis to predict stroke outcome. Jacobs et al. (2001a) used the ISODATA technique to analyze T1, T2, and DWI data in acute and chronic human stroke. Mitsias et al. (2002) extended this analysis to correlate the T1, T2, and DWI ISODATA results with PWI-delineated lesion volume in humans. Wu et al. (2001) used generalized linear model algorithms to analyze DWI and PWI data to predict tissue outcome in human stroke patients imaged within 12 hours of symptom onset. ISODATA analysis of T1, T2 and DWI had also been applied to animal stroke models (Jacobs et al., 2001b). Similarly, a multispectral K-mean/Fuzzy c-mean clustering approach with a priori assignment of the number of clusters in the data set has also been applied to investigate the ischemic penumbra using T2-weighted images, PWI, and DWI in a rat stroke model (Carano et al., 1998, 2000). In contrast to most previous studies in animal stroke models that used “qualitative” PWI and DWI, our study focused on quantitative perfusion and diffusion imaging of the acute phase (< 4 hours) where proton density (given by Mo), T1, and T2 relaxation times are generally unaffected but tissue perfusion and diffusion are dynamically evolving (Helpern, 1993; Knight et al., 1994). Our analysis, however, did not use the automated multiparametric segmentation approach because it was difficult to visually identify three biologically relevant clusters on the CBF-ADC scatterplots in the acute phase without a priori information. Therefore, as the first step, simple TTC thresholds was used to derive the three biologically relevant clusters. The disadvantage of this approach is that it is subjected to error of cross-modality comparison and these thresholds may or may not be valid across different stroke models. Despite some inherent drawbacks, the similarity between TTC-derived thresholds and the ADC bimodal minimum as well as the consistency of the spatiotemporal dynamics of the various clusters with expectation suggests that this approach yielded reasonably accurate information regarding tissue fates. The use of fixed viability CBF and ADC thresholds to delineate ischemic lesions across different time points had been suggested previously. Olah et al. (2001) established a ADC threshold by correlating the ADC-derived lesion volumes with lesion volumes defined by metabolic energy failure (ATP depletion stained by postmortem bioluminescent technique), and reported that an ADC-reduction threshold of 23% was a good estimate at all time points during the MCAO period as well as the early phase of reperfusion. Similarly, Hoehn-Berlage et al. (1995) established a minimum CBF threshold (0.15 to 0.20 mL · g−1 · min−1) by correlating CBF autoradiography with ATP depletion. Although our CBF and ADC thresholds are slightly higher than that reported previously, they are in principle applicable at all MCAO time points and during subsequent recirculation. The CBF threshold was further justified by the finding that the derived CBF lesion volume in the permanent occlusion group remained stable over the 3-hour imaging period (Meng et al., 2003), and by the natural separation in the ADC profile (ADCbimodal) which was consistent with the histology-derived thresholds. These observations together support the premise of using fixed TTC-derived thresholds to approximate different clusters of tissue fate. It should be noted that four clusters in our data set derived out of using two thresholds. More clusters may be present in our data if different number of thresholds were used (i.e., it is conceivable that another threshold exists for the oligemic zone). Multiple clusters (more than two) in stroke data have been suggested using ISODATA analysis where the cluster numbers were statistically determined (Nagesh et al., 1998).
Critical CBF values
Despite the limitations of various imaging methods and the imprecise definition of penumbra, the validity of the penumbra concept has been proven in several studies in which different treatments have been shown to reverse some ischemic tissues (Albers, 1999; Kidwell et al., 2000; NINDS, 1995). It has been postulated that there is a critical CBF threshold(s) below which tissues are destined to become infarcted. Critical CBF thresholds have been examined by correlation with DWI contrast, TTC staining, ATP metabolism, and other measurements (Busza et al., 1992; Hoehn-Berlage et al., 1995; Kohno et al., 1995; Machadom et al., 1995; Miyabe et al., 1996; Perez-Trepichio et al., 1995; Roussel et al., 1995). In a study in which blood flow of the carotid arteries in gerbils was gradually decreased, Busza et al. (1992), used hydrogen clearance technique, and found a critical CBF value of 0.15 to 0.20 mL · g−1 · min−1 below which DWI contrast was observed. Hoehn-Berlage et al. (1995), used CBF autoradiography, and reported a critical CBF threshold of 0.18 ± 0.10 mL · g−1 · min−1 that corresponded to energy failure at 2 hours after ischemia in rats; the corresponding ADC was 77% ± 3% of normal. The CBF threshold that approximated lactate acidosis was shown to be 0.31 ± 0.11 mL · g−1 · min−1 where ADC was 90% ± 4% of normal at 2 hours after ischemia in rats (Kohno et al., 1995). In this study, the CBF threshold of 0.30 ± 0.09 mL · g−1 · min−1 and ADC threshold of 0.53 ± 0.03 × 10⁻³ mm2/s best approximated the tissues that are destined to infract in the permanent MCAO in rats. Although our data are in general agreement with the above-mentioned studies, these comparisons suggest that different critical thresholds exist for different biologic events after ischemia and that these thresholds are dependent on animal models, anesthetics used, duration, and/or severity of ischemic injury, and the accuracy of cross-modality comparision. Although the wide CBF distribution arose largely from intrinsic tissue CBF heterogeniety, improved CBF accuracy could better define the CBF viability thresholds.
Hossmann (1995) has critically reviewed a series of biologic events at different critical CBF thresholds after ischemic injury. We interpreted our ADC and CBF values from different clusters in references to these biological events. The CBF of the ischemic core (0.1 ± 0.1 mL · g−1 · min−1, this study) is consistent with the CBF values that lead to anoxic membrane depolarization and loss of cell-volume homeostatis; the corresponding ADC was 0.43 ± 0.06 × 10⁻³ mm2/s. The CBF of the mismatch cluster (0.18 ± 0.10 mL · g−1 · min−1, this study) is significantly above that of the ischemic core but corresponds to the onset of energy failure and loss of evoked potential activity; the corresponding ADC was 0.7 ± 0.1 × 10⁻³ mm2/s. Our TTC-derived CBF threshold (0.30 ± 0.09 mL · g−1 · min−1) and the CBF associated with the ADC bimodal minimum (0.35 ± 0.04 mL · g−1 · min−1) are most consistent with the onset of reduced glucose metabolism and lactate acidosis but before energy failure; the corresponding ADC values were 0.57 ± 0.02 × 10⁻³ mm2/s and 0.53 ± 0.03 × 10⁻³ mm2/s, respectively.
ADC bimodal minimum
The ADCbimodal and CBFbimodal were relatively time independent and surpringly similar to the TTC-derived thresholds. Further, preliminary analysis of the 60-minute transient occlusion data also showed similar ADC bimodal minimum before and after reperfusion These observations could have important implications. One major implication is that an ADC bimodal separation exists (instead of a continuous distribution), suggesting that there is a critical (distinct) ADC value below which there are definitive changes in the tissue biophysical properties, likely to correlate with a major cellular event(s) in the cascades of ischemic injury. Both the CBFbimodal and the TTC-derived threshold were similar to the CBF threshold for lactate acidosis and reduced glucose metabolism (0.31 ± 0.11 mL · g−1 · min−1) (Kohno et al., 1995) but significantly higher than the CBF threshold (0.18 ± 0.10 mL · g−1 · min−1) for energy failure and loss of cell-volume homeostasis (Hoehn-Berlage et al., 1995). However, the precise connection of these biological events to the biophysical mechanism(s) underlying ischemia-induced ADC reduction is unclear.
Another implication of the bimodal ADC minimum is that it can be used to guide the CBF analysis. In marked contrast to the ADC distribution, the RH CBF distribution was continuous, and different clusters could not be resolved. By using the ADC bimodal minimum as a threshold, CBF values of the mismatch, normal, and core clusters were resolved.
Finally, another implication is that the ADCbimodal and CBFbimodal were surpringly similar to the TTC-derived thresholds, which were determined independently. Our working hypothesis is that the ADC and CBF of the ADC bimodal minimum and the TTC-derived viability thresholds are the same. Future studies will focus on testing this hypothesis. If it were true, the ADC-bimodal minimum could be used to approximate the “viability threshold” without the need for histologic correlation and, as such, it could have potential clinical applications.
CONCLUSION
Quantitative, instead of qualitative, perfusion and diffusion viability thresholds in a permanent MCAO model in rats were established and independently tested for reliability. Analysis of the ischemic progression showed a reproducible perfusion-diffusion mismatch and suggested the presence of a two-hour therapeutic window. Pixel-by-pixel analysis of CBF-ADC scatterplots offered a simple means to track the spatiotemporal progression of ischemic tissue fates. Such analysis yielded unique additional information that is not evident in analyzing DWI and PWI in the spatial domain. The approach demonstrated herein could be useful for monitoring the dynamic changes in cluster membership as a function of therapeutic intervention (e.g., reperfusion, or drug treatment), where such information may be more useful in predicting tissue outcome. The ADC bimodal minimum, derived without histological correlation, approximated the viability thresholds and, therefore, could have potential clinical applications.
Footnotes
Acknowledgments:
The authors thank Drs. Craig Ferris and Jean King for continuing support and Erica Hennig for helpful discussions. This work was performed using the support from a Biomedical Engineering Grant from the Whitaker Foundation.