
Abstract
Multimodal magnetic resonance imaging of acute stroke provides predictive value that can be used to guide stroke therapy. A flexible artificial neural network (ANN) algorithm was developed and applied to predict ischemic tissue fate on three stroke groups: 30-, 60-minute, and permanent middle cerebral artery occlusion in rats. Cerebral blood flow (CBF), apparent diffusion coefficient (ADC), and spin–spin relaxation time constant (T2) were acquired during the acute phase up to 3 hours and again at 24 hours followed by histology. Infarct was predicted on a pixel-by-pixel basis using only acute (30-minute) stroke data. In addition, neighboring pixel information and infarction incidence were also incorporated into the ANN model to improve prediction accuracy. Receiver-operating characteristic analysis was used to quantify prediction accuracy. The major findings were the following: (1) CBF alone poorly predicted the final infarct across three experimental groups; (2) ADC alone adequately predicted the infarct; (3) CBF+ADC improved the prediction accuracy; (4) inclusion of neighboring pixel information and infarction incidence further improved the prediction accuracy; and (5) prediction was more accurate for permanent occlusion, followed by 60- and 30-minute occlusion. The ANN predictive model could thus provide a flexible and objective framework for clinicians to evaluate stroke treatment options on an individual patient basis.
Introduction
Multimodal magnetic resonance imaging (MRI) of acute stroke provides clinically relevant data and predictive value to guide stroke therapy. Combined perfusion- and diffusion-weighted MRI is remarkably sensitive in detecting acute stroke changes and is becoming the method of choice for diagnosis, staging, and characterization of ischemic brain injury. The anatomical mismatch between perfusion and diffusion abnormality (Kidwell et al, 2003; Warach, 2003) approximates the potentially salvageable ‘ischemic penumbra’ (Astrup et al, 1981a, b ; Hossmann, 1994; Lo et al, 2005). Although the definition of perfusion–diffusion mismatch has evolved slightly over the years (Kidwell et al, 2003), it remains widely used to guide acute stroke treatment in emergency rooms. In contrast, conventional T2-weighted MRI could not detect ischemic injury until at least 6 hours after stroke onset, coinciding with vasogenic edema, at which point the tissue is likely already infarcted.
Prediction of infarct volume on a pixel-by-pixel basis has been demonstrated using critical thresholds of the apparent diffusion coefficient (ADC) or cerebral blood flow (CBF) values (Arenillas et al, 2002; Thomalla et al, 2003). Although this approach is simplistic and has limitations, it is practical for evaluating treatment effects on lesion volumes. A more sophisticated prediction algorithm used a voxel-based generalized linear model (GLM) to predict tissue infarction in middle cerebral artery occlusion (MCAO) in rats (Wu et al, 2007) and human stroke patients (Wu et al, 2001). Predicted outcome was compared with the tissue's histology or end-point T2 imaging. Shen
The evolution of ischemic injury is spatially heterogeneous (Guadagno et al, 2005; Sobesky et al, 2005). Although acute ADC and CBF data are very informative in predicting outcome, other factors could also affect stroke outcome. Two of these factors are neighboring pixel information and infarction incidence. First, a single pixel or a small island of normal pixels in the hyperacute phase is often surrounded by severe ADC and CBF reduction. These islands of small pixels will likely infarct but may not be identified as such based on ADC and/or CBF alone, thus affecting prediction accuracy. Noise in the data could also give rise to single pixels or small islands of normal ADC and/or CBF, resulting in reduced prediction accuracy. Second, incidence of ischemic injury includes distance from patent afferent vessels, basal regional blood flow, and metabolism. For example, the tissue close to the anterior communicating artery and the posterior cerebral artery has lower infarction incidence because of collateral flow (Shen et al, 2004b). Conversely, the hippocampus is thought to be more susceptible (Smith et al, 1984). Information regarding infarction incidence can be derived from an incident map of the infarct frequency, and can in principle be incorporated into the predictive model to improve prediction accuracy. Incorporation of these factors, however, may not be trivial because they may not be easily parameterized.
The artificial neural network (ANN), inspired by the neuronal networks in the central nervous system, is widely used in science and engineering for prediction and classification. It consists of nodes that are connected together to form a network with variable strengths (weights) between different connections. Through training, the relationship between inputs and outputs in the ANN can be mapped by altering the weights within the network. It is particularly useful in solving problems that have few obvious rules, problems that are difficult to specify mathematically, and problems that deal with a large number of parameters. ANN has been used for clustering of contrast-enhanced perfusion MRI data (Wismuller et al, 2006) and embolus detection using MRI (Kemeny et al, 1999). Prediction of functional outcome associated with clinical variables that are associated with rehabilitation in stroke (Oczkowski and Barreca, 1997) has also been described. Comparisons of ANN and other predictive models have also been reported (Tu, 1996).
The aim of this study was to develop and test a flexible predictive algorithm based on ANN to predict ischemic tissue fate using acute ADC and CBF data. Artificial neural network prediction algorithms were evaluated on rat stroke models subjected to three different occlusion durations (30-, 60- minute, and permanent MCAO). Predictions using ADC alone, CBF alone, and ADC + CBF were evaluated. In addition, the effects of neighboring pixels and infarction incidence on prediction accuracy were also evaluated. Prediction accuracy was quantified using receiver-operating characteristic (ROC) analysis. Comparisons of prediction accuracy were made with end-point T2-weighted MRI on a pixel-by-pixel basis.
Theory
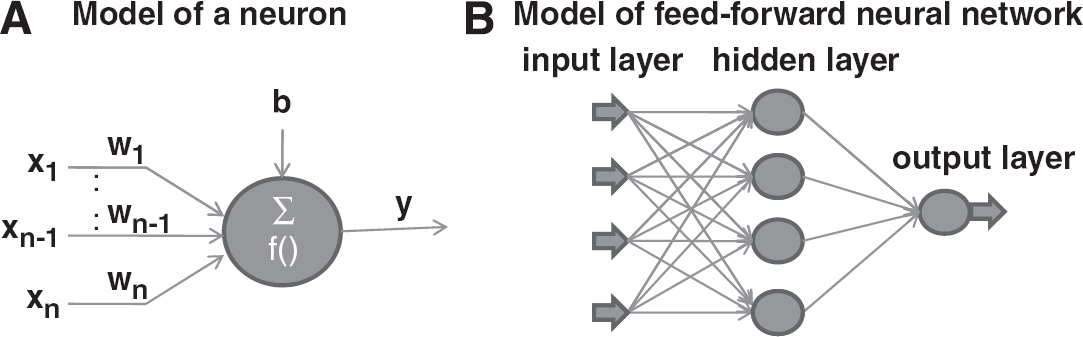
The artificial neural network consists of interconnected nodes that form a network with variable weights between connections. Figure 1A shows the model of an artificial neuron. The relationship between the input and the output of the neuron can be described as
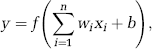
where
Neural networks are formed by connecting these neurons together. This study used the feed-forward ANN, in which artificial neuron connections are arranged in layers in the direction from inputs to outputs without feedbacks among nodes in the same layer. Figure 1B shows the feed-forward ANN model with three layers, input layer, hidden layer, and output layer, in which the weights, bias, and other network connections were omitted for clarity. A supervised training of the ANN model was used. For the propagation of error, the back-propagation algorithm was used to minimize the cost function ξ on the output layer:
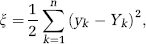
where

where
(
Instead of the commonly used gradient descent method to minimize cost function, this study used the resilient back-propagation method (Riedmiller and Braun, 1993) to speed up convergence. Resilient back propagation takes into account only the sign of the partial derivative over all patterns (not the magnitudes) and acts independently on each ‘weight’, as defined by
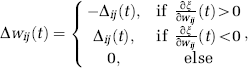
where Δ
with 0 < η− < 1 < η+, Δ0, Δmax, and Δmin being the initial, maximum, and minimum values of Δ
Materials and methods
Animal Preparations
The data used in this study were those of Shen and Duong (2008). In brief, a total of 36 Sprague–Dawley rats (300 to 350 g) were subjected to 30-minute (
Magnetic Resonance Experiments
Magnetic resonance imaging was performed on a Bruker 4.7-T/40-cm (Billerica, MA, USA) scanner. The animal was secured in a stereotaxic headset and placed onto an animal holder, consisting of a surface coil (2.3-cm inner diameter) for brain imaging and a butterfly neck coil for continuous arterial spin labeling (Meng et al, 2004). Coil-to-coil interaction was actively decoupled. Imaging was performed at 30, 60, 90, 120, and 180 minutes, and again at 24 hours after occlusion. For the 30- and 60-minute MCAO groups, the 30- and 60-minute data, respectively, were acquired before reperfusion. Reperfusion was accomplished remotely without taking the animal out of the scanner.
Quantitative CBF was measured using the continuous arterial spin-labeling technique (Duong et al, 2000) with gradient-echo echo-planar imaging (EPI), matrix = 128 × 128 (4 shots for the permanent MCAO group) or 64 × 64 (single shot for the 30- and 60-minute MCAO groups), field of view (FOV) = 2.56 cm × 2.56 cm, repetition time (TR) = 2 seconds per segment (90° flip angle), echo time (TE) = 20 milliseconds, and seven 1.5-mm slices. Paired images were acquired alternately—one with and the other without arterial spin-labeling preparation. In all, 76 pairs of images were acquired for signal averaging, with half acquired before and the other half after the ADC measurements.
The higher resolution in the permanent MCAO group was a result of our recent successful attempt to achieve better ischemic definition. Higher resolution could improve prediction by reducing the partial-volume effect, but it has lower signal-to-noise ratio (SNR) per unit time. Differences in resolution of the data here were not expected to alter the overall validity of the ANN approach.
Apparent diffusion coefficient maps were obtained by averaging three data sets acquired with diffusion-sensitive gradients applied along the
At 24 hours after occlusion, T2-weighted images were acquired using the fast spin-echo pulse sequence (echo time per echo = 6.5 milliseconds) with two different effective echo times (52 and 104 milliseconds), echo train length 16, and 16 signal averages.
Data Analysis
Five anterior slices were analyzed to avoid susceptibility distortion around the ear canals. Images were coregistered using custom-designed semiautomatic coregistration software between acute-phase and 24-hour data within the same animals and between animals as described previously (Liu et al, 2004; Schmidt et al, 2006; Shen et al, 2005a). Apparent diffusion coefficient maps with intensity in units of mm2/s (Meng et al, 2004; Shen et al, 2005a) and CBF maps with intensity in units of mL per gram per min were calculated (Duong et al, 2000) as described previously using codes written in Matlab (MathWorks, Natick, MA, USA). Image displays and overlays were performed using the STIMULATE software (University of Minnesota). All data were reported as mean ± s.e.m.
Cluster Analysis:
The iterative self-organizing data analysis algorithm (ISODATA; Ball and Hall, 1965) was used to segment and exclude pixels of the cerebrospinal fluid and the corpus callosum (Shen et al, 2004b). With the remaining gray matter in the rat brain, ISODATA was then used to identify pixels belonging to different tissue zones based on ADC and CBF data, and to determine the final lesion volume based on end-point MRI data. Multiple clusters were resolved and identified as ‘normal’, ‘mismatch,’ and ‘ischemic core’ from the ischemic right hemisphere at each acute time point (Shen et al, 2004b). The final lesion was determined using ADC and T2 maps at 24 hours after occlusion.
Spatial Infarction Incidence:
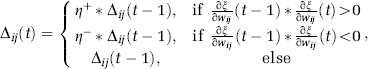
To improve prediction accuracy, spatial infarction incidence maps were obtained by counting the frequency of infarction for each MCAO group (which is known as the spatial frequency of infarct; Shen et al, 2005b). Images from different animals within the same MCAO group were spatially coregistered and the infarction incidence maps were computed pixel by pixel using,
where
Artificial Neural Network:
Artificial neural network algorithms were developed in the Matlab environment using the ANN toolbox. Three experimental groups were analyzed: permanent, 60-, and 30-minute MCAO groups. The ANN was trained and tested using the leave-one-out method—i.e., one animal was used as the ‘test’ subject and the remaining animals in the same MCAO group were used as ‘training’ subjects. This was cycled for all animals in the same group.
The number of hidden neurons and the number of training epochs were optimized for ADC alone. The number of hidden neurons was evaluated from 1, 2, 4, 6, 8, 10, 12, 14, 16, 18, and 20 (with the number of training epochs being 150). The number of training epochs was evaluated from 5, 10, 15, 20, 25, and 50, and from 100 to 500 in steps of 100 (with the number of hidden neurons being 5). The optimal number of training epochs and the number of hidden neurons were those that yielded the largest areas under the ROC curves.
Artificial neural network predictions were made for the 30-, 60-minute and permanent MCAO groups using their corresponding ANN basis sets, namely: (1) the permanent MCAO ANN basis set was trained and applied to permanent MCAO animals for prediction, (2) the 60-minute MCAO ANN basis set was trained and applied to the 60-minute MCAO animals for prediction, and (3) the 30-minute MCAO ANN basis set was trained and applied to the 30-minute MCAO animals for prediction. For each MCAO data set, training was performed for six conditions: (1) CBF alone, (2) ADC alone, (3) ADC + CBF, (4) ADC + CBF + two-dimensional (2D) adjacent pixels, (5) ADC + CBF + 3D adjacent pixels, and (6) ADC + CBF + 3D adjacent pixels + spatial information. For each MCAO data set, predictions were then made using only data obtained at 30 minutes after stroke onset for each of the six conditions. Adjacent pixels referred to 8 and 26 immediate neighbor pixels in 2D and 3D, respectively, in which they were treated as independent inputs of ANN. For example, there were 18 inputs for the ADC + CBF + 2D condition (i.e., for each ADC pixel there were eight neighbors, totaling nine inputs, and for each CBF pixels there were eight neighbors, totaling nine inputs). Spatial information referred to the infarction incidence map described above.
To further evaluate the hypothetical treatment effects, prediction was also made for the permanent, 60-, and 30-minute MCAO groups using only the permanent MCAO ANN training basis set. Predictions were made for the six conditions described above.
For ANN analysis, the initial value of all update values Dij was set as 0.01 (equation (6)). To prevent the weights from becoming too large, the maximum weight step determined by the size of the update value was limited, with the upper bound being arbitrarily set as Δmax = 50. The minimum step size was fixed at Δmin = 1e−6.
Receiver-operating characteristic analysis was performed to evaluate the prediction accuracy as described previously (Shen et al, 2005b). Sensitivity and specificity at the optimal point and the areas under the ROC curves (AUCs) were tabulated for comparison.
Comparison With a Previously Published Prediction Model
Comparison of prediction performance (AUC) by ANN was also made using a previously published probabilistic prediction model, using the identical data sets as described in Shen
Statistical Analysis
Two-way analysis of variance (ANOVA) with multiple-comparisons Tukey–Kramer's correction was used for comparison among different conditions (Figures 5 and 6). The paired
Results
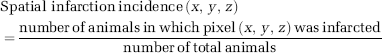
Spatial infarction incidence maps were derived (Figure 2). Spatial infarction incidence and the extent of infarction were heterogeneous. The ischemic core has a comparatively high infarction incidence as expected, whereas the mismatch region has a nonzero infarction incidence and the normal tissue has close to zero infarction incidence. The spatial infarction incidence varied significantly across the three experimental stroke groups.
Spatial infarction incidence maps for the permanent, 60-, and 30-minute middle cerebral artery occlusion (MCAO) groups. The color bar denotes the infarction incidence from 0% to 100%. The color reproduction of this figure is available on the html full text version of the manuscript.
Figure 3 shows the optimization of the number of hidden neurons and the number of training epochs for the ADC data obtained from the permanent, 60-, and 30-minute MCAO groups. The optimal AUC reached a plateau at 6 hidden neurons and 40 training epochs for all MCAO groups for ADC data alone. On the basis of these optimization results, we performed additional optimizations using 7 hidden neurons and 50 training epochs for all other conditions (ADC, CBF, ADC + CBF, ADC + CBF + 2D, ADC + CBF + 3D, and ADC + CBF + 3D + spatial information). The AUCs were not statistically different from the plateau values shown in Figure 3 for all conditions. Thus, it was sufficient in all subsequent analysis of ANN trainings with 7 hidden neurons and 50 training epochs for all conditions.
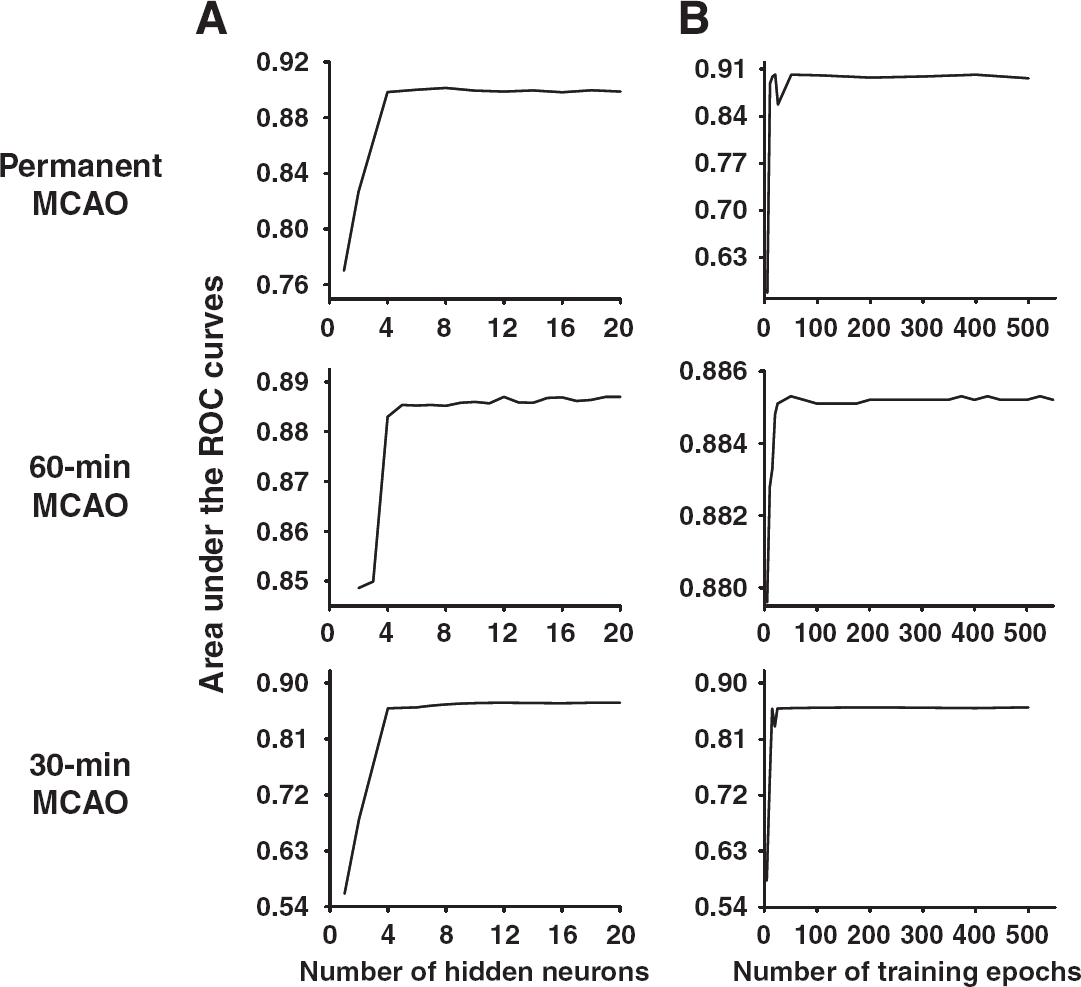
Optimization of (
Representative data sets of the pixel-by-pixel ANN predictions of subsequent infarction are shown in Figure 4 for the three experimental stroke groups under various conditions. Predictions for each MCAO group used its own basis set and MRI data obtained at 30 minutes after ischemia. The conditions evaluated were CBF alone, ADC alone, ADC + CBF, ADC + CBF + 2D, ADC + CBF + 3D, and ADC + CBF + 3D + spatial information. For references, ADC, CBF maps, and ISODATA analysis of lesion volume based on ADC and T2 are also shown. ISODATA analysis of lesion volume (shown as blue pixels) was taken as the end-point measure, which had been previously correlated with histology (Shen et al, 2005b; Shen and Duong, 2008).
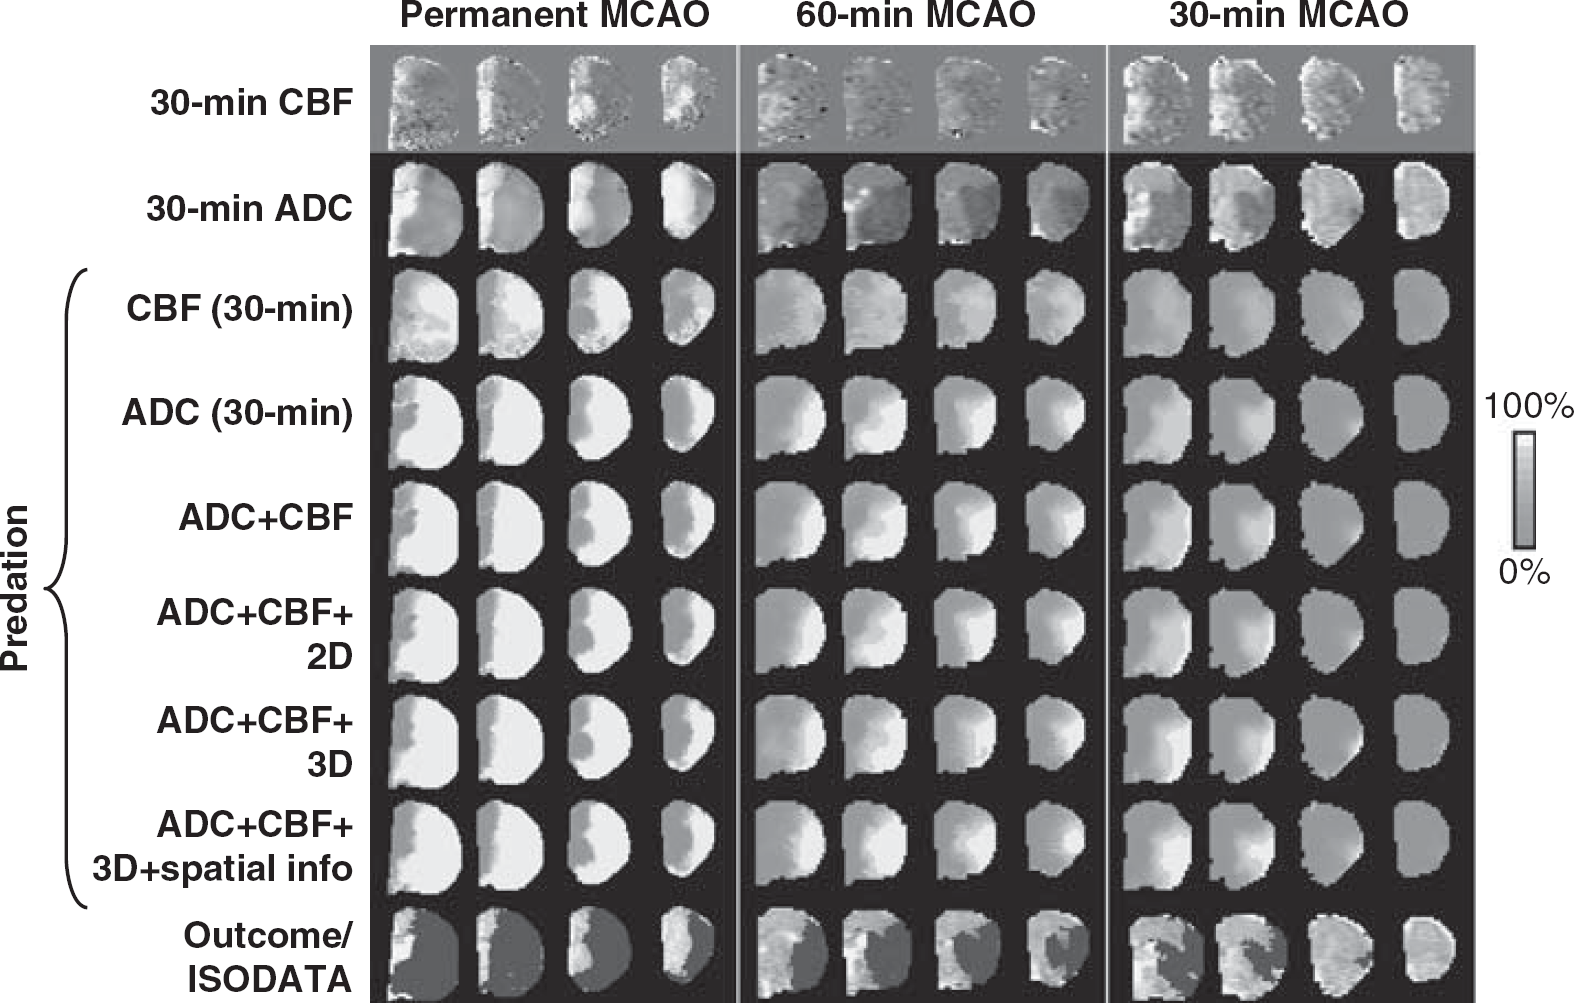
Predicted infarct maps for the permanent, and 60-, and 30-minute middle cerebral artery occlusion (MCAO) groups using their own artificial neural network (ANN) training basis sets. Multislice images are posterior to the anterior slices from left to right. Predictions were made with cerebral blood flow (CBF) alone, apparent diffusion coefficient (ADC) alone, ADC + CBF, ADC + CBF + 2D adjacent pixels, ADC + CBF + 3D adjacent pixels, and ADC + CBF + 3D adjacent pixels+spatial information. For references, ADC, CBF maps, and iterative self-organizing data analysis algorithm (ISODATA) analysis of end-point lesion volume based on ADC and T2 are also shown. Color bar denotes the probability of infarct from 0% to 100%. The color reproduction of this figure is available on the html full text version of the manuscript.
The major findings from Figure 4 are as follows. For the permanent MCAO group, the predicted infarct maps showed generally good pixel-by-pixel correspondence with ISODATA cluster analysis of the end-point MRI data, with the exception of CBF data alone, which poorly predicted the infarct. With additional information (going from top to bottom), predictions were slightly more accurate regarding lesion location and volume, as well as slightly more certain (i.e., stronger yellow pixels). For the 60- and 30-minute MCAO groups, prediction with CBF alone was inaccurate and less certain (stronger orange pixels) compared with the permanent MCAO group. With additional information (going from top to bottom), predictions were more accurate and more certain. Predicted maps are in general agreement with ISODATA analysis of lesion volume.
Quantitative analyses of group data are summarized below. Figure 5 shows the AUCs for predictions of each MCAO group using its own training basis set. The general observations were the following: (1) CBF alone at 30 minutes poorly predicted infarct across all three experimental groups; (2) ADC alone adequately predicted infarct; (3) CBF + ADC improved the prediction accuracy; (4) addition of neighboring pixel information in 2D and 3D only slightly improved prediction accuracy; (5) addition of infarction incidence further improved prediction accuracy slightly; and (6) finally, prediction was more accurate for the permanent MCAO group, followed by the 60- and 30-minute MCAO groups.
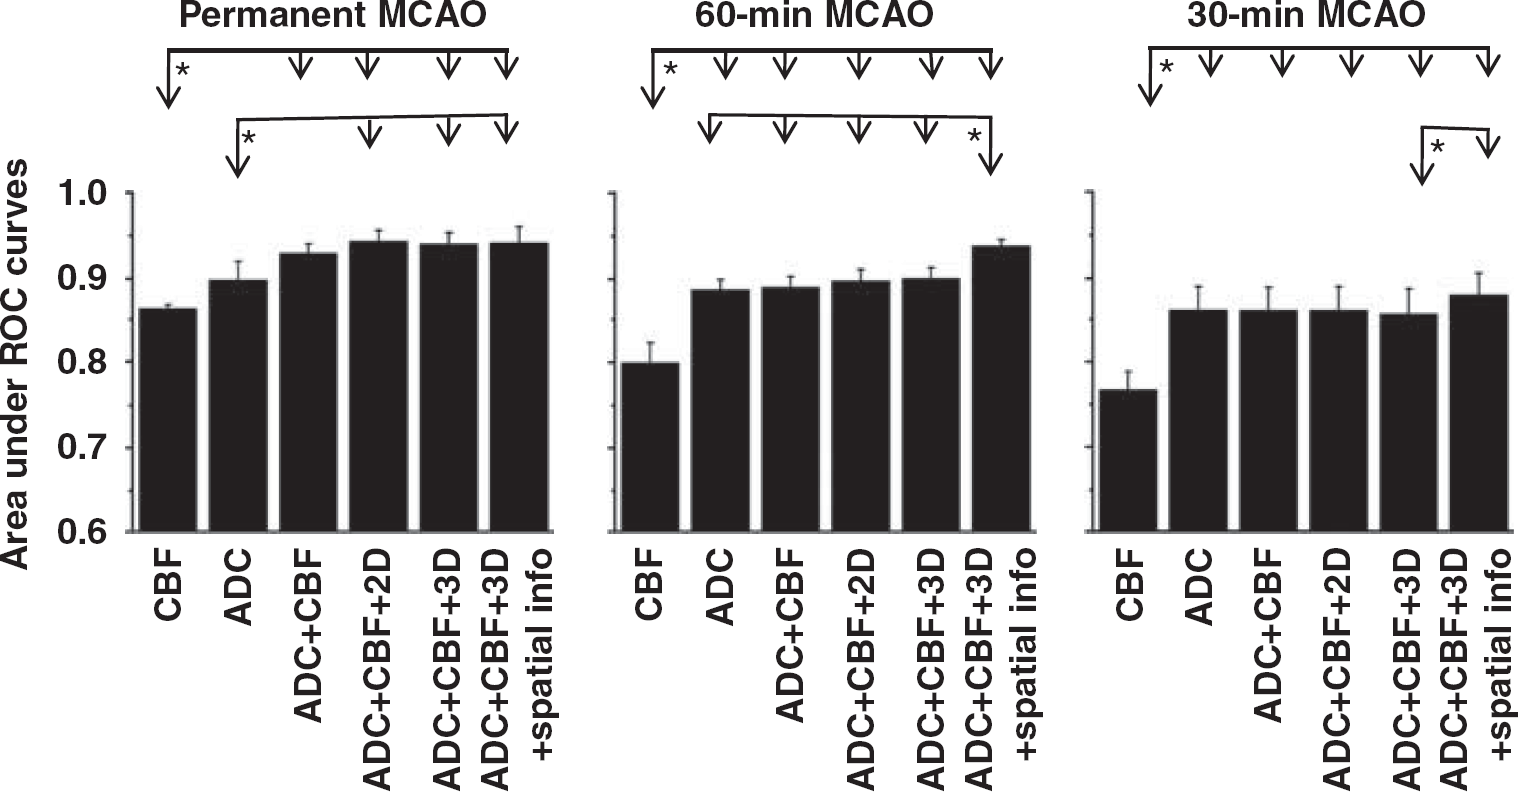
The areas under receiver-operating characteristic (ROC) curves for the three different occlusion durations: permanent, 30- and 60-minute middle cerebral artery occlusion (MCAO). Predictions for each MCAO group training with its own basis set. Two-way analysis of variance (ANOVA) with multiple comparisons applying Tukey–Kramer's correction; *
Specifically, within each MCAO group, predictions made using CBF alone were significantly different from those obtained using other conditions (i.e., ADC + CBF, ADC + CBF + 2D, ADC + CBF + 3D, and ADC+ CBF + 3D + spatial information). Furthermore, in the 60-minute MCAO group, the ADC + CBF + 3D + infarction incidence condition showed more significant difference than all other conditions (
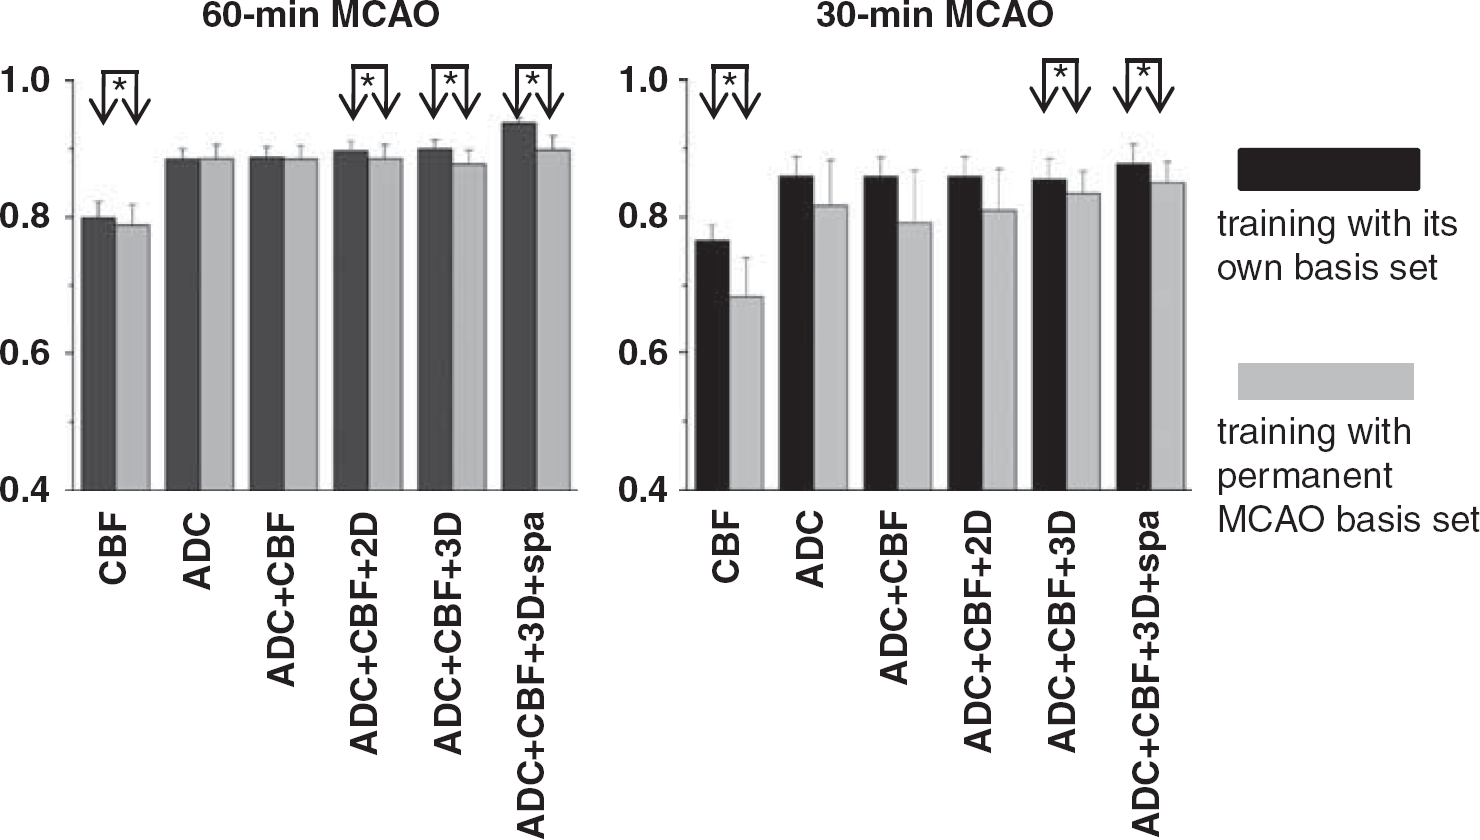
To evaluate the effects of reperfusion, predictions for the 30- and 60-minute MCAO groups were made using the
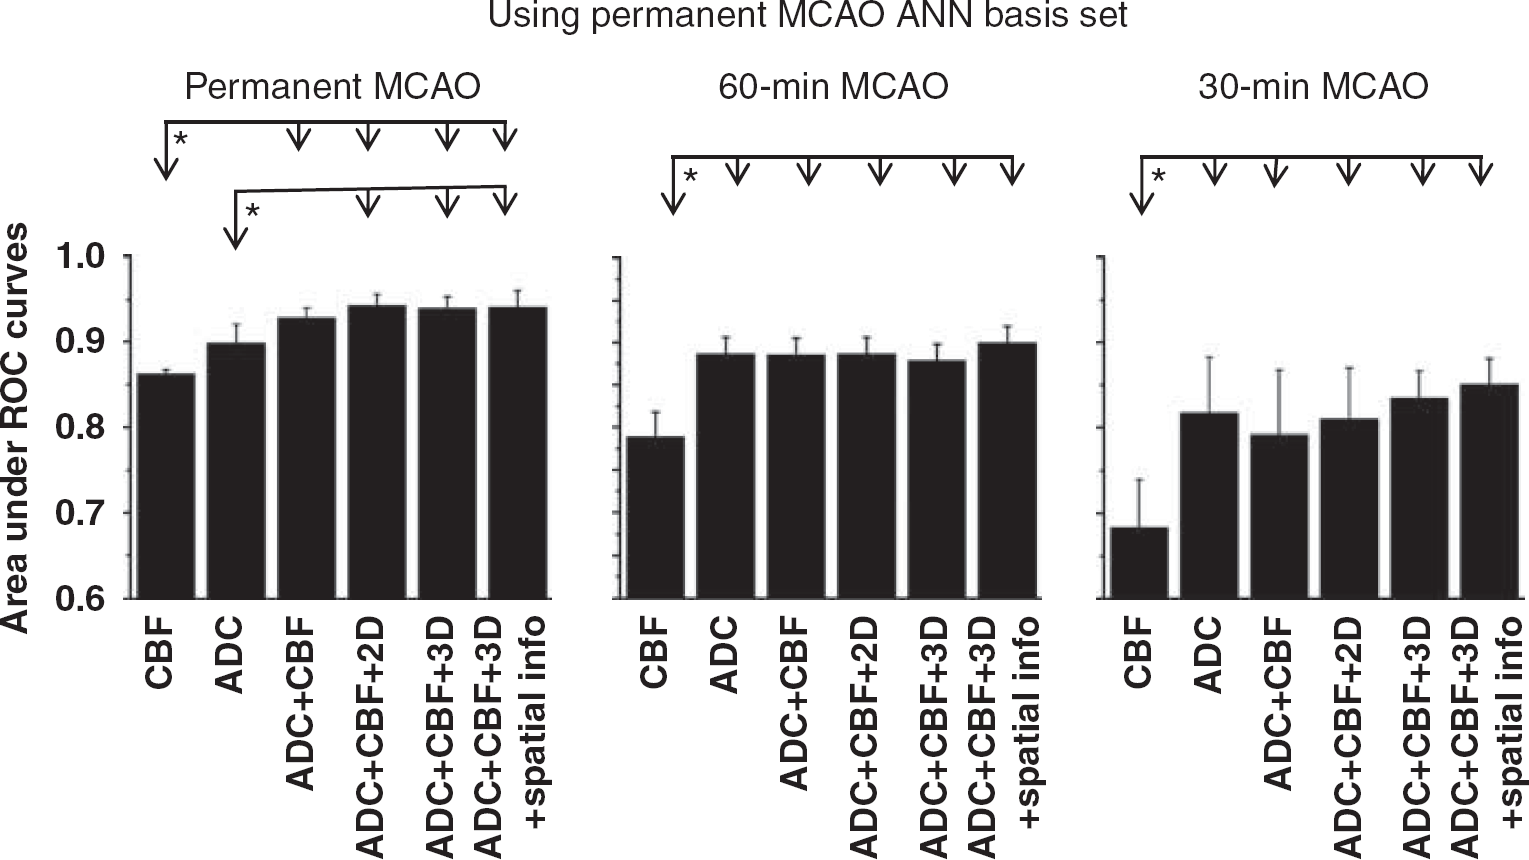
The areas under receiver-operating characteristic (ROC) curves for the three different occlusion durations: permanent, 30- and 60-minute middle cerebral artery occlusion (MCAO). Predictions for all MCAO groups training with the
Comparison With a Previously Published Prediction Model
The AUCs of prediction performance using a previously published probabilistic prediction model (Shen et al, 2005b; Shen and Duong, 2008) are summarized in Table 1. There were no statistical differences between prediction performances (AUCs) obtained using ANN in this study and those obtained by Shen
Comparison of AUC from the probabilistic prediction algorithm (Shen et al, 2005b; Shen and Duong, 2008) and the corresponding AUC from ANN
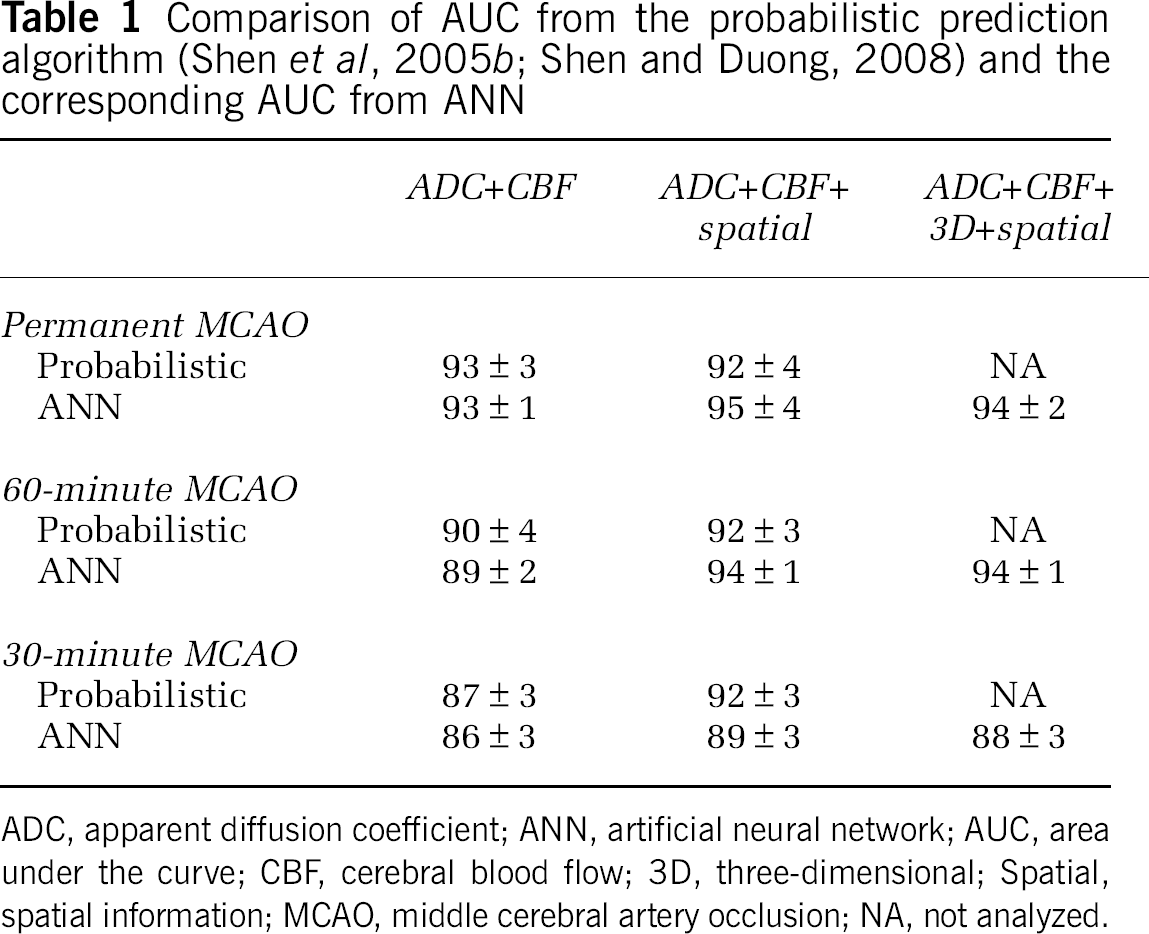
ADC, apparent diffusion coefficient; ANN, artificial neural network; AUC, area under the curve; CBF, cerebral blood flow; 3D, three-dimensional; Spatial, spatial information; MCAO, middle cerebral artery occlusion; NA, not analyzed.
Discussion
A flexible ANN algorithm was developed to predict the ischemic tissue fate pixel by pixel based on multimodal MRI data of acute stroke. The efficacy of the ANN prediction algorithm was evaluated using reproducible rodent stroke models of various occlusion durations. Predictions showed the likelihood of future infarction on a pixel-by-pixel basis. Moreover, accounting for neighboring pixels and infarction incidence improved the prediction accuracy. These results could have important clinical applications.
Artificial Neural Network Algorithms
A key advantage of the ANN prediction algorithm is that it does not need the exact mathematical relation between input and output parameters. A case in point is that incorporation of the spatial information does not require it to be explicitly parameterized. Another advantage of the ANN prediction algorithm is that the training sample sizes can be augmented readily as more data sets become available. The number of image and other input parameters can be large. A disadvantage of the ANN prediction algorithm is that the computational time increases very rapidly with the number of parameters (neurons or layers). However, this is only a one-time computational cost that is incurred during ‘training’ of the ANN.
Determining the optimal numbers of hidden nodes and training epochs remains a major unsolved problem in ANN. The majority of the studies used an arbitrary number of hidden nodes and training epochs (Jorjani et al, 2008; Landeras et al, 2008; Zhang et al, 2008). In this study, we explicitly optimized the number of hidden nodes and number of training epochs. From these data, we found rapid convergence for the AUCs. The AUC reached a plateau at 6 hidden neurons and 40 training epochs for all MCAO groups.
Accounting for Neighboring Pixels
In the ANN prediction algorithms, neighboring pixels were treated as independent inputs, which is not the same as (but may have a similar effect as) spatial smoothing. Accounting for neighboring pixels generally improved the prediction performance, although doing so did not yield statistically significant difference. By inclusion of the nearest-neighborhood information, the ‘noise’ effect from ‘single pixel’ errors on prediction could be minimized. However, inclusion beyond the nearest neighbors would likely improve AUC but could also potentially obscure identification of interesting heterogeneous areas, such as the ischemic penumbra. In this study, only the immediate neighboring pixels (8 neighbors in 2D and 26 neighbors in 3D) were used.
Comparison Among Predictive Models
Using the voxel-based generalized linear model algorithm, Wu et al (2007) predicted infarction in normal and hypertensive stroke rats that were subjected to embolic clot occlusion with and without recombinant tissue plasminogen activator (rt-PA) treatment at 1 hour after stroke. They found that pretreatment-predicted outcome compared with posttreatment histology was highly accurate in saline-treated rats (92% ± 5%). Accuracy was significantly reduced in rt-PA-treated animals (86% ± 8%). Animals that reperfused had significantly lower GLM-predicted infarction risk than nonreperfused animals, suggesting that tissue was more amenable to therapy. In another study, Wu et al (2001) compared the GLM prediction and thresholding methods applied on human stroke data. At their optimal operating points, thresholding algorithms combining DWI and PWI provided 66% sensitivity and 83% specificity, and GLM algorithms combining DWI and PWI predicted with 66% sensitivity and 84% specificity voxels that proceeded to infarct. Thresholding algorithms that combined DWI and PWI provided significant improvement to algorithms that used DWI alone but showed no significant improvement over algorithms that used PWI alone. GLM algorithms that combined DWI and PWI showed significant improvement over algorithms that used only DWI or PWI. The performances of thresholding and GLM algorithms were found to be comparable.
Shen
In this study using ANN prediction algorithms, the areas under the ROC were 86% ± 3%, 89% ± 2%, and 93% ± 1% using AD C+ CBF for the 30-, and 60- minute, and permanent MCAO, respectively. We further reported that adding neighboring pixel information and spatial information markedly improved performance measures over ADC and CBF alone for the 60- and 30-minute MCAO group (88% ± 3% and 94% ± 1%, respectively), but only slightly for the permanent MCAO group (94% ± 2%). These differences were expected because permanent MCAO was less variable and could be sufficiently and accurately accounted for with ADC and CBF. Moreover, to determine the hypothetical effects of reperfusion on prediction, predictions for the 30- and 60-minute MCAO groups were also done by using the
In short, these quantitative prediction models (GLM; Wu et al, 2007), probabilistic model (Shen et al, 2005b; Shen and Duong, 2008), and ANN (this study)) based on acute ADC and CBF data were accurate and yielded comparable AUCs on animal stroke models. Differences in animal stroke models (embolic versus suture), anesthetics (halothane versus isoflurane), and inclusion of slightly different types of MRI data (dynamic susceptibility contrast versus arterial spin labeling of CBF) prevented quantitative comparison. Accounting for infarction incidence improved the prediction accuracy. These predictive algorithms have the potential to serve as promising metrics for diagnosis, prognosis, and therapeutic evaluation of acute stroke.
Future Perspective
Prediction of tissue fate was reasonably accurate despite the small sample sizes in this study. Human stroke is more heterogeneous and so prediction is likely to be less accurate. The major challenge for predictive modeling in stroke is categorization of the type of stroke (i.e., permanent and transient ischemia)
The ANN prediction model may also be applied to other imaging data such as those obtained from transient ischemic attack. Many patients with transient ischemic attack often return to the emergency room with large stroke within 48 hours (Rothwell and Warlow, 2005). Translating the success of basic therapeutic research into proven interventions in humans has been challenging. Objective and accurate prediction models of tissue fate may provide a framework in clinical decision making and may help drug trials by accelerating the identification of the promising potential therapies. Finally, this predictive approach could individualize the treatment window for stroke patients and extend current treatment window options.
Conclusions
This study establishes a flexible ANN predictive algorithm model and incorporates neighboring pixel and infarction incidence information to improve the prediction accuracy of ischemic tissue fate. The ANN prediction model has potential clinical applications towards providing quantitative and objective frameworks to aid clinical decision making in the treatment of acute stroke, testing therapeutic treatments, and tailoring individual treatment.
Footnotes
The authors declare no conflict of interest.