
Abstract
An algorithm was developed to statistically predict ischemic tissue fate on a pixel-by-pixel basis. Quantitative high-resolution (200 × 200μm) cerebral blood flow (CBF) and apparent diffusion coefficient (ADC) were measured on acute stroke rats subjected to permanent middle cerebral artery occlusion and an automated clustering (ISODATA) technique was used to classify ischemic tissue types. Probability and probability density profiles were derived from a training data set (n = 6) and probability maps of risk of subsequent infarction were computed in another group of animals (n = 6) as ischemia progressed. Predictions were applied to overall tissue fate. Performance measures (sensitivity, specificity, and receiver operating characteristic) showed that prediction made based on combined ADC + CBF data outperformed those based on ADC or CBF data alone. At the optimal operating points, combined ADC + CBF predicted tissue infarction with 86%±4% sensitivity and 89%±6% specificity. More importantly, probability of infarct (PI) for different ISODATA-derived ischemic tissue types were also computed: (1) For the ‘normal’ cluster in the ischemic right hemisphere, PI based on combined ADC + CBF data (PI[ADC + CBF]) accurately reflected tissue fate, whereas PI[ADC] and PI[CBF] overestimated infarct probability. (2) For the ‘perfusion—diffusion mismatch’ cluster, PI[AdC + CBF] accurately predicted tissue fate, whereas PI[ADC] underestimated and PI[CBF] overestimated infarct probability. (3) For the core cluster, PI[ADC + CBF], PI[ADC], and PI[CBF] prediction were high and similar (~90%). This study shows an algorithm to statistically predict overall, normal, ischemic core, and ‘penumbral’ tissue fate using early quantitative perfusion and diffusion information. It is suggested that this approach can be applied to stroke patients in a computationally inexpensive manner.
Introduction
Brain tissues with perfusion deficits below a critical threshold (Hossmann, 1994), as visualized on perfusion-weighted images (PWI), will experience metabolic energy failure that subsequently leads to a reduction in the apparent diffusion coefficient (ADC) of water in the brain, and thus hyperintensity on the diffusion-weighted images (DWI) (Moseley et al, 1990). During the first few minutes after ischemia in experimental stroke models or up to a few hours after ischemia in human strokes (i.e., the acute phase), the anatomic area defined by abnormal DWI is typically smaller than the area of perfusion deficit. However, most of the normal DWI-defined ischemic region expands and eventually coincides with the abnormal area defined by PWI. The difference in the abnormal region defined by the abnormal PWI and normal DWI, commonly referred to as the ‘perfusion—diffusion’ mismatch, is thought to approximate the ischemic penumbra and thus could potentially be salvageable (Warach et al, 1996).
The ability to readily and reliably identify and predict ischemic tissue fate during the acute phase would be helpful in clinical decision making to maximize benefit and minimize side effects of therapeutic interventions (Albers, 1999). Many studies have shown the potential of using DWI, PWI, and/or T2-weighted magnetic resonance imaging (MRI) to stage stroke outcomes by correlating with follow-up imaging and/or neurologic status (Oppenheim et al, 2001; Arenillas et al, 2002; Grandin et al, 2002; Schaefer et al, 2002). Most of these analyses in staging ischemic tissue fate were performed using a volumetric approach with region-of-interest (ROI) analysis. Apparent diffusion coefficient and cerebral blood flow (CBF) changes in the brain associated with ischemic injury have been well-documented to be highly heterogeneous. Region-of-interest analysis thereby inadvertently mixes the characteristics that one is trying to resolve. The complex temporal and spatial evolution of focal cerebral ischemia has prompted the use of more sophisticated analysis methods (Welch et al, 1995; Jiang et al, 1997; Carano et al, 1998, 2000; Jacobs et al, 2000, 2001a, b; Wu et al, 2001; Mitsias et al, 2002) to stage stroke outcome. Multiparametric analysis using K-mean and Fuzzy c-mean clustering techniques have been used to classify ischemic tissue fate based on CBF index maps, T2 and ADC maps in a rat stroke model (Carano et al, 1998, 2000). This approach requires the number of tissue clusters to be assigned a priori, which is generally unknown during the evolution of cerebral ischemia. Jacobs et al (2001a) and Mitsias et al (2002) eloquently incorporated the iterative self-organizing data analysis algorithm (ISODATA) (Ball and Hall, 1965) for analyzing T1-, T2- and diffusion-weighted images in human stroke and found that the multiparametric ISODATA analysis outperformed analysis using any single parameter alone. This approach has also been applied to analyze T1-, T2- and diffusion-weighted images in an animal stroke models during the subacute and chronic phase (Jacobs et al, 2001b). More recently, a modified ISODATA approach had been used to dynamically track tissue fate on a pixel-by-pixel basis as ischemia evolves during the acute phase (Shen et al, 2004b). Unlike many other existing clustering techniques, ISODATA analysis requires minimal user intervention and the number of clusters is statistically determined.
Magnetic resonance imaging data obtained early after stroke onset also offers the unique opportunity to statistically predict ischemic tissue fate. Welch et al (1995) used a threshold-based analysis and showed that the combination of T2 and ADC data provided improved prediction of infarction relative to either parameter alone in subacute stroke in humans. Wu et al (2001) reported the eloquent use of a generalized linear model to predict stroke outcomes based on DWI, PWI, and T2 data in humans. Lesions were defined using a threshold-based method to generate the training set. However, this approach appears less intuitive as the contribution of various parameters is difficult to assess.
The goal of this study was to develop and validate a simple and intuitive statistical algorithm for predicting ischemic tissue fate after acute stroke in a well-characterized rat stroke (permanent occlusion) model. We hypothesized that ischemic tissue fate can be statistically predicted with a high degree of accuracy and the prediction performance can be quantitatively evaluated. Quantitative high-resolution perfusion and diffusion imaging was obtained. A modified ISODATA cluster analysis (as opposed to a threshold-based analysis) was used to classify tissue types. Prediction of tissue infarct was made for overall tissue fate as well as for individual ISODATA-defined pixel clusters (such as normal tissue, ischemic ‘penumbra’ and ischemic core). Probability profiles were derived and prediction using ADC data alone, CBF data alone, and CBF+ADC data were compared and correlated with end point imaging and histology. The resultant prediction maps were not used to identify tissue infarction but to predict risk of future infarction. Performance measures of the prediction, such as sensitivity, specificity, receiver operating characteristic, were also evaluated.
Methods
Animal Preparations
Twelve male Sprague—Dawley rats (300 to 350 g, Taconic Farms, NY, USA) were initially anesthetized with chloral hydrate (400 mg/kg, intraperitoneally: Sigma, St Louis, USA). Animals were subjected to permanent intraluminal middle cerebral artery occlusion (MCAO) as previously described (Shen et al, 20032004a). The left femoral artery was catheterized for blood-gas sampling, continuous blood pressure and heart rate monitoring. Blood pressure, heart rate, respiration rate, rectal temperature, blood gases were maintained within normal physiologic ranges (Shen et al, 2003, 2004a). Once the animal was in the magnet, the anesthetic was switched to ~1% isoflurane. All animals breathed spontaneously throughout without mechanical ventilation. At ~24 h after ischemia, the animals were killed and stained with 2,3,5-triphenyltetrazolium chloride (TTC) to determine infarct volume with edema correction (Shen et al, 2003, 2004a).
MR Experiments
Magnetic resonance imaging was performed on a Bruker 4.7-T/40-cm (Billerica, MA, USA) and a 20-G/cm gradient insert (ID = 12 cm, 120-μs rise time). The animal was placed into a stereotaxic headset and onto an animal holder, which consisted of an actively decoupled surface coil (2.3-cm ID) for brain imaging and a butterfly neck coil for arterial spin labeling (Shen et al, 2003, 2004a; Sicard et al, 2003). Coil-to-coil interaction was actively decoupled. Imaging was performed at 30, 60, 90, 120, and 180 mins.
High-resolution ADCav was obtained by averaging three ADC maps acquired separately with diffusion-sensitive gradients applied along the x, y or z direction (Stejskal and Tanner, 1965). Data were acquired using four-segment, spin-echo, echo-planar images (EPI), matrix = 128 × 128, FOV = 2.56 × 2.56 cm, spectral width = 200 kHz, TR = 2 secs per segment (90° flip angle), TE = 37.5 ms, b = 10 and 1270 s/mm2, Δ=17.53 ms, δ = 5.6 ms, eight 1.5-mm slices, and 16 averages (total time ~8.5 mins).
Quantitative high-resolution CBF was measured using the continuous arterial spin-labeling technique (Silva et al, 1999; Duong et al, 2000) with gradient-echo EPI and parameters similar to the ADC measurement except TE = 20 ms. Paired images were acquired alternately one with and the other without, arterial spin-labeling preparation. Seventy-six pairs of images (total time ~20 mins) were acquired for signal averaging with half acquired before, and the other half after, the ADC measurements.
Data Analysis
Data analysis used codes written in Matlab (MathWorks, Natick, MA, USA) and displayed in STIMULATE (Strupp, 1996) software. Only six anterior slices were analyzed to avoid susceptibility distortion around the ear canals. All data were reported as mean±s.d. T-test with P<0.05 was considered to be statistically significant.
ADC and CBF calculation: Apparent diffusion coefficient maps with intensity in unit of mm2/sec were calculated pixel-by-pixel using (Stejskal and Tanner, 1965), ADC = -ln (Si/So)/(bi–bo) where bi = γ2 G2i δ2 (Δ–δ/3), ln is the natural logarithm, So and Si are the signal intensities obtained with bo and bi, respectively. The b-value is proportional to the gradient strength (G), magnetogyric ratio (γ), duration of each gradient pulse (δ), and the time (Δ) between applications of the two gradient pulses. Cerebral blood flow images (SCBF) with intensity in units of mL/g min were calculated (Silva et al, 1999; Duong et al, 2000) pixel-by-pixel using, SCBF = λ/T1(Sc–SL)/(SL + (2α–1)Sc), where Sc and SL are signal intensities of the control and labeled images, respectively. λ, the water brain—blood partition coefficient, was taken to be 0.9 (Herscovitch and Raichle, 1985). T1, the water spinlattice relaxation time of tissue, was measured to be 1.5 secs at 4.7 T. α, the arterial spin-labeling efficiency (Williams et al, 1992), was measured to be 0.75 (Shen et al, 2003; Sicard et al, 2003).
ISODATA cluster analysis of lesion volumes: An improved ISODATA clustering algorithm was used to quantify lesion volumes and outcomes based on tissue ADC and CBF characteristics at 3 h as described elsewhere (Shen et al, 2003). This end point was chosen because it has been shown previously that ischemic injury in this permanent MCAO model had stopped evolving (Reith et al, 1995; Tatlisumak et al, 1998; Shen et al, 2003, 2004a). Multiple clusters were statistically resolved and identified as ‘normal’, ‘mismatch,’ and ‘ischemic core’ from the ischemic right hemisphere. Iterative self-organizing data analysis (Shen et al, 2003) was used to establish the training data set.
Probability profiles: In all, 6 of the 12 animals were randomly selected for generating the probability profiles (training Group A) and the prediction of tissue fate was then performed on the remaining 6 animals (experimental Group B). Profiles of the probability of infarct (PI) were plotted as a function of ADC alone, CBF alone and ADC + CBF at 30, 60, 90, and 120 mins after occlusion by determining the percentage of pixels within each grid that migrated to the ischemic core of infracted tissue at 180 mins after ischemia (ischemia stops evolving at 180 mins for this stroke model; Reith et al, 1995; Tatlisumak et al, 1998; Shen et al, 2003; Shen et al, 2004a). For the analysis of ADC alone or CBF alone, the grid size was 0.02 × 10⁻³mm2/sec for ADC or 0.05 mL/g min for CBF, respectively. For ADC + CBF analysis, larger grid sizes of 0.05 × 10⁻³ mm2/sec for ADC and 0.1 mL/g min for CBF were used because of the combined ADC and CBF uncertainties. PI versus ADC and PI versus CBF profiles were calculated. PI contour plots of ADC + CBF data were also calculated and displayed with color coding ranging from 0% to 100% in steps of 10%. Normalized probability density (PD) profiles for ADC, CBF, and ADC + CBF were also computed by multiplying the PI by the number of pixels in each grid. Prediction of infarct volume was made for Group B using only the 30-min data (a representative time point) by looking up the corresponding PI profiles or contour plots of Group A on a pixel-by-pixel basis. A 3 × 3 Hanning filter was used to generate the predicted maps to minimize the effects of ‘noise’ pixels.
Performance measures of the prediction algorithms: Performance measures to evaluate the algorithm's accuracy in predicting tissue fate included sensitivity, specificity, receiver operating characteristic (ROC), optimal operating point (OOP), and partial area index (PAI). By comparing the predicted lesion volumes with the ISODATA lesion volumes on a pixel-by-pixel basis, the number of pixels predicted to infarct that actually did infarct (true positives, TP), and the number of pixels that did not infarct (false-positives, FP) were tabulated. In addition, the number of pixels predicted not to infarct that remained noninfarcted (true negatives, TN) as well as those that became infarcted (false-negatives, FN) were also determined. The algorithm's sensitivity–defined as the true positive ratio TPR = TP/(TP + FN), and specificity–defined as the true negative ratio TNR = TN/(TN + FP), were calculated.
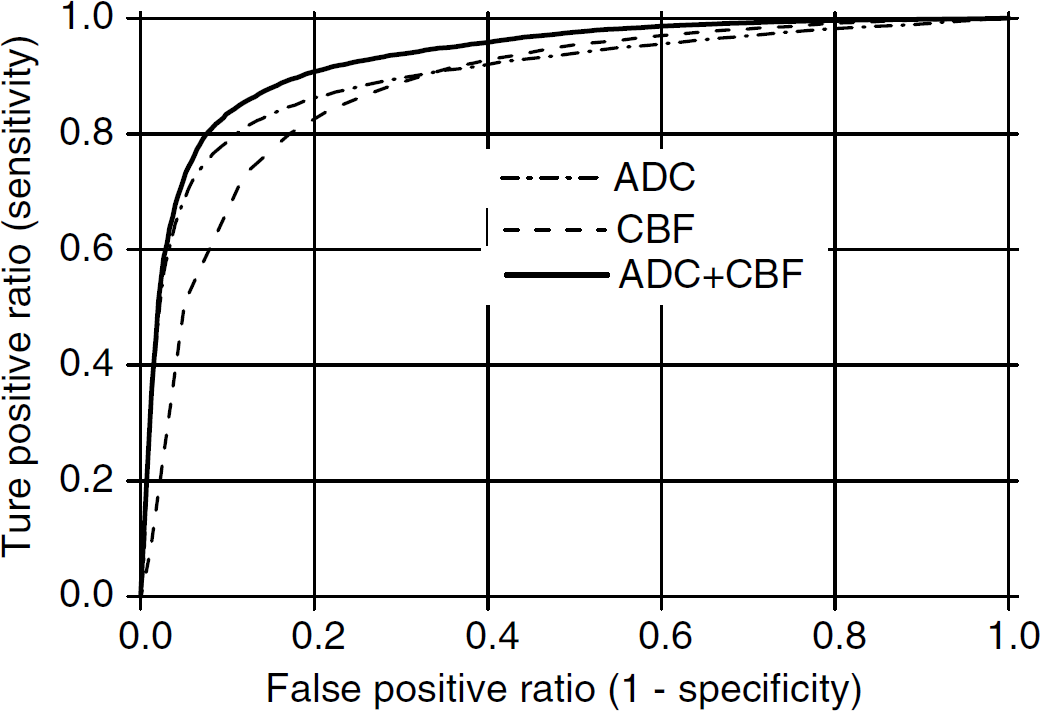
Receiver operating characteristic curves were also generated for each algorithm by plotting TPR (sensitivity) against the false-positive ratio (FPR, which is defined as 1–specificity). The area under the ROC curve was calculated as an indicator of the algorithm performance (Hanley and McNeil, 1982). Optimal operating point on the ROC curve (Wu et al, 2001; Obuchowski, 2003) was obtained by determining the combined sensitivity and specificity that maximizes the function,

where m is the slope tangent to the ROC curve,
Assuming equal probability of infarcted (0.5) and noninfarcted (0.5) voxels and equal costs of false-positives and false-negatives, m is equal to 1 and the OOP for the ROC curve was determined numerically by finding the point on the ROC curve that maximizes the function in equation (1a). PAI was also tabulated for (1–specificity) ranging from 0 to 0.2.
Correlation analysis: To further evaluate the accuracy of the algorithms, a correlation analysis between the predicted lesion volume at the optimal operating point and the TTC infarct volume was performed using linear regression analysis. Correlation analysis was performed for the predicted lesion volumes using ADC data alone, CBF data alone, and ADC + CBF data.
Statistical prediction of individual ISODATA-defined clusters: In addition to analysis of overall tissue fate, probabilities of infarct were also computed for individual ISODATA-defined clusters (normal, mismatch, and core pixels). Similarly, performance measures were also tabulated.
Results
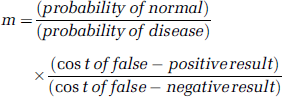
Figure 1A shows the PI versus ADC at different time points after ischemia. PI rose rapidly when ADC dropped below the normal value (0.75±0.01 × 10⁻³mm2/sec, left hemisphere, mean±s.d., n = 12). The ADC values for PI at 50% and 90% were 0.60 to 0.66 × 10⁻³ and 0.58 to 0.60 × 10⁻³mm2/sec, respectively. The PD versus ADC distribution peaked at 0.42 × 10⁻³ mm2/sec, approximating the average ‘core’ ADC value and was relatively time invariant except at 30 min because of the presence of the perfusion—diffusion mismatch. Figure 1B shows the profile of PI versus CBF. PI also rose rapidly when CBF dropped below the normal value (1.2±0.2 mL/g min, left hemisphere). The CBF values for PI at 50% and 90% were 0.5 and 0.15 mL/g min, respectively. In contrast to the ADC data, PI was essentially zero for normal CBF at all time points. The PD versus CBF distribution showed the highest probability density at 0 mL/g min and was relatively time invariant.
Profiles of probability of infarct and probability density of infarct as a function of (
Two-dimensional PI contour plots based on the combined ADC + CBF data at different time points after ischemia were computed (Figure 1C, Group A, n = 6). Pixels with low ADC and low CBF showed high PI. The ‘mismatch’ zone, in which the ADC was normal or near normal but the CBF was reduced, dynamically evolved and showed a nonzero PI (>20%). The PD contour plot showed two modes at 30 mins after ischemia and a single mode at subsequent time points. As ischemia progressed, the PI contour plots became sharper with the highest probability density remained relatively time invariant (ADC ~0.42 × 10⁻³mm2/sec and CBF ~0 mL/g min).
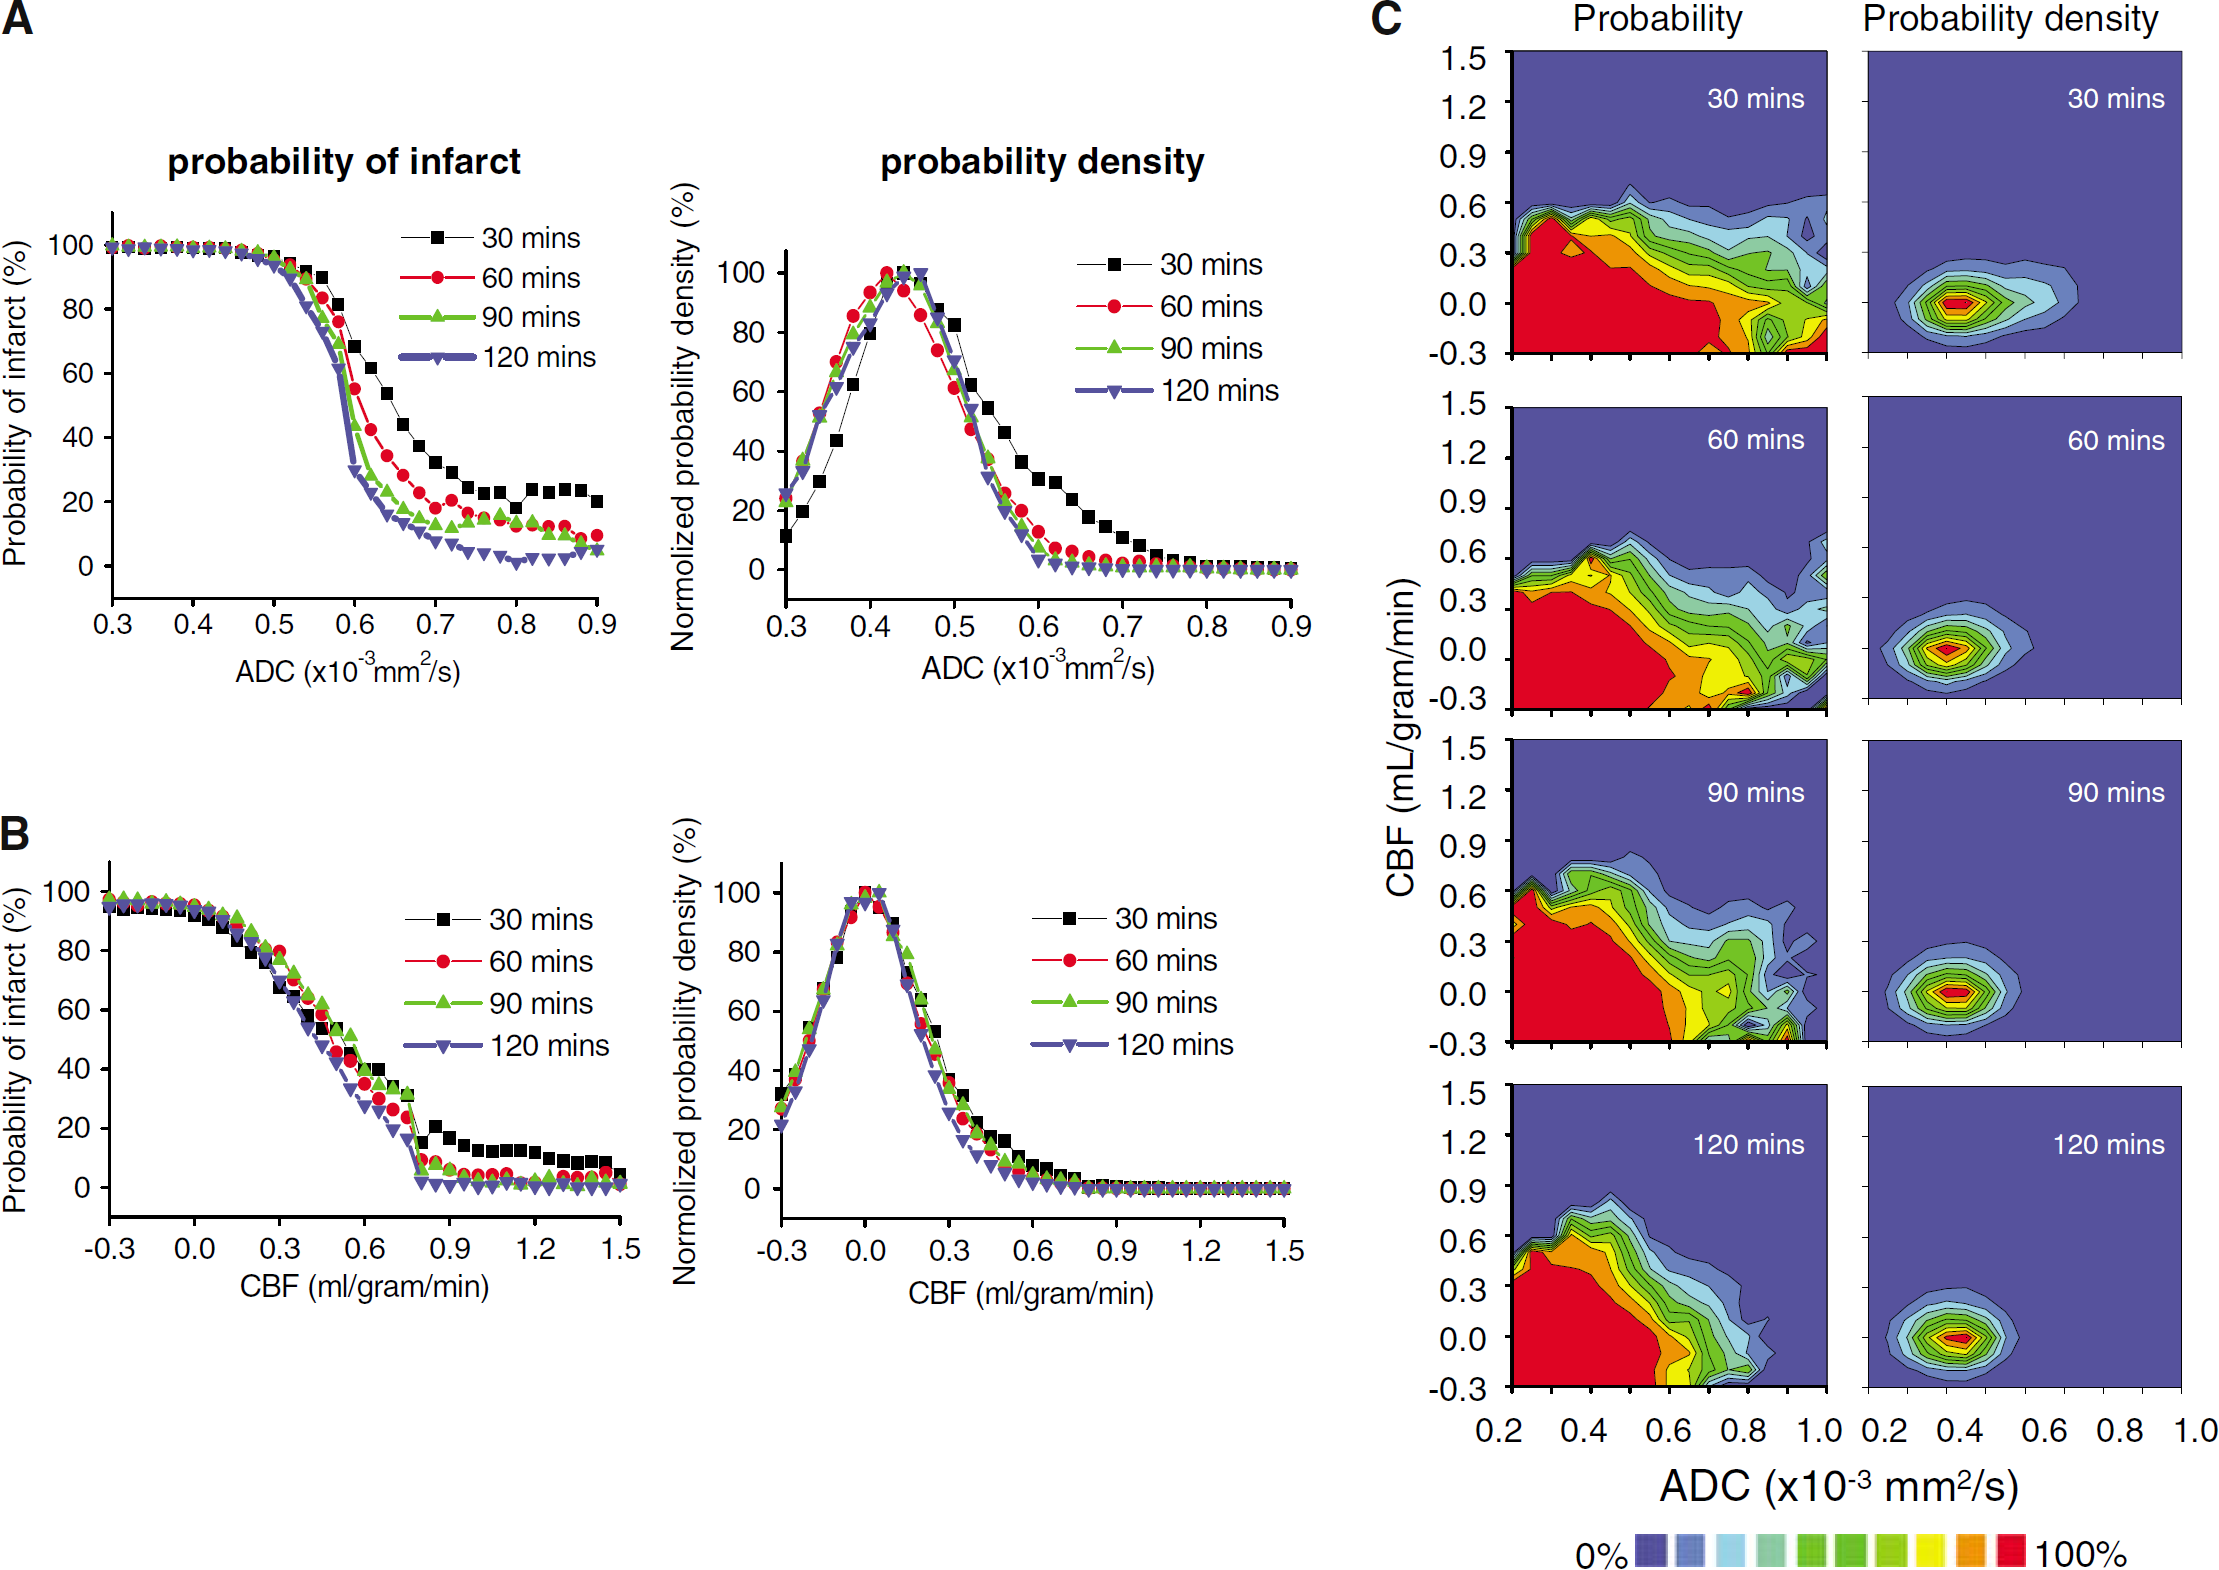
Probability maps of risk of subsequent infarction were computed on a separate group of animals (Group B, n = 6). Figure 2 shows the probability maps of future infarction based on the 30-min ADC, CBF, and ADC + CBF data from one animal. For comparison, ADC and CBF maps at 30 and 180 mins, ISODATA analysis of the 180-min data, and 24-h TTC histology are also displayed. Prediction made with ADC data alone underestimated infarct volume whereas predictions made with CBF data alone overestimated infarct volume. With the combined ADC + CBF data, most of the mismatch pixels (circular ROI in the inset) were predicted correctly to go into infarct (i.e., correlated with histology and ISODATA results), whereas with ADC data alone, the mismatch was incorrectly predicted not to go into infarct. Furthermore, with the combined ADC + CBF information, most of the ‘normal’ pixels in the right hemisphere (rectangular ROI in the inset) was predicted to remain normal with significantly higher certainty (PI~0), whereas with CBF data alone, most of the ‘normal’ pixels were incorrectly predicted to have substantial nonzero probability of going into infarct. Predicted infarct volumes based on the ADC + CBF data showed the best correspondence with the ISODATA maps and the 24-h TTC infarct volumes.
Probability maps of risk of future infarction determined based on the 30-min apparent diffusion coefficient (ADC) data alone, cerebral blood flow (CBF) data alone, and ADC + CBF data from a representative animal (experimental Group B). Multislice images are displayed from left to right as posterior to anterior slices. Also shown are the 30-min ADC and CBF maps, 180-min ADC maps, ISODATA analysis at 180 mins, and 24-h TTC staining. Hypointensities in the ADC and CBF maps indicate regions of reduced ADC and CBF values, respectively. Red-yellow color bar indicates the probability of infarct ranging from 0% to 100% in steps of 10%. The inset shows prediction using ADC alone underestimated infarct volume whereas CBF alone overestimated infarct volume (circular ROI). Prediction using ADC + CBF showed ‘normal’ tissues having a high degree of certainty of not going into infarct (low probability, rectangular ROI) relative ADC or CBF alone.
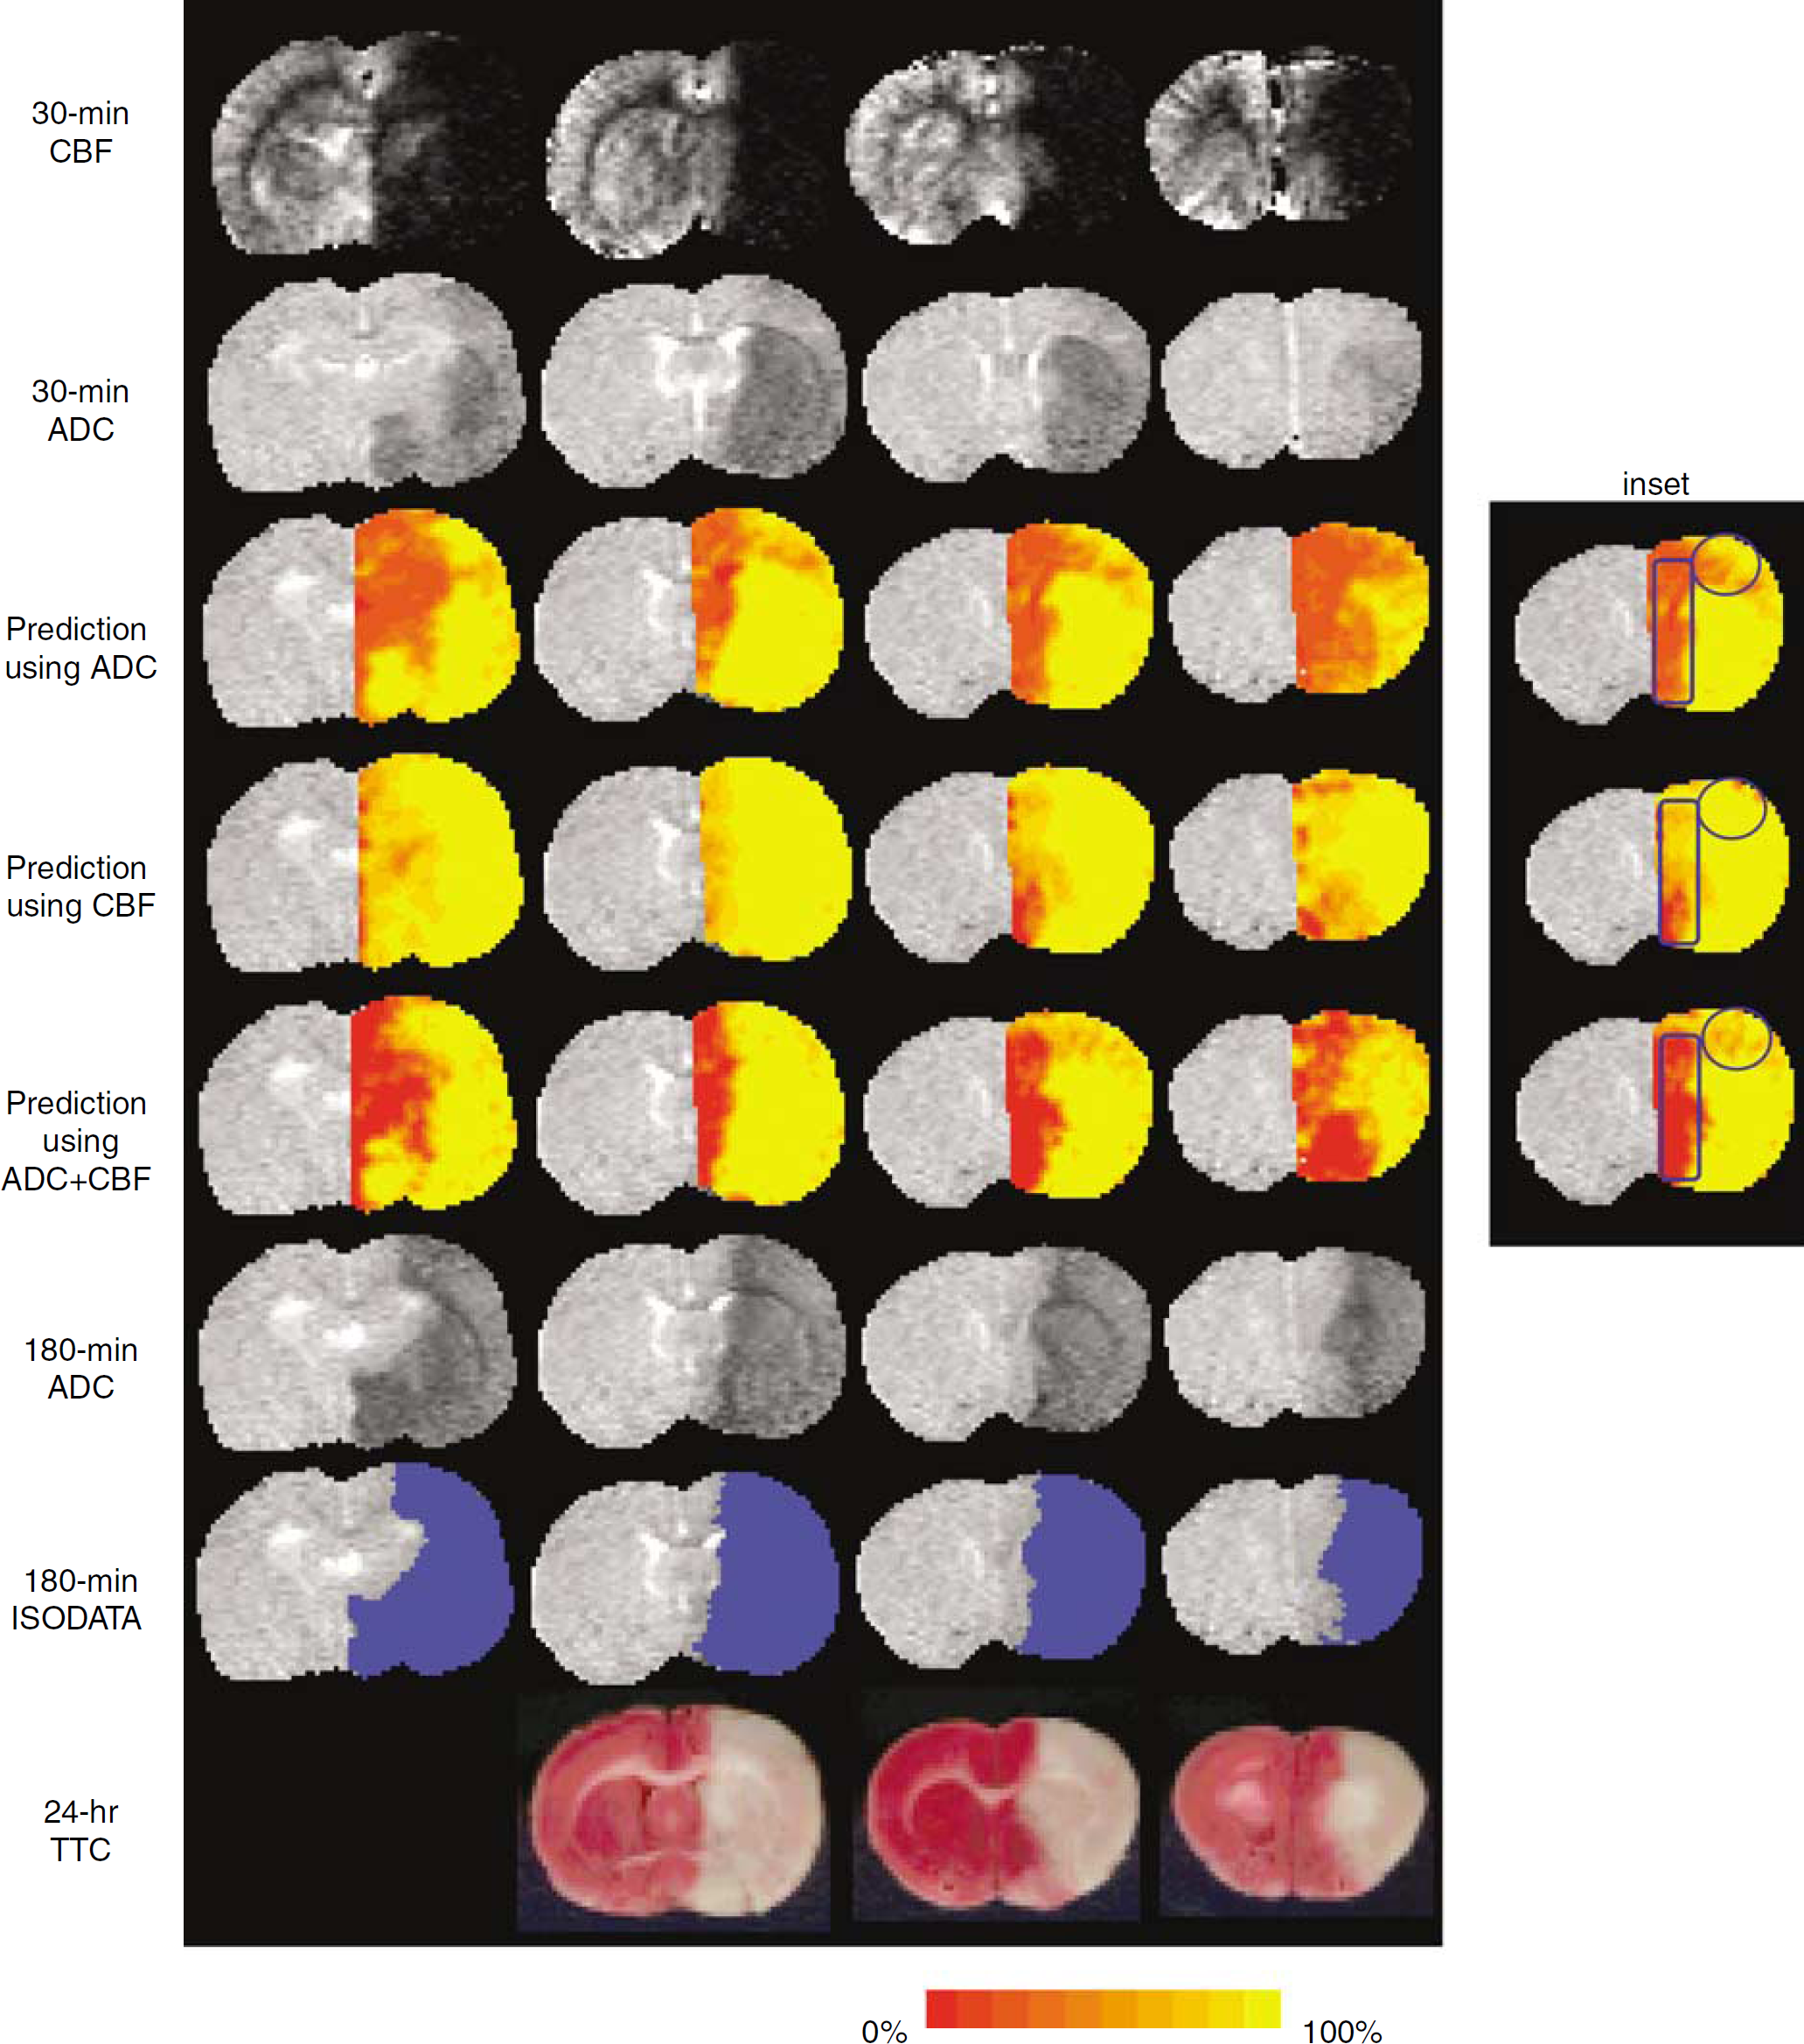
Receiver operating characteristic curves were used to evaluate the accuracy of the predictions made by using ADC alone, CBF alone, and ADC + CBF (Figure 3, Group B). The optimal operating point, sensitivity, specificity, area under the ROC curve, and PAI are summarized in Table 1. Predictions made using ADC + CBF data generally showed higher sensitivity, specificity, area under ROC curve, and PAI than those using ADC alone or CBF alone. At the optimal operating points, combined ADC + CBF predicted tissue infarction with 86%±4% sensitivity and 89%±6% specificity.
Receiver operating-characteristic (ROC) curves of sensitivity versus (1–specificity) of the overall prediction of tissue fate. Data were derived from incorporating the apparent diffusion coefficient (ADC) data, cerebral blood flow (CBF) data, and ADC + CBF data (Group B, n = 6). All standard-deviation error bars were < <0.05 and are not displayed for clarity.
Group-average performance measures of the prediction algorithm of overall tissue fates (n = 6, Group B)
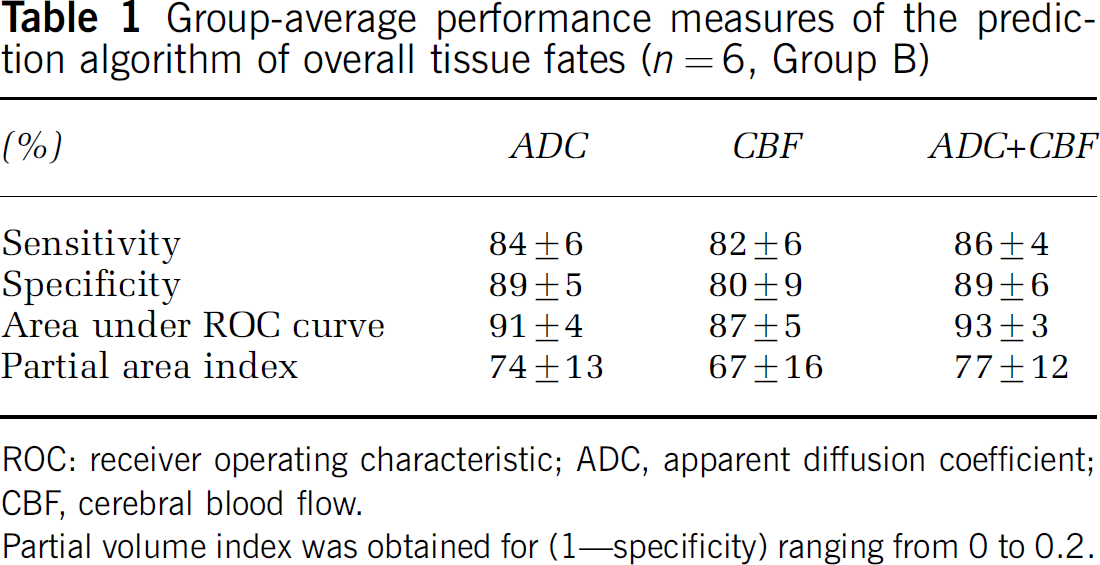
ROC: receiver operating characteristic; ADC, apparent diffusion coefficient; CBF, cerebral blood flow.
Partial volume index was obtained for (1–specificity) ranging from 0 to 0.2.
To further evaluate the performance of the prediction algorithm, predicted infarct volumes were derived at the optimal operating point and correlated with TTC infarct volumes. The optimal operating point is effectively an objective threshold (similar to viability threshold) and may be used in clinical decision making. The predicted infarct volume derived from ADC + CBF (189±44 mm3) provided better correlation with TTC infarct volumes (190±51 mm3), whereas ADC alone (187±64 mm3) slightly underestimated and CBF alone (206±43 mm3) slightly overestimated infarct volumes. The large uncertainties largely reflected cross-subject variations. The correlation coefficients were 0.88, 0.92, and 0.96 for CBF alone, ADC alone, and ADC + CBF, respectively.
In addition to predicting overall tissue fate, predictions were also made for individual tissue types. ISODATA was used to classify normal, mismatch and core pixels at 30 mins. Prediction of infarct for each tissue type was made and the results for one animal were as follows: (1) For the PI of the right-hemisphere normal cluster, combined ADC + CBF data correctly showed low probability of infarct, whereas ADC data alone and CBF data alone showed substantial probability of infarct. (2) For the mismatch cluster, combined ADC + CBF data correctly predicted the infarct probability whereas ADC underestimated the infarct probability and CBF overestimated the infarct probability. (3) For the core cluster, PI for ADC data alone, CBF data alone and ADC + CBF data were high and similar. The group-average results are quantitatively summarized in Table 2A.
(A) Group-average probability of infarct (PI) for different ISODATA-defined tissue types (n = 6, Group B) and (B) Group-average performance measures of the prediction algorithm for individual ISODATA-defined tissue types (n = 6, Group B)

AUC: area under the receiver-operating-characteristic curve; ADC, apparent diffusion coefficient; CBF, cerebral blood flow; PAI, partial area index. Partial volume index was obtained for (1–specificity) ranging from 0 to 0.2.
ADC + CBF was statistically different from ADC (P<0.05).
ADC + CBF was statistically different from CBF (P<0.05).
Receiver operating characteristic analyses of the predictions made for individual ISODATA cluster are shown in Figure 4 (Group B). The group-average optimal operating point, sensitivity, specificity, area under the ROC curve and PAI are summarized in Table 2B. For the normal cluster, performances of the prediction made with ADC + CBF showed clear improvement over those made with ADC or CBF alone. For the mismatch cluster, performances of the prediction also showed clear improvement over those made with ADC or CBF alone. ROC analysis of the core cluster was not performed because the false-positive ratio is essentially zero (i.e., essentially all core pixels stayed core). Area under the ROC curve and PAI of the prediction made on ADC + CBF data showed the best performance for all tissue types.
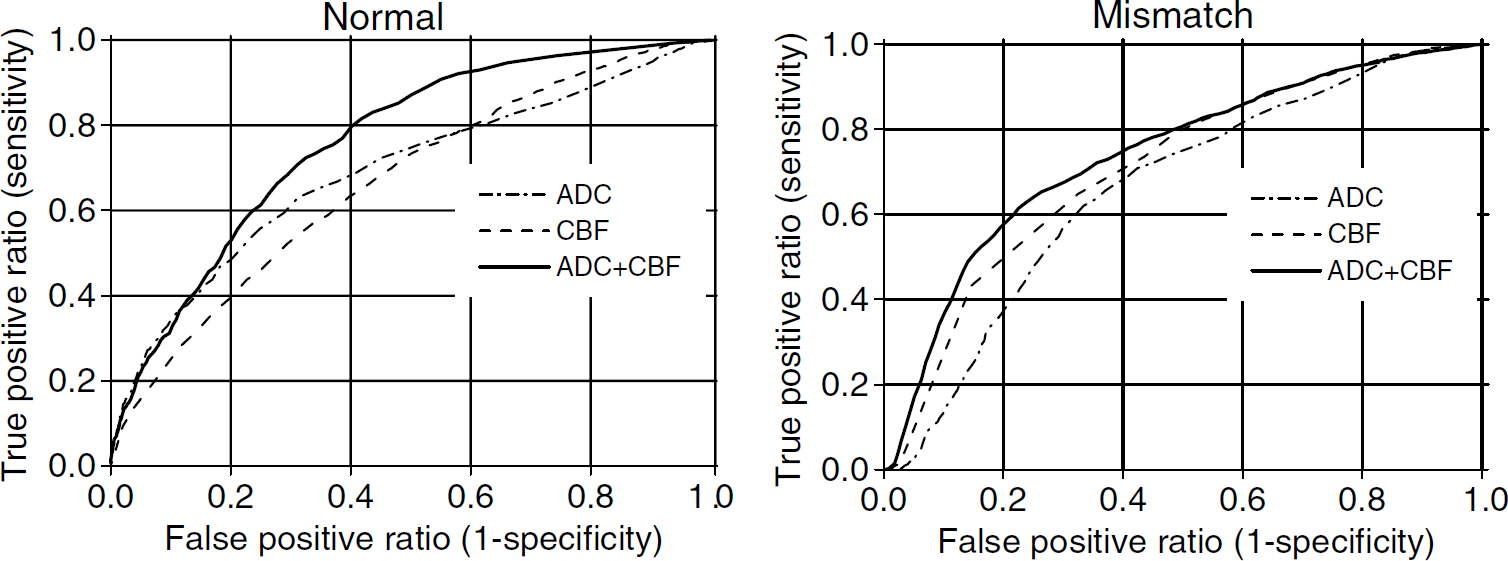
Receiver operating-characteristic (ROC) curves of sensitivity versus (1–specificity) of each ISODATA-derived (normal, mismatch and core) pixel clusters derived from incorporating the apparent diffusion coefficient (ADC) data, cerebral blood flow (CBF) data and ADC±CBF data (Group B, n = 6). All standard deviation error bars were ≪0.05 and are not displayed for clarity.
Discussion
An intuitive statistical algorithm was developed to predict ischemic tissue fate in acute experimental stroke based on quantitative high-resolution perfusion and diffusion imaging. This algorithm was tested in a well-established experimental rat stroke model during the acute phase and at different time points of the ischemic progression. Probability, probability density profiles, and prediction maps of risk of future infarction provided intuitive information of ischemic tissue fate and showed excellent correlation with end point imaging and histology. Furthermore, by combining with an automated ISODATA tissue segmentation analysis, probabilities of infarct for different tissue types (i.e., normal, mismatch, and core pixels) were also determined on a pixel-by-pixel basis. Performance measures demonstrated that the prediction based on ADC + CBF data generally outperformed those based on ADC or CBF alone.
Multi-Parametric Cluster Analysis
Accurate classification of tissue types is important to properly generate a training set for probability prediction. At the minimum, ‘core’ pixels must be defined. The criteria used to classify such ‘core’ pixels could affect the probability distribution and, thus, the outcome of prediction. Threshold-based criteria for ADC, CBF, and T2 changes as well as follow-up imaging to define the ‘core’ pixels had been used. Viability thresholds were typically defined as being one or two standard deviations below the normal values or are based on correlation with a histological ‘gold standard,‘ which may be difficult to validate precisely. ISODATA cluster analysis, instead of threshold-based analysis, was used in this study to define ‘core’ pixels. ISODATA cluster analysis is an automated, unsupervised multiparametric clustering method, which requires minimal user intervention, and the infarct volume derived with this method showed excellent correlation with the histological infarct volume as shown previously in the same animal stroke model (Shen et al, 2004b). Only ADC and CBF data were used because they were informative during the acute phase; changes in T1 and T2 relaxation times did not occur until a few hours after stroke onset coinciding with the advent of the vasogenic edema.
Prediction Made with ADC or CBF Alone, and ADC + CBF
Apparent diffusion coefficient and CBF values at which there is a 50% probability of infarct, PI(50%), are characteristic constants for a given stroke model. The ADC at PI(50%) and PD slowly decreased as ischemia evolved, coinciding with the disappearing mismatch. In contrast, the CBF PI(50%) was relatively time invariant. Previously reported ADC and CBF viability thresholds were 0.53 × 10⁻³mm2/sec and 0.3 mL/g min, respectively (Shen et al, 2003) and these thresholds corresponded to very high (95% and 85%, respectively) probability of infarction, as expected.
PI was nonzero even for normal ADC at the earlier time points. This was, however, expected because the mismatch at the earlier time points (i.e., 30 mins after ischemia) had a nonzero probability to become infarcted as ischemia progressed. Indeed, PI at normal ADC decreased with time, coinciding with the disappearing mismatch. Thus, prediction made based on ADC alone was expected to underestimate infarct volume. However, prediction made based on CBF alone was expected to overestimate infarct volume.
Performance measures allowed further comparisons to be made. Prediction based on ADC data alone showed a relatively high false-negative prediction that resulted in a relatively low prediction sensitivity and thus underestimated the infarct volumes. This is because of the presence of the ‘mismatch’ pixels at the early time points, which became infarcted in a time-dependent manner. The sensitivity of prediction based on ADC data alone was indeed poorer at the earlier time points. On the contrary, prediction based on CBF data alone had relatively high false-positive prediction, resulting in relatively low specificity and thus overestimated the infarct volumes. This is because not all pixels with mild CBF reduction become infarcted (Shen et al, 2004a, b ) (i.e., the persistent ‘mismatch’). Predictions made using combined ADC + CBF data yielded a balance between sensitivity and specificity, resulting in an overall improvement in the algorithm performance.
Comparison with Existing Prediction Algorithms
Reports on pixel-by-pixel and statistical prediction of ischemic tissue fate in form of probability maps are sparse. Zhao et al (1997) developed ‘infarct frequency distribution maps’ to show the probability of tissue infarction based on coregistered histological slides. Welch et al (1995) developed a signature model based on diffusion- and T2-weighted imaging during the subacute stroke phase and used it to predict reversible and irreversible ischemic brain injury. More recently, Wu et al (2001) propose a generalized linear model (GLM) analysis of multiparametric data to predict ischemic brain injury. Perfusion imaging using the Gd-DTPA bolus tracking technique was used to derive CBF, cerebral blood volume, mean transit time, and time to peak data. Diffusion and T2 data were also measured. Tissue classification in the training data set was based on ROIs of tissues that were clearly infarcted or normal. Probability maps of infarction were derived. Their prediction algorithm showed 66% sensitivity and 84% specificity. One major advantage of GLM application to multispectral analysis is computational speed because it involves solving a system of linear equations instead of performing iterative regression analysis on multiple parameters; the latter is computationally expensive as the number of parameters in the basis set grows. One drawback is that the predictions were relatively less intuitive, and contributions of various measured parameters with different signal-to-noise and contrast-to-noise ratios were difficult to evaluate. The highly variable outcomes in human stroke relative to animal stroke models contributed to relatively poor sensitivity and specificity, despite reasonable selection of stroke patients with similar stroke characteristic. The low sensitivity reported relative to specificity suggests that the prediction model is dominated by ADC and/or T2 parameters because ADC and T2 are the better indicators of final infarction and thus contributed more to specificity compared with other MR parameters. Only prediction of the overall tissue fates was made. Our data indicated that specificity and sensitivity of the overall probability of infarct may not be the optimal measures of the algorithm's performance (see below); prediction of tissues for individual ischemic tissue types may be more helpful and appropriate.
There are several advantages of the prediction algorithm and the animal stroke model used herein. First, the statistical prediction algorithm was based on quantitative high-resolution ADC and CBF data that offered a simple and intuitive means to predict ischemic tissue fate during the acute phase. Color-coded probability maps of future infarction on a pixel-by-pixel basis were highly correlated with TTC infarct volumes despite the relatively small sample size. Various performance measures showed excellent specificity and sensitivity.
Secondly, by combining the modified ISODATA clustering algorithm, probability of infarct could be evaluated for individual tissue types, namely, ‘normal’, ‘mismatch,’ and ‘core’ pixels. Although performance measures of overall tissue fate prediction made with ADC + CBF generally (but not always) showed improvement over those made with ADC or CBF alone, the improvement was surprisingly small. This is because the performance measures based on the prediction of overall tissue fate have poor dynamic ranges (i.e., good performance is clustered at the very high percentage of sensitivity and specificity) and are dominated by the fate of the ‘core’ pixels. Partial area index was helpful because it samples specific region of under the ROC curve region with a larger dynamic range. However, the choice of the ranges over which the area is integrated is subjective and such ranges could depend on diseases and/or disease stages. The combined automated tissue classification and statistical prediction proposed herein are important because it allowed the performance measures of individual tissue types to be assessed, avoiding the aforementioned drawbacks. Indeed, performance analysis confirmed that the poor dynamic ranges of the ROC curves were dominated by the fate of the already infarcted pixels. Performance measures of individual tissue types thus provided a more sensitive and appropriate assessment of the prediction accuracy compared with those of the overall tissue fates.
It was anticipated that prediction of the ‘normal’ tissue should improve with combined ADC + CBF and this was indeed observed. Contrary to expectation, prediction of the ‘mismatch’ tissue was not significantly improved with combined ADC + CBF over ADC or CBF alone. Although ADC + CBF has high sensitivity, it also showed increased false-positive prediction rate because not all mismatch pixels became infarcted. Furthermore, since the number of mismatch pixels was relatively small compared with other clusters, the false-positive prediction of the mismatch cluster had a relatively larger effect in the ROC analysis.
Finally, another advantage of the current approach is that the sample size of the training basis set can be improved by adding more subjects to the training set and prediction of infarct can be achieved by simply using the look-up table in a computationally inexpensive manner. To improve performance of the prediction algorithm, it is important to carefully select samples to be included in the training data set. Adding more parameters to the prediction algorithm does not necessarily improve prediction unless they are informative. The samples to be used in the training data also need to be properly categorized. For example, permanent and transient ischemia with or without therapeutic intervention need to be distinguished and/or different prediction algorithms need to be generated for different conditions. Poor performance of the prediction algorithm is likely to be caused by not properly selecting samples to be included in the training data set and not properly applying the appropriate prediction algorithm to specific type of ischemic injury. Establishing proper training basis sets and selecting the proper algorithm, however, may not be trivial in clinical practice. Combined tissue classification and probability prediction nonetheless offer the potential to accurately predict ischemic tissue fate in the clinical settings in a computationally inexpensive manner and is currently under investigation.
Conclusion
This study showed a simple and intuitive pixel-by-pixel probability-based algorithm to statistically predict ischemic tissue fate of different tissue types based on early quantitative perfusion and diffusion data. The accuracy of infarct prediction could be quantitatively evaluated. This algorithm was tested on an established experimental stroke model. Performance measures demonstrated that prediction made based on ADC + CBF data outperformed those based on ADC data alone or CBF data alone. Predicted tissue fate based on ADC + CBF data showed remarkable correlation with histological and ISODATA-defined lesion volumes on a pixel-by-pixel basis. This approach provides a novel means to analyze stroke data. The implication is that prediction of tissue infarct could be achieved by establishing catalogs of training data sets for different types of ischemic injury and by developing an algorithm to statistically determine which of the training data set should be applied to specific stroke patients in a computationally inexpensive manner.