
Abstract
Beta-probes are a relatively new tool for tracer kinetic studies in animals. They are highly suited to evaluate new positron emission tomography tracers or measure physiologic parameters at rest and after some kind of stimulation or intervention. In many of these experiments, the knowledge of CBF is highly important. Thus, the purpose of this study was to evaluate the method of CBF measurements using a beta-probe and H215O. CBF was measured in the barrel cortex of eight rats at baseline and after acetazolamide challenge. Trigeminal nerve stimulation was additionally performed in five animals. In each category, three injections of 250 to 300 MBq H215O were performed at 10-minute intervals. Data were analyzed using a standard one-tissue compartment model (K1 = CBF, k2 = CBF/p, where p is the partition coefficient). Values for K1 were 0.35 ± 0.09, 0.58 ± 0.16, and 0.49 ± 0.03 mL · min−1 · mL−1 at rest, after acetazolamide challenge, and during trigeminal nerve stimulation, respectively. The corresponding values for k2 were 0.55 ± 0.12, 0.94 ± 0.16, and 0.85 ± 0.12 min−7, and for p were 0.64 ± 0.05, 0.61 ± 0.07, and 0.59 ± 0.06. The standard deviation of the difference between two successive experiments, a measure for the reproducibility of the method, was 10.1%, 13.0%, and 5.7% for K1, k2, and p, respectively. In summary, beta-probes in conjunction with H215O allow the reproducible quantitative measurement of CBF, although some systematic underestimation seems to occur, probably because of partial volume effects.
Beta-probes have recently been introduced to measure the time course of tracer uptake with high temporal resolution (Pain et al., 2002, 2000; Woody et al., 2002; Zimmer et al., 2002). The applications of the method are widespread. Examples are blocking and displacing experiments with receptor ligands or the measurement of glucose metabolism using 18fluorodeoxyglucose under different conditions. Compared to an animal positron emission tomography (PET) system, they are relatively cheap, the temporal resolution is much higher and measurements can potentially be performed in the awake animal. However, simultaneous information can only be obtained from a few locations, whereas the PET systems cover the whole brain. In some applications of the betaprobe, the knowledge of CBF is important. The purpose of this study was to evaluate a beta-probe with regard to CBF measurements in conjunction with H215O.
MATERIALS AND METHODS
Animal preparation
The study included eight male rats (Sprague-Dawley) weighing approximately 300 g. Surgery was performed under isoflurane anesthesia and involved the placement of an arteriovenous shunt from the right femoral artery to the right femoral vein, tracheotomy for mechanical ventilation and craniotomy for the placement of the beta-probe. The actual experiment was then performed under alpha-chloralose anesthesia. 25 mg kg−1 body weight was injected in the axillary fatty tissue immediately after the induction of the anesthesia. After surgery, alpha chloralose (made soluble at room temperature by mixing it with 2-hydroxypropyl-beta-cyclodextrin (Storer et al., 1997) was constantly infused at 20 mg · kg−1 · h−1. The shunt was used for the continuous monitoring of arterial blood pressure, the infusion of H215O, α-chloralose, acetazolamide, and lethal dose of pentobarbital at the end of the experiment, and for the continuous measurement of 15O activity for the arterial input curve. For the latter purpose, the shunt was run through a coincidence probe that stored the data at 1-second intervals. The online arterial sampling procedure is described in detail elsewhere (Weber et al., 2002).
Electrical stimulation
For the stimulation of the whisker-to-barrel pathway, the infraorbital branch of the trigeminal nerve was stimulated with two stainless steel electrodes. The cathode was inserted through the infraorbital hiatus and the anode was positioned in the masticatory muscle. The current of the stimulation was adjusted to produce whisker movements (pulses of 1-millisecond duration at 1.2-mA, 2-Hz stimulation frequency, using an isolated constant-current stimulator). The stimulation started 30 seconds before the H215O bolus injection and lasted 210 seconds.
Acetazolamide challenge
Acetazolamide is a carbonic anhydrase inhibitor that leads to vasodilatation and can thus be used to induce a global increase in cerebral blood flow. Acetazolamide (66 mg/kg) was intravenously injected in 0.3 mL saline during a 30-second period.
Automated H215O bolus injection
For the administration of the short-living H215O (half-life, 122 seconds) in high concentrations, a special injection instrumentation is mandatory. 15O was produced continuously in the cyclotron and transferred to the synthesis/injection device. (More information on this device can be found at http://www.swisstrace.com.) The injection/synthesis device continuously delivered H215O at a rate of 60 mL/h in a closed loop. For the bolus injections, a peristaltic precision pump (Ismatec SA, Glattbrugg, Switzerland) drew approximately 300 MBq H215O from this loop at a rate of 0.4 mL/min during a 40-second period. This high radioactivity concentration requires careful lead shielding, not only for the experimenters but also to reduce background counts in the photomultiplier tube and coincidence counter.
Beta-probe
The beta-probe used is a modification of the sensor developed by Pain et al (2000) (for further information, see http://www.swisstrace.com). It consists of a scintillation tip (Bicron, BF12, Newbury, OH, U.S.A.) with a length of 0.8 mm and a diameter of 0.25 mm attached to a high numerical aperture glass fiber. The probe was made light-tight by applying a uniform coating of silver particles. The scintillations were measured using a photomultiplier tube and counting electronics (PMT 9131/350B, Package P30CWAD5-08, Electron Tubes Limited). The main contributions to unwanted counts are (1) the dark count of the PMT, (2) background light, and (3) Cerenkov radiation. Dark counts below 1 cps were achieved with the system. Background light is a serious problem that can be eliminated by working in total darkness or by using light-tight probes. Photons can also be created by fast-moving β particles. A particle moving through a medium faster than the speed of light in that medium will radiate light. This light is known as Cerenkov radiation; its spectrum follows the inverse of the wavelength, so it appears blue. Cerenkov radiation is created both in the tissue of the animal and theoretically in the fiber itself. To overcome the problem of Cerenkov radiation, some investigators use a double-probe system where the reference probe has no scintillating fiber and is located close to the scintillating probe so that the contribution from Cerenkov can be subtracted (Pain et al., 2000). This has the drawback of increased complexity, and increased dark noise. A coated probe has an advantage in that the Cerenkov light coming from outside the probe cannot enter it. To determine the signal not originating from the scintillating tip, the following experiment was performed. The probe was lowered into a homogeneous solution of H215O (50 MBq/mL) to various depths: 2 mm (tip just covered), 7 mm, and 12 mm. Although lowering the probe from position a to b increased the count rate by 34.0%, there was only a 3.5% further increase from position b to c. The first increase is easily explained by a partial volume effect. If Cerenkov radiation is created inside the fiber, the signal should increase linearly with depth. However, the small second increase demonstrates that this is unlikely and that potential Cerenkov radiation produced in the fiber is therefore negligible.
After each experiment, position c was also used to cross-calibrate the beta-probe with the coincidence counter used to measure the arterial input curve. For this purpose, the shunt tubing was additionally filled with the same H215O solution and counted with the coincidence counter. For data analysis, all data were background corrected, converted to kBq/mL, and decay corrected to the time point of injection.
The probe was inserted in the brain using a stereotactic frame (David Kopf Instruments, Tujunga, CA, U.S.A.). The skull was exposed and a craniotomy was performed using a dental drill. The dura was carefully incised at the insertion position, which was (according to bregma) 2 mm posterior and 6 mm lateral for the barrel cortex and 3 mm posterior and 3 mm lateral for the combined thalamic/cortical penetrations. This position was adjusted to avoid large superficial blood vessels. The probe was carefully lowered to a depth of 1.4 mm for cortical and 6 mm for thalamic recordings. Only one probe penetration was performed per animal. The count rate was stored on a personal computer using a bin width of 1 second.
Experimental protocols
After each H215O injection, 180 seconds of data were recorded. Injections were spaced at least 10 minutes apart to let the activity decay to background level. Each experimental block started under baseline conditions (barrel cortex, n = 8). Then, measurements were performed during electrical stimulation of the trigeminal nerve (in five animals only). The final measurements were acquired starting 10 minutes after administration of acetazolamide. Thalamic experiments were performed in three animals. After measurements in the cortex at baseline, the probe was advanced to the thalamus leaving the surface position unchanged. Acetazolamide was then injected and additional thalamic measurements were taken. The last measurements were acquired shortly after the probe was retracted to the original cortical depth. Three consecutive injections were made in each condition.
Model
The basis of the calculation of the CBF measurements was the one-tissue compartment model including a partition coefficient for H215O. The change of the radioactivity concentration in tissue Ct is then defined by the following differential equation:

where Ca is the arterial tracer concentration and p is the tissue partition coefficient (that fraction of tissue that is permeable for H215O). In this configuration, Ct is the concentration of H215O in 1 mL of brain and it is assumed that H215O immediately reaches a homogeneous concentration in permeable space and no division into a vascular and a tissue compartment is necessary. The analytical solution of Eq. 1 is

where ⊗ signifies mathematical convolution. In a K1, k2 notation, Eq. 2 becomes

where K1 = CBF and k2 = K1/p.
Equation 3 was fitted to the data using least squares fitting (Marquardt algorithm) implemented in the software PMOD (http://www.pmod.com; Mikolajczyk et al., 1998). Before data analysis, tissue time-activity curves and arterial input curves were corrected for physical decay.
Statistical analysis
The means of K1, k2, and p at baseline and after acetazolamide challenge were statistically compared using the signed rank test. Bland-Altman analysis was used to assess the reproducibility (Bland and Altman, 1986). In this method, the standard deviation of the difference of consecutive experiments (in this study, experiment 2 and 3 of each block) is a measure for the reproducibility. The differences were expressed as percentage of the mean of the two measurements. A total of 21 differences were evaluated. Only the cortical experiments were included in this analysis.
RESULTS
The high reproducibility of the shape of the input curves is demonstrated in Figure 1. The peak, which was reached at 50 seconds was followed by a rapid decline, lasting until 60 seconds. The further time-course was flat due to recirculating H215O.
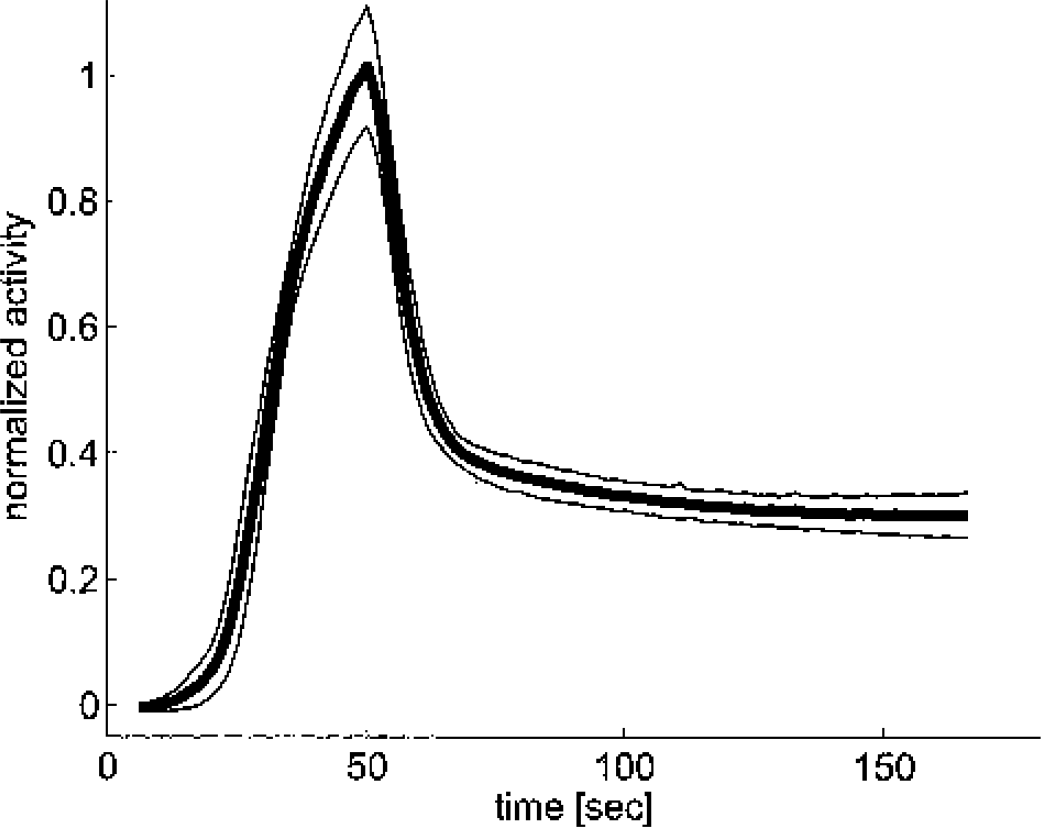
Decay-corrected arterial input functions measured in the arteriovenous shunt. The graph displays mean ± SD of all injections performed in this study. Before averaging, all curves were normalized to the integrated activity between 0 and 160 seconds and time-shifted. The peak of the resulting average curve was then scaled to 1.
A typical blood and tissue curve and the model fit after injection of acetazolamide are shown in Fig. 2. The absence of any bias in the residuals demonstrates the goodness-of-fit.
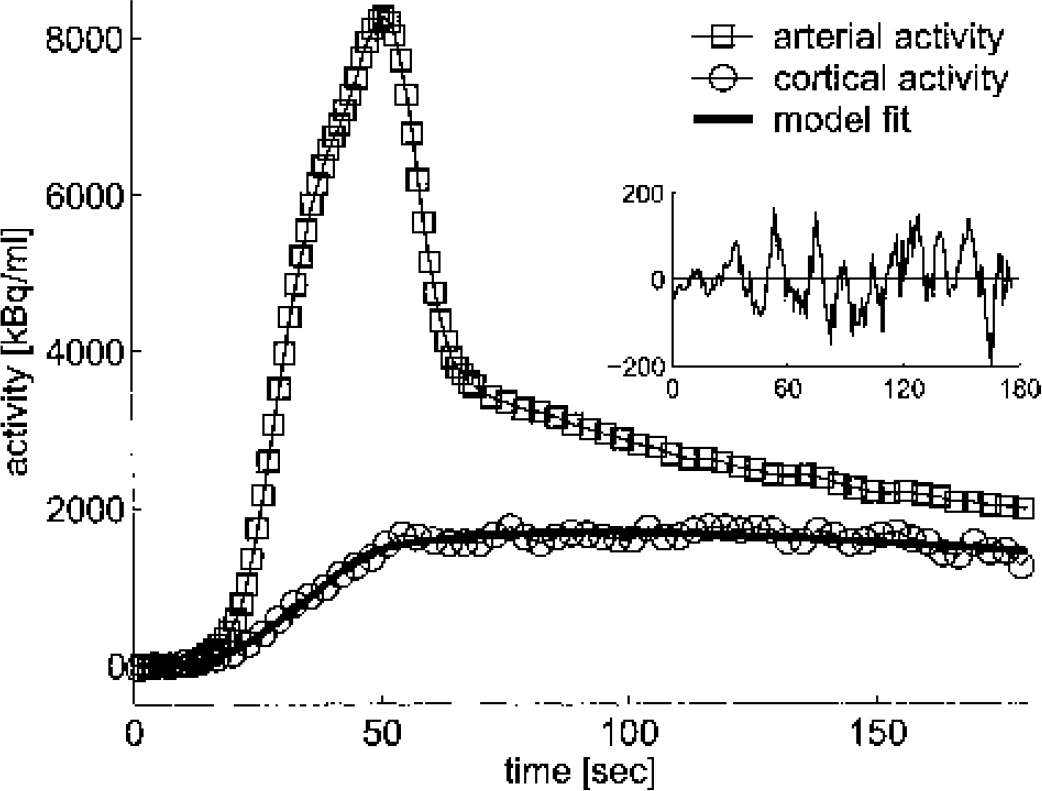
A typical example of a tissue time–activity curve, an arterial input curve, and the model fit of an experiment after administration of acetazolamide. All data are corrected for 15O decay. The insert represents the residuals. In this experiment, the values of K1 and k2 were 0.48 mL · min−1 · mL−1 and 0.71 min−1. Note that the ratio of counts in tissue and blood at 180 seconds is 0.89, which is higher than the equilibrium value of 0.68 because equilibrium is not yet reached at 180 seconds. Exp, experiment.
The result of the model fitting is summarized in Table 1. In each animal there was a marked and reproducible increase of K1 and k2 after acetazolamide challenge. The percentage increase (mean ± SD) from baseline was 66 ± 27 (T = 0; P < 0.01) and 72 ± 22 (T = 0; P < 0.01) for K1 and k2, respectively. All five animals in which trigeminal stimulation was performed displayed a pronounced increase of K1 and k2 in the corresponding barrel cortex. Because of the small sample size (n = 5), no statistical analysis was performed. The percentage increase from baseline was 47 ± 29 for K1 and 59 ± 44 for k2. No significant change in the partition coefficient p was noticed between the different conditions. In the eight baseline experiments, p in cortex was 0.64 ± 0.05. In the three animals with a thalamic measurement, p in thalamus was higher than in cortex (18%, 13%, and 8% higher than in cortex).
Summarized results of the model fitting
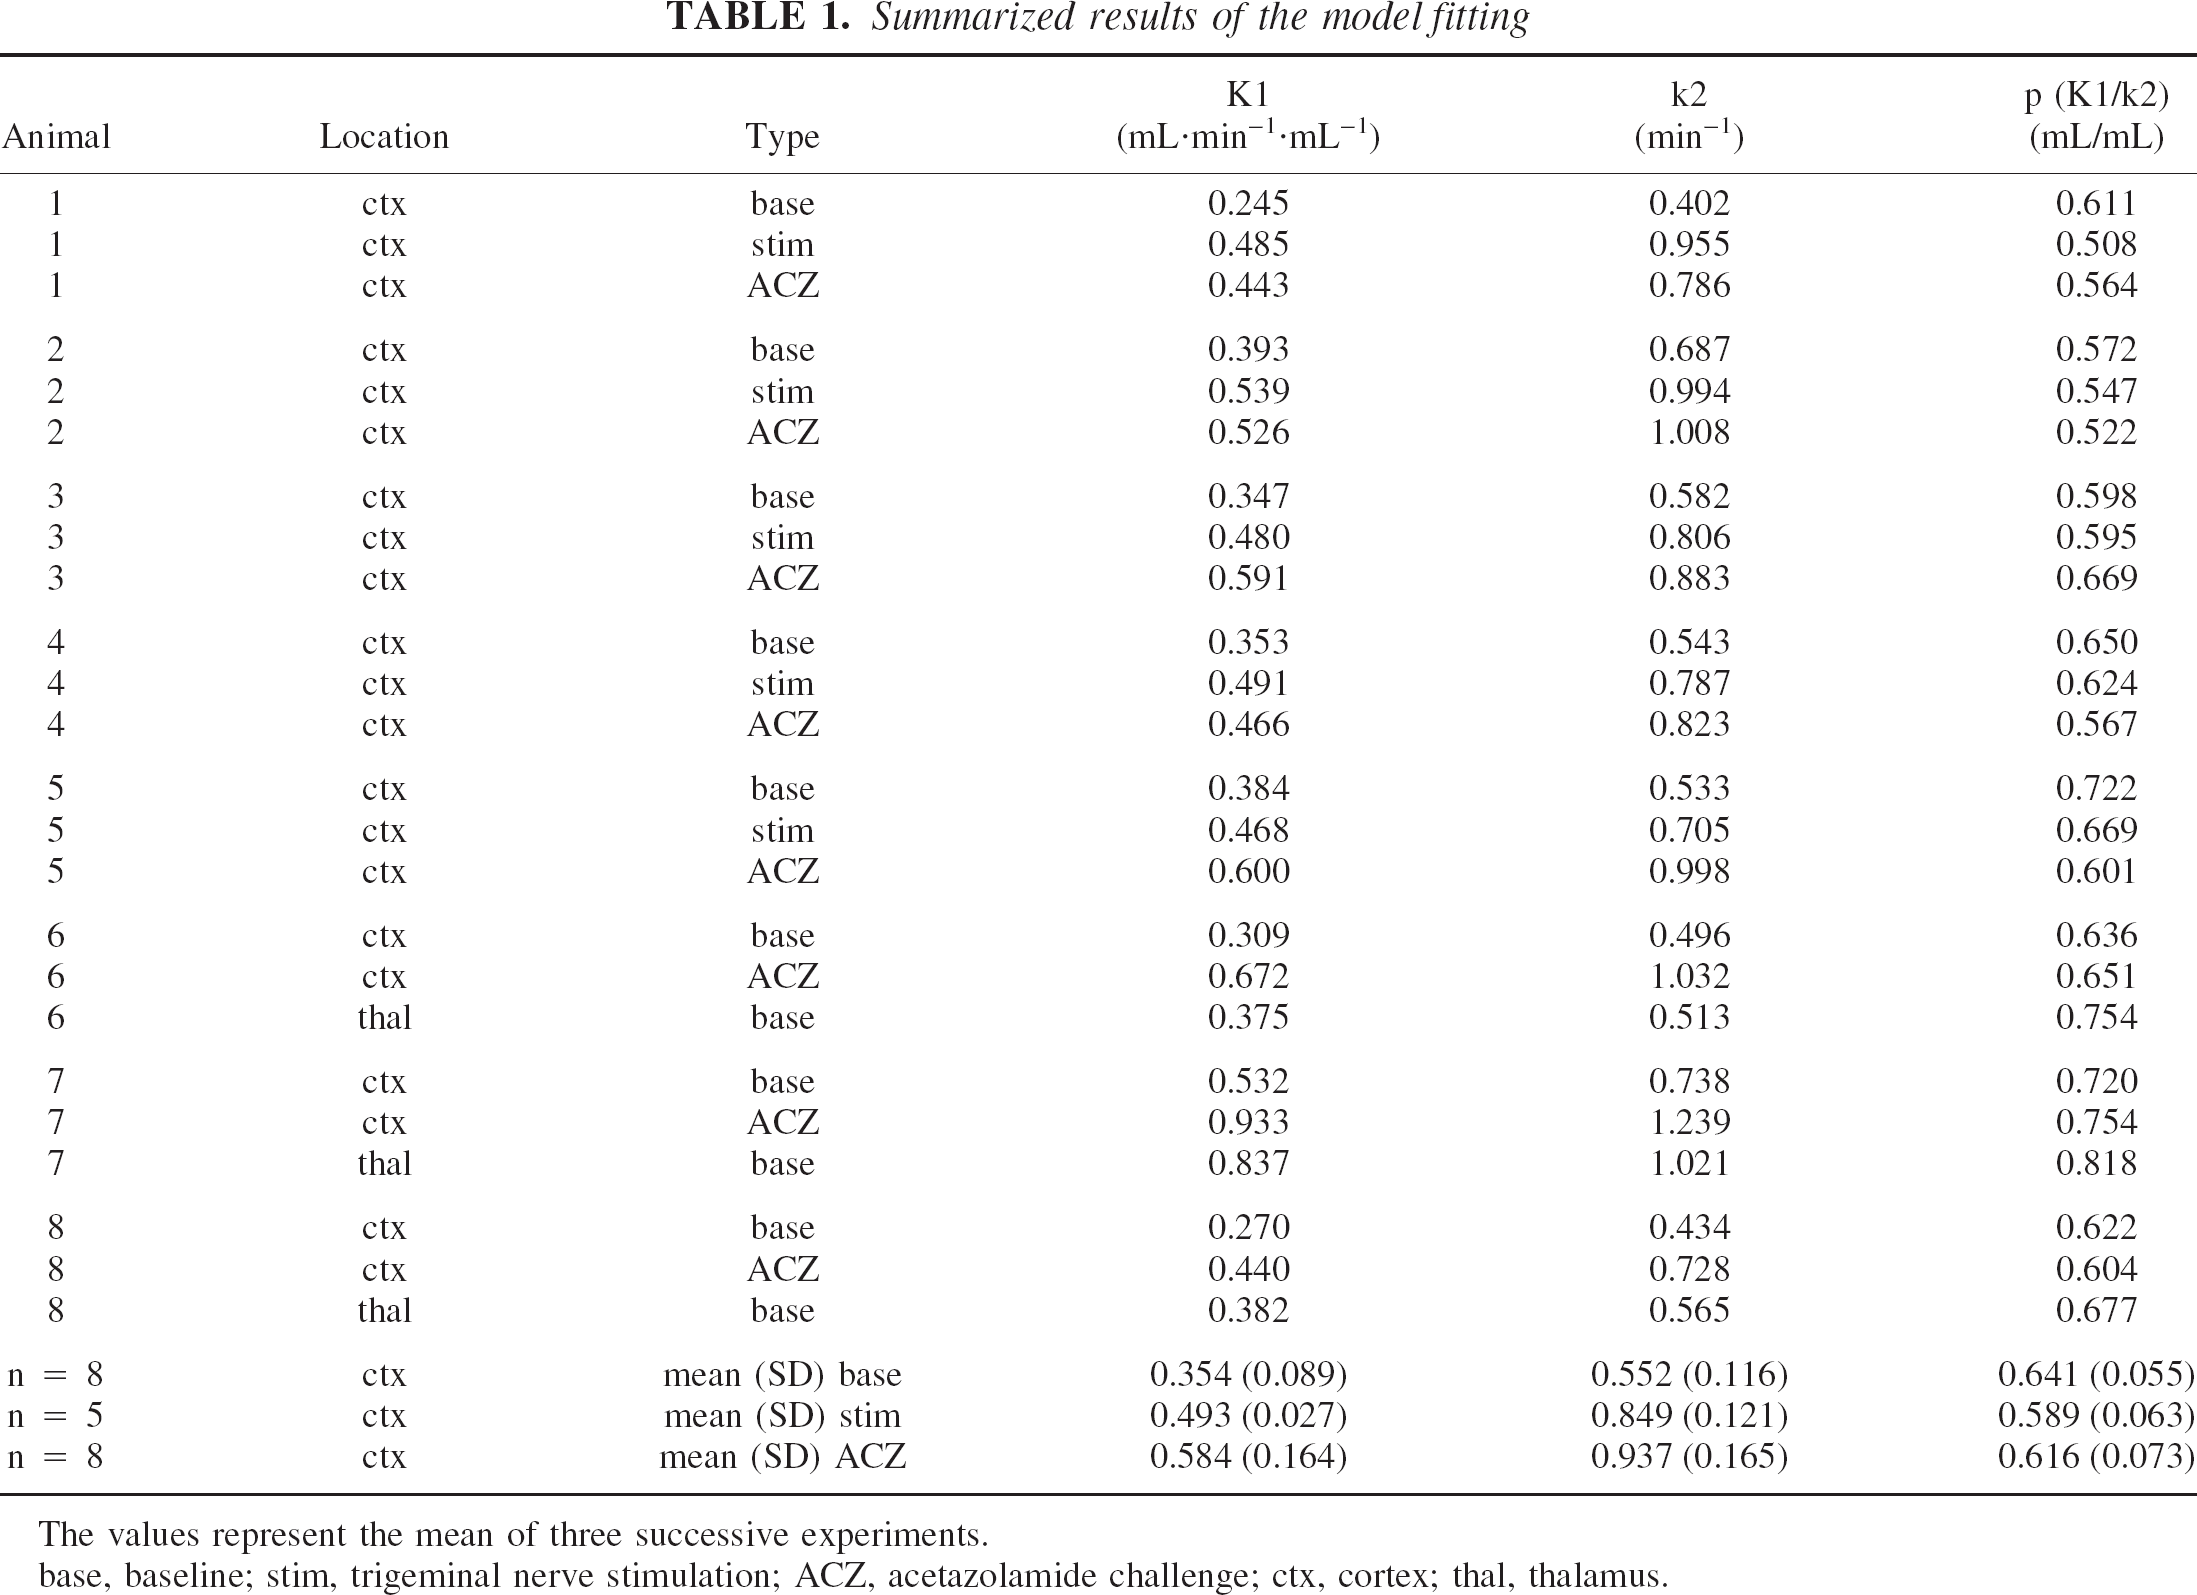
The values represent the mean of three successive experiments.
base, baseline; stim, trigeminal nerve stimulation; ACZ, acetazolamide challenge; ctx, cortex; thal, thalamus.
The Bland-Altman plots of the reproducibility are summarized in Fig. 3. The highest reproducibility (lowest standard deviation between successive measurements 2 and 3) was achieved for p, followed by K1 and k2. For all parameters, all except one data point were contained in the range mean ± 2 SD.
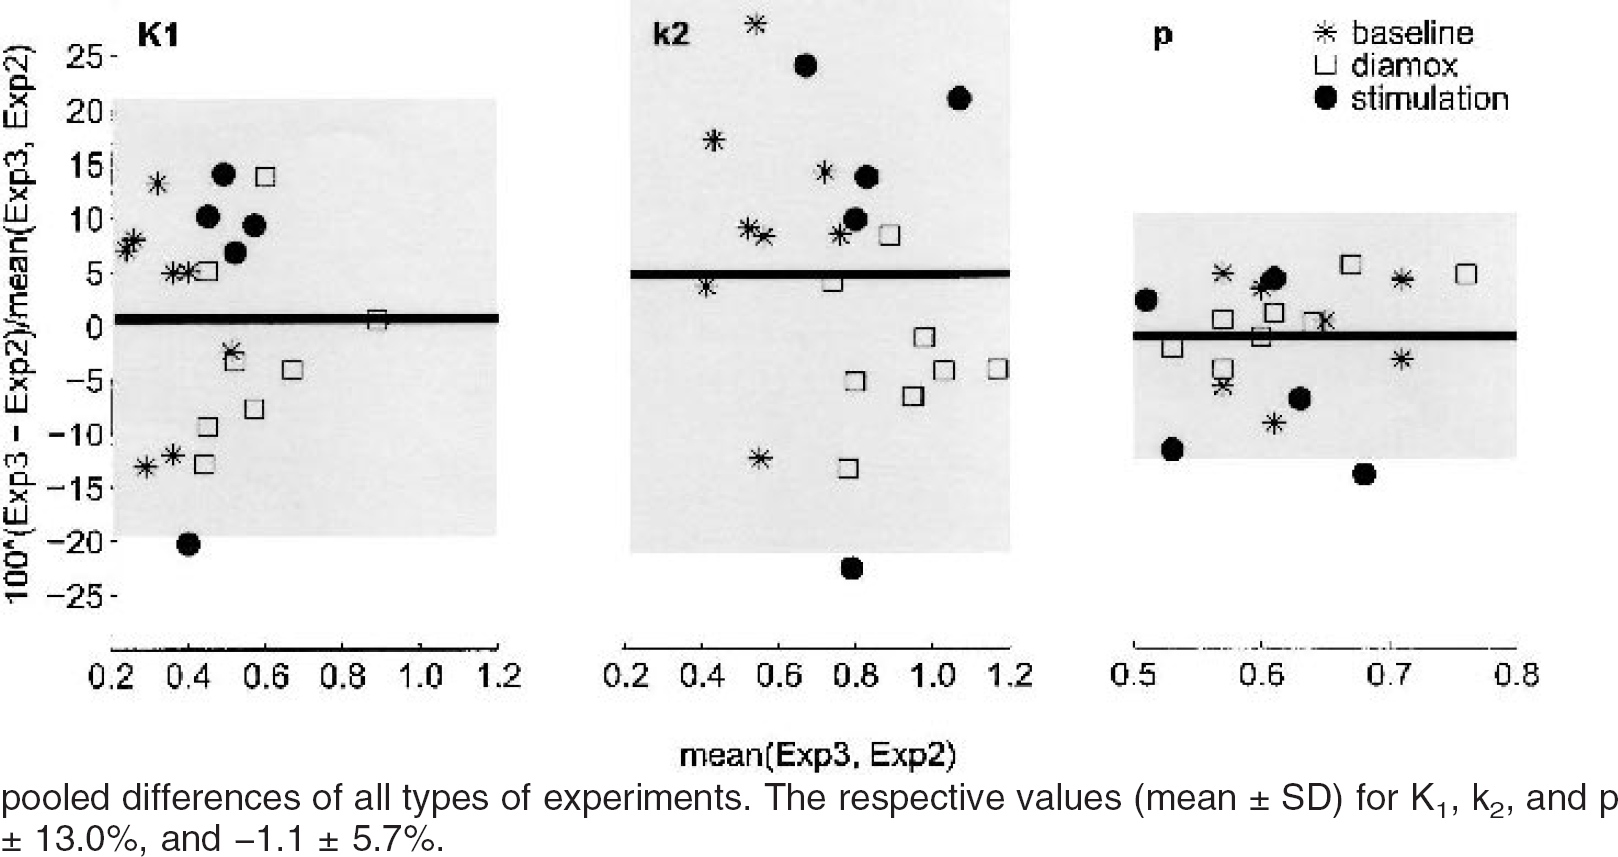
Bland-Altman plot of the reproducibility of K1, k2, and p. The analysis included eight animals for baseline and acetazolamide and five animals for the trigeminal stimulation. In each experimental block (i.e., baseline, acetazolamide, and trigeminal nerve stimulation) there were three consecutive injections 10 minutes apart. The important parameter for reproducibility is the standard deviation of the difference between the second and third experiments (experiment 3 − experiment 2), which is indicated as percentage of the mean. The middle line represents the mean difference; the top and bottom of the gray rectangle are mean ± 2 SD of the pooled differences of all types of experiments. The respective values (mean ± SD) for K1, k2, and p respectively were 0.6 ± 10.1%, 4.7 ± 13.0%, and −1.1 ± 5.7%.
DISCUSSION
The purpose of this work was to validate the quantification of CBF measurements using a beta-probe and H215O. The validation is focused on three major aspects: (1) the magnitude of the CBF values; (2) the response to stimulation; and (3) the reproducibility.
Magnitude of K1, k2, and p
The K1 values seem to systematically underestimate the true CBF. Compared with 14C iodoantipyrine autoradiography data published by Nakao et al. (2001), who used a similar anesthetic protocol, our values in the barrel cortex are approximately 40% lower (0.35 vs. 0.6 min−1). This discrepancy is most likely due to an underestimation of the true cortical H215O concentration because of partial volume effects. The maximum free path length of a positron emitted from 15O in water is 8.2 mm and the most probable free path length is approximately 2.7 mm, indicating that most of the signal picked up by the beta-probe originates from a sphere that is approximately 5 mm in diameter. During calibration, this sphere contains a homogeneous radioactivity concentration. Because the rat cortex is approximately 2 mm thick, the volume contributing to signal in a probe positioned in the cortex is heterogeneous and includes not only gray matter, but also white matter and air above the cortex. This leads to an underestimation of the true cortical H215O concentration and, consecutively, K1. This underestimation would also explain the low value of p (K1/k2, 0.64 ± 0.055 at baseline). One would expect a value in the order of 0.95 mL/mL (Ginsberg et al., 1982). This reasoning is supported by the result that K1 and p are higher in the thalamus than in the cortex. There the gray matter volume surrounding the probe is larger, leading to smaller partial volume effects. The situation is considerably more favorable for 11C and 18F with maximum free path lengths of 4.1 and 2.4 mm.
While K1 describes the delivery of H215O, k2 is determined by the washout. The baseline value (0.55 ± 0.11 min−1) is closer to the autoradiographically determined CBF values reported by Nakao et al. (2001). Considering the relationship CBF = k2 p, one could use k2 multiplied by an estimated p as an indicator of CBF. If one assumes a p value of 0.95, the baseline CBF would be 0.52 mL · min−1 · mL−1. This value probably still underestimates true CBF, because k2 is also affected by the partial volume effects (tissue heterogeneity), although to a lesser degree than K1 (Blomqvist et al., 1995; Herholz and Patlak, 1987). In our view, there is no simple way to correct for the partial volume effects. The problem is the heterogeneity in the volume contributing to signal in the probe. The different time course of the counts in the compartments of this volume render a simple correction by a constant factor inaccurate.
Response of K1 and k2 to stimulation
The increase of K1 (43%) in the barrel cortex during trigeminal stimulation is in line with the results of Nielsen and Lauritzen (2001). Using laser-Doppler flowmetry in the chloralose-anesthetized rat, they found an approximately 40% change during trigeminal nerve stimulation at 2 Hz. These values are somewhat higher than the 28% increase reported by Nakao et al. (2001). The discrepancy can be explained by the different stimulation methods (mechanical whisker stimulation vs. electrical trigeminal nerve stimulation). The mean of k2 increased from 0.54 to 0.84 min−1, corresponding to 54%.
All animals also displayed a marked increase of K1 and k2 after acetazolamide challenge; the increase of the mean was 65% and 70%, respectively.
Reproducibility
The Bland-Altman plots demonstrate that the standard deviation of two successive measurements is in the order 10%, 13%, and 6% for K1, k2, and p, respectively. A direct comparison with the hydrogen-clearance method, the only other quantitative method allowing serial measurements in the same animal, is difficult. However, it is in line with human (Carroll et al., 2002; Matthew et al., 1993) and monkey (Iida et al., 2000) H215O PET measurements, for which the reproducibility is in the order of 10%.
The data suggest that K1 and k2 are reasonable measures of CBF. Compared with k2, K1 is somewhat more reproducible but underestimates true CBF to a higher degree.
Comparison with alternative methods
In small animals, probably the most accurate quantitative method for CBF measurement is 14C-iodoantipyrine autoradiography (Nakao et al., 2001; Ohno et al., 1979; Sakurada et al., 1978). This method also has the highest spatial resolution. The obvious disadvantage is the need to kill the animals after one experiment, which renders serial experiments in the same animal impossible. Other possibilities that allow serial measurements are the methods based on laser-Doppler flowmetry (Dirnagl et al., 1989; Skarphedinsson et al., 1988) and hydrogen clearance (Haining et al., 1968; Moskalenko et al., 1996; Moskalenko Yu et al., 1995; von Kummer and Herold, 1986; von Kummer et al., 1986). Laser-Doppler flowmetry has become very popular, one reason being that brain tissue is not injured. However, it is not a quantitative method. The hydrogen clearance method yields theoretically quantitative CBF values with high temporal, but relatively low spatial resolution, as does the beta-probe. Another method is the use of the newly introduced animal PET scanners. However, with the present systems the temporal resolution seems to be too low to allow CBF measurements with H215O, and studies using other potential PET flow tracers have not been published.
Applications of beta-probes include neuropharmacologic experiments, blocking and displacing experiments with receptor ligands, or the measurement of glucose metabolism using 18fluorodeoxyglucose under different physiologic conditions and pharmacological interventions. In such experiments, the additional measurement of CBF may contribute important information. For instance, one important parameter of radioligands is the first-pass extraction fraction (EF). In compartmental models the first parameter K1 describes transport of tracer from blood into tissue; it is determined by the relationship K1 = CBF EF. Thus, EF can be calculated from K1 and CBF. An important advantage of H215O is the short physical half-life of 15O of 122 seconds, meaning that experiments can be performed at 10-minute intervals. A disadvantage of the presented method is its complexity and the requirement of a cyclotron. However, in centers where the necessary equipment is available, it offers an elegant technique for CBF measurements, especially in situations where the beta-probe is used for other experiments that additionally require the knowledge of CBF. Another disadvantage is the relatively large diameter of the beta-probe (0.25 mm). It is possible that new, more sensitive scintillator materials may allow a reduction in this diameter. Furthermore, because of the high radioactivity concentrations used, radiation safety issues have to be considered. In the present study, movable lead shielding was used.
In summary, the beta-probe and H215O allow quantitative, reproducible, and serial measurements of CBF, although true flow values in cortex are systematically underestimated. The reproducibility is comparable to human H215O PET.