
Abstract
Most human manual grip movements can be divided into power gripping and precision gripping, but central neural control during these tasks remains unclear. We investigated activation of the whole brain to analyze how simple hand movements are performed. The cerebral blood flow of seven healthy right-handed volunteers was measured by H215O positron emission tomography during right grip tasks without gripping a target object. Auditory-cued, repetitive power grips (i.e., fist making) and repetitive precision grips (i.e., opposition of the tip of the index finger and the tip of the thumb) were performed at 1.26 Hz. The areas activated during both tasks were the left primary sensorimotor cortex, caudal portion of the dorsal premotor, caudal portion of the supplementary motor area, cingulate motor area, and the right spinocerebellum and intermediate region of the cerebrocerebellum in comparison with the rest state. The analysis of power grip-precision grip tasks showed the activated peaks in the upper portion of the left sensorimotor area and right cerebellar vermis, but these areas were activated in both the tasks [(power grip-rest) and (precision grip-rest)] with uncorrected P < 0.001 as the statistical criterion. With P < 0.05 corrected as the statistical criterion, the results showed no significant activated peaks in regional cerebral blood flow. Our findings indicate no difference in brain activation between the acts of power grip and precision grip without a target object.
Keywords
Human grasping actions can be roughly classified into power grip actions and precision grip actions (Napier, 1956). Power grips usually involve all five digits, and all of the strength is directed towards the palm to allow a firm grasp on an object in the hand. Precision grips, on the other hand, are confined to the pulps of the digits to allow fine control during manipulation of an object. Since observations of pyramidotomized Rhesus monkeys showed that they were able to grasp an object with a power grip but unable to perform a precision grip (Lawrence and Kuypers, 1968), it has been suggested that different central neural networks participate in the control of these grip movements (Muir and Lemon, 1983).
Using functional magnetic resonance imaging technique (fMRI), Ehrsson et al. (2000) recently demonstrated differences between cortical activity when squeezing an object in a power grip and a precision grip. They found that activity in the primary sensory and motor cortices contralateral to the operating hand was higher during the power grip than during the precision grip. In contrast, activity in the ipsilateral ventral premotor area, rostral cingulate motor area, and posterior parietal and prefrontal cortices was stronger during the precision grip than during the power grip. They therefore concluded that these grips require different sources of cortical output to produce the finger forces. However, several factors other than the act of gripping itself have been responsible for their findings. The first is the difference in size and shape of the object grasped: a 40-mm diameter cylindrical plastic tube was used for the power grip, and a small flat object was used for the precision grip. The second is the magnitude of the target force: 20 N for the power grip and 2 N for the precision grip. A freely movable small object that requires finer force control for the precision grip task definitely demanded that the subjects exercise a more complex level of motor control, which may have been reflected in the extent and magnitude of cortical activation. Thus the grip actions themselves may need to be examined to eliminate these effects. Another limitation of their study was that they only examined cortical activity. It is now well known that structures in the subcortical system, such as the thalamus, basal ganglia, and cerebellum, are greatly involved in voluntary motor actions, including gripping actions (Faillenot et al., 1997; Kinoshita et al., 2000; Mai et al., 1988).
We therefore used H215O positron emission tomography (PET) to investigate differences in whole brain activity while subjects performed power grip and precision grip movements without actually grasping objects.
MATERIALS AND METHODS
Seven young males (23 to 24 years old) were enrolled in the study. All subjects gave written informed consent before participating, and the research protocol was approved by the Regional Ethics Committee of Osaka University Graduate School of Medicine. Written consent was obtained according to the Declaration of Helsinki. All of the subjects had normal results on a neurologic exam and had no significant active or previous neurologic disease. The Edinburgh Inventory Test showed all of the subjects to be right-handed (Oldfield, 1971).
Experimental design
Two grip tasks, a precision grip task, in which the tip of the right thumb and the tip of the index finger were repetitively lightly opposed and released, and a power grip task, in which a weak fist was repetitively made with the right hand and released, were used as motor tasks in this study. A resting state was included as a control. Four replications of the series of tasks were performed in a pseudorandom and balanced order. A 1.26 Hz metronome tone was used as an auditory cue to pace the grip action (Calautti et al., 2001a, 2001b). The subjects kept their eyes open during the experiment and did not look at their hands. Each task lasted a total of 1.5 minutes. All subjects were trained to perform the tasks before the experiment. Monitoring of the finger movements by scanning with a video camera showed that all subjects performed the task adequately in all runs.
Data acquisition
Subjects were scanned while lying supine with their eyes open in a dimly lighted quiet room. Their head was gently immobilized in a dedicated head rest. Head position was aligned transaxially to the orbitomeatal line with a laser beam. The regional distribution of radioactivity was measured with a Headtome V (Shimadzu Corp., Kyoto, Japan) scanner PET camera with full-volume acquisition (3D-mode), allowing reconstruction of 63 planes (thickness, 3.17 mm; axial field of view, 200 mm; effective resolution, approximately 4.2 mm FWHM in all directions). Transmission scans were obtained with a 68Ge-68Ga line source before emission scans (Kinoshita et al., 2000). The duration of each scan was 90 seconds. Approximately 259 MBq of H215O was administered as a slow bolus via the left antecubital vein by means of an automated infusion pump. Each experimental task was started approximately 15 seconds before data acquisition and continued until scan completion (Nishimura et al., 1999; Yasuno et al., 2000). This process was repeated for each of the 12 scans. The interval between injections was 8 minutes.
Data analysis
All calculations and image transformations were performed on Windows workstations. First, the scans of each subject were realigned with each other. Statistical Parametric Mapping (SPM) software (SPM99, Wellcome Department of Cognitive Neurology, London, UK) implemented in the MATLAB environment was used for subsequent data analyses (Kinoshita et al., 2000; Nishimura et al., 1999; Yasuno et al., 2000). The images were nonlinearly transformed into standard space (Montreal Neurological Institute MRI template) (Collins et al., 1994) and smoothed using a 12-mm gaussian filter. Because the images were scaled to an overall cerebral blood flow (CBF) grand mean of 50 mL/100g/minute, we refer to adjusted regional CBF (rCBF) in this analysis. We used a gray matter threshold of 80% of the whole brain mean, and covariates were centered before inclusion in the design matrix. An ANCOVA was performed on a pixel-by-pixel basis with global activity as a confounding covariate. The results for the t statistic [SPM (t)] were then transformed into a normal standard distribution [SPM (Z)] and set to Z > 3.09. The activated locations were evaluated using Talairach's atlas (Talairach and Tournoux, 1988), taking into consideration the difference of shapes from the MNI space (http://www.mrc-cbu.cam.ac.uk/Imaging/mnispace.html).
RESULTS
Power grip versus rest and precision grip versus rest
Table 1 shows foci of significant rCBF increase for the power grip and precision grip conditions compared with the rest condition, and regions of significant rCBF increase in these comparisons are shown in Fig. 1. The left primary sensorimotor cortex that includes the caudal portion of the dorsal premotor area and the caudal portion of the supplementary motor area were activated during both tasks. The cingulate motor area and the right spinocerebellum and intermediate region of the cerebrocerebellum were also shown to be activated.
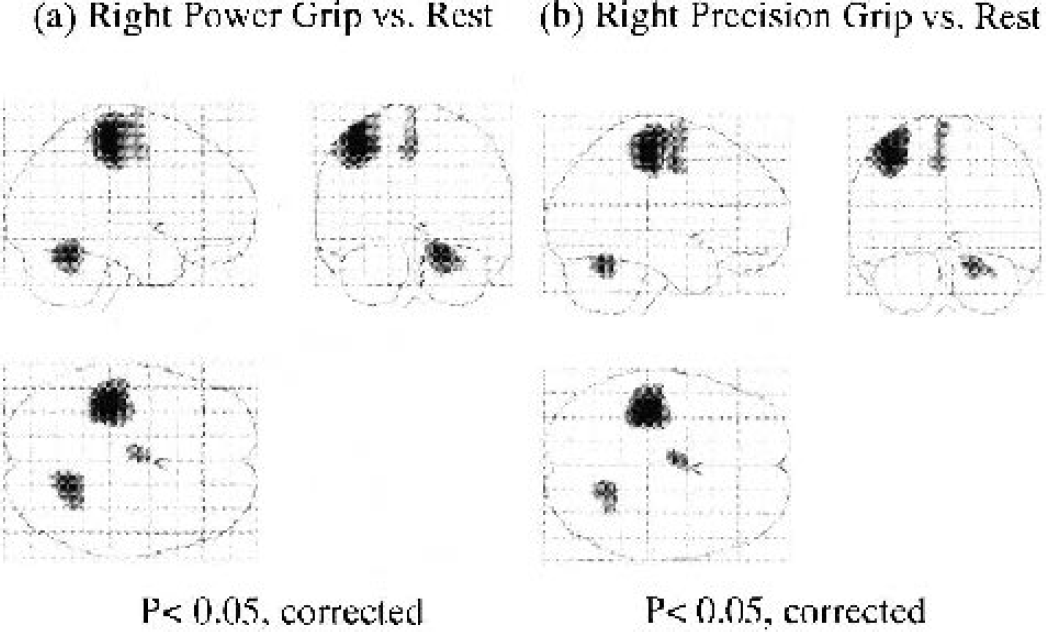
Data were obtained with SPM99 software (P < 0.05, corrected) and are shown here according to the classic Talairach's “glass brain” display mode. The neurologic convention was used (i.e., right side of brain is shown on the right). Right power grip versus rest activation patterns (A). Right precision grip versus rest activation patterns (B). The size of the cluster in activated regions was clearly larger for the power grip condition than the precision grip condition; however, there was no significant difference in activation pattern during these tasks.
Statistical activation peaks during right hand grip movements
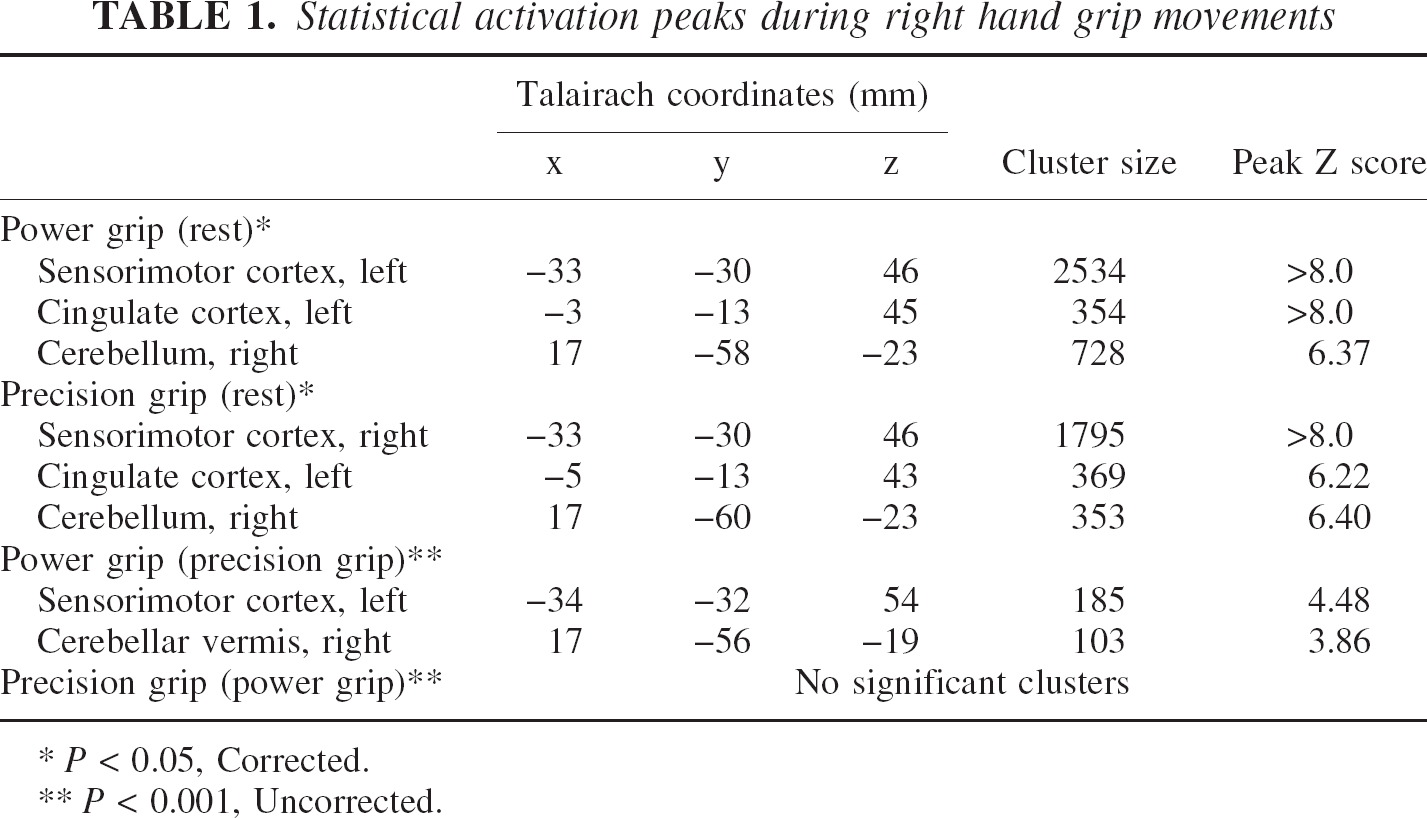
P < 0.05, Corrected.
P < 0.001, Uncorrected.
Power grip versus precision grip
The analysis of the power grip-precision grip revealed no difference in rCBF in any portion of the cortical or subcortical structures with corrected P < 0.05 as the statistical criterion. However, the size of the cluster in all activated regions was larger for the power grip condition than the precision grip condition [(power grip-rest) and (precision grip-rest)] (Table 1). We then performed statistical comparisons with P < 0.001 uncorrected as the statistical criterion. The results showed a higher peak rCBF level in the upper portion of the left sensorimotor area and right cerebellar vermis for the power grip than the precision grip (Fig. 2).
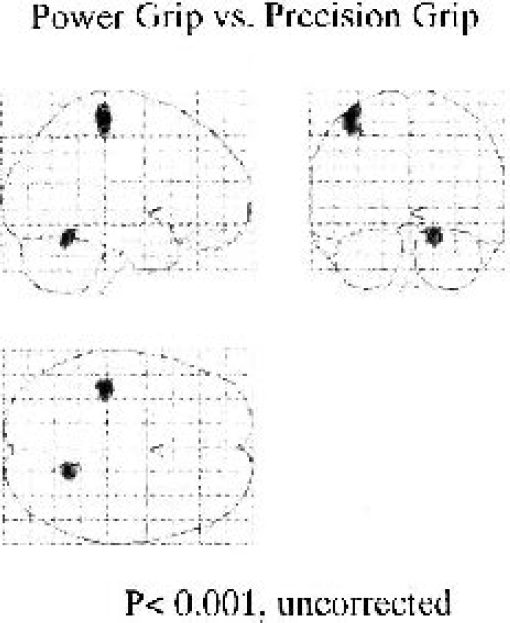
Right power grip: precision grip activation patterns (P < 0.001, uncorrected). Data were obtained with SPM99 software and are shown here according to the classic Talairach's “glass brain” display mode. This analysis revealed a subtle difference in activation in the left sensorimotor area and the right cerebellar vermis, which were activated during both tasks.
Precision grip versus power grip
The analysis of the precision grip-power grip revealed that there were no significant differences in activation with corrected P < 0.05 and uncorrected P < 0.001 as the statistical criteria.
DISCUSSION
Anatomic studies and lesion experiments in primates have suggested that the primary motor cortex plays a special role in producing individuated movement of the digits. Muir and Lemon used electromyography (EMG) and demonstrated that different tasks determine which neurons in the primary motor cortex are used to control a particular muscle. They examined the activity of individual corticomotoneuronal (CM) cells in trained monkeys during two different voluntary finger tasks, a power grip and a precision grip, with the monkeys gripping an actual object. During precision grips consisting of squeezing a small springloaded lever, neuronal activity occurred in CM cells, and EMG activity occurred in the target muscle. However, during power grip of a soft cylinder, there was hardly any activity in the neurons despite a greater amount of EMG activity in the muscle. This finding suggested participation of different central neural networks in the control of these grip movements (Muir and Lemon, 1983).
Using a functional magnetic resonance imaging technique (fMRI), Ehrsson et al. (2000) recently demonstrated differences in cortical activity when squeezing an object with a power grip and a precision grip. They found that the activity in primary sensory and motor cortices contralateral to the operating hand was higher during the power grip than the precision grip. In contrast, the activity in the ipsilateral ventral premotor area, rostral cingulate motor area, and posterior parietal and prefrontal cortices was stronger during the precision grip than the power grip.
Two factors other than the act of gripping itself may have contributed to the outcome in their study. One is a difference in the size and shape of the object grasped, and the other is the magnitude of the target force. Ehrsson et al. (2000) studied a target force of 20 N for the power grip and 2 N for the precision grip. It is well known that the force of the hand grip is associated with central control. Dettmers et al. (1995) used H215O PET and demonstrated a significant correlation between brain activation in the primary sensorimotor area and the force of right index finger flexion. Cramer et al. (2002) used fMRI and demonstrated the relationship between volume of the primary sensorimotor area activated and the force for the power grip while grasping an object. We focused upon the hand gripping movements themselves without a target, and the degree of the hand force generation was not measured using force measurement equipment as in the previously mentioned studies (Cramer et al., 2002; Dettmers et al., 1995; Ehrsson et al., 2000). In the present study, the gripping movements without a target object were weakly performed to repeat making a fist or tapping.
Colebatch et al. (1991), on the other hand, used inhaled 15O-labeled CO2 PET to investigate cerebral blood flow during a power grip and precision grip without grasping an actual object, and the results showed no significant difference in the increase in the primary sensorimotor area during the power grip and precision grip. They did not use the SPM Software that is currently widely available for human brain research, and there was no mention of activation volume in their paper.
Calautti et al. (2001b) demonstrated the effect of age on brain activation during the precision gripping. Significant differences between old age (mean age, 60 years) and young age subjects (mean age, 24 years, with this latter age group being also the subjects of our study) were found, showing that the superior frontal cortex was overactivated in the old subjects.
The present study showed that the cluster size of the activated primary sensorimotor cortex in the power grip task was greater than in the precision grip task in comparison with the rest state [(power grip-rest) and (precision grip-rest)]. The width of the activated primary sensorimotor area with the whole finger movement was attributed to a great number of muscle groups involved in the movements of all fingers and to increased muscular exertion for the opposition. The analysis of power-precision grip with P < 0.05 corrected as the statistical criterion showed no significant clusters of activation in the cereberum. When P < 0.001 uncorrected was used as the statistical criterion, a cluster of activation was found in the upper portion of the primary sensorimotor area (Fig. 2) that was activated in the both the analysis of the precision gripping-rest and of the power gripping-rest. This result indicates that there is no significant difference in activation pattern of cerebral hemisphere between power grip and precision grip when an actual object is not grasped.
During both grip tasks, the subjects rhythmically produced grip force while a metronome paced force production and a tactile signal provided neural feedback to repeat the force. Thus auditory and somatosensory information might be used to guide the motor acts. However, in this study, the neural system could not be completely explained because the PET system failed to record increased activity specifically related to tactile or auditory triggering of movements due to its temporal resolution, as suggested in previous papers (Blakemore et al., 1998; Jahanshahi et al., 1995; Naito et al., 2000). The subjects may receive stronger tactile stimuli during the power grip by the whole fingers than during the precision grip by the two fingers. This difference might affect the size of the activated areas involving the two tasks (Ehrsson et al., 2000). Sadato et al. (1996) reported that the activated motor areas were related to the auditory-cued repetition rate of the precision grip. They found that there was a significant difference in the activation pattern between the primary sensorimotor area and the supplementary motor area when the precision griping was performed at a very low pace or at a very fast rate. It might be possible that the supplementary motor area plays an important role in the activation of the primary sensory motor area at the low pace of 1.26 Hz, as in the present study.
The importance of cerebellar function in prehension tasks has long been recognized in patients with cerebellar lesions who are unable to maintain constant isometric grip force (Holmes, 1917), fast and smooth grip force production (Holmes, 1917; Mai et al., 1988; Muller et al., 1994), or anticipatory grip force production (Muller et al., 1994). We found a distinct increase in rCBF in the posterior and intermediate portions of the ipsilateral cerebellum, that is, hemisphere, dentatus, and vermis, during both gripping tasks. Previous rCBF studies have also shown strong involvement of the ipsilateral cerebellum in simple finger movement tasks (Dettmers et al., 1995; Sadato et al., 1996) and reaching and grasping movements (Faillenot et al., 1997; Grafton et al., 1996; Rizzolatti et al., 1996). Sadato et al. (1996) reported that the degree of cerebellar activation is associated with the frequency of the precise grip. Jueptner and Weiller (1998) indicated the importance of the neocerebellum, including the posterior lobe, in the sensorimotor information processing during voluntary hand actions. However, no studies had ever used whole brain H215O PET to investigate differences in cerebellar activation between a power grip and a precise grip task without grasping a target.
Comparison of the brain activation pattern in the cerebellum during the power grip and precision grip revealed that the cluster of activation during the power grip was twice as large as during the precision grip [(power grip-rest) and (precision grip-rest)]. The analysis of power-precision grip with P < 0.05 corrected as the statistical criterion showed no significant cluster of hyperactivation in the area of cerebellum. As shown in Fig. 2, the analysis of power-precision grip with uncorrected P < 0.001 as the statistical criterion showed a cluster of activation in the right vermis that was activated both during the power grip and the precision grip [(power grip-rest) and (precision grip-rest)].
Dettmers et al. (1995) used H215O PET and demonstrated that the cerebellar vermis was activated during pressing of a Morse key with the right index finger. Colebatch et al. (1991) studied rCBF during upper limb movements in an earlier PET system and reported that the activation in the cerebellar vermis during fist-making power grips was almost as great as during precision finger grips without grasping a target. Their findings are consistent with our own.
In conclusion, the findings of the present study indicate that sensorimotor actions of the fingers involved in the power grip and precision grip without a target object are organized in the same cortical and subcortical areas.
Footnotes
Acknowledgment
The authors thank Mr. Y. Nakamura and the staff of the Department of Nuclear Medicine and the Cyclotron staff of Osaka University Medical School Hospital for their technical support in performing the studies, as well as Ms M. Sudo and K. Tsunoda for their administrative assistance.