
Abstract
To study the effect of the repetition rate of a simple movement on the distribution and magnitude of neuronal recruitment, we measured regional CBF (rCBF) in eight normal volunteers, using positron emission tomography and 15O-labeled water. An auditory-cued, repetitive flexion movement of the right index finger against the thumb was performed at very slow (0.25 and 0.5 Hz), slow (0.75 and 1 Hz), fast (2 and 2.5 Hz), and very fast (3 and 4 Hz) rates. The increase of rCBF during movement relative to the resting condition was calculated for each pair of movement conditions. Left primary sensorimotor cortex showed no significant activation at the very slow rates. There was a rapid rise of rCBF between the slow and the fast rates, but no further increase at the very fast rates. The right cerebellum showed similar changes. Changes in the left primary sensorimotor cortex and the cerebellum likely reflect the effect of the movement rate. The posterior supplementary motor area (SMA) showed its highest activation at the very slow rates but no significant activation at the very fast rates. Changes correlating with those in the SMA were found in the anterior cingulate gyrus, right prefrontal area, and right thalamus. The decreases in CBF may reflect a progressive change in performance from reactive to predictive.
A direct relation between the repetition rate of a stimulus and the metabolic rate of glucose utilization has been established in the peripheral nervous system (Yarowsky et al., 1983) and, for subcortical structures, in the central nervous system (Toga and Collins, 1981). Studies in humans with positron emission tomography (PET), and using regional CBF (rCBF) changes as an indirect index of brain work, have explored the effect of stimulus rate on the central nervous system, particularly in the primary visual cortex (Fox and Raichle, 1984). The rCBF change in the striate cortex is proportional to the repetition rate of photic stimulation between 0 and 7.8 Hz (Fox and Raichle, 1984). A linear rate response function was also observed in the primary auditory cortex (Wise et al., 1991; Price et al., 1992). These studies underscore the significance of the stimulus rate as a determinant of rCBF response, at least in the primary sensory cortices.
In the motor system, direct repetitive stimulation of the forelimb motor zone of the rat caused a prominent increase of glucose consumption at the stimulus site, but the rate-response relationship was not clear (Collins et al., 1986). The effect of the movement repetition rate on rCBF is rarely mentioned, except in two studies. In one study, Seitz et al. (1990), in a task of complex finger movements, compared the initial learning condition with the well learned condition. During the initial condition, the finger movements were slow (mean ± SD, 1.8 ± 0.4 Hz). Once the movements were well learned, the movement rate increased (3.2 ± 0.4 Hz). As the movement rate increased, the rCBF in the contralateral primary motor hand area increased in intensity. However, a rate effect could not be separated from a learning effect, which affects the rCBF in the primary sensorimotor cortex (S1/M1) (Grafton et al., 1992). In the other study, Sabatini et al. (1993) measured rCBF during sequential finger-to-thumb opposition. When the task was performed with a slow repetition rate and a small amplitude in one group, no activation was observed in the contralateral S1/M1. With a fast rate and a large amplitude in another group, the S1/M1 showed significant activation. The supplementary motor area (SMA) was activated in both conditions. Because of between-group comparisons with two different conditions, they could not obtain the rate response function of the rCBF. Furthermore, the repetition rate was not strictly controlled in either study.
From a practical point of view, it is important to know the rate response function of rCBF so that other features of movement, such as complexity or learning, can be evaluated. Using PET and 15O-labeled water, we estimated the effect of movement repetition rate on the distribution and magnitude of rCBF changes in healthy subjects who performed simple repetitive finger movements with a wide range of rates (0.25–4 Hz) strictly controlled by an external auditory cue.
METHODS
We studied eight normal volunteers (four men and four women), aged 20–32 years (mean 24.0 years). All of them were right-handed by self-report. The protocol was approved by the institutional review board, and all subjects gave their written informed consent for the study. A small plastic catheter was placed in the left antecubital vein for injection of the radioisotope. The subject lay in a supine position with the eyes covered. The subject's head was immobilized with an individually fitted thermoplastic face mask.
PET scanning was performed with a Scanditronix PC 2048-15B tomograph (Uppsala, Sweden), which imaged 15 contiguous planes with an in-plane resolution of 6.5 mm. Images were reconstructed to a full width at half-maximum (FWHM) with a center-to-center distance of 6.5 mm, covering 97.5 mm in the axial direction. Matrix size and pixel size of the reconstructed images were 128 × 128 and 2 mm, respectively. A transmission scan was obtained with a rotating germanium-68 source, and from the reconstructed transmission images, the subject's head was positioned for coverage of S1/M1, sacrificing views of the lower cerebellum.
A 30-mCi dose of 15O-labeled water was injected into the left antecubital vein, and images of CBF were obtained by summing the activity occurring in the 60-s period following the initial increase in cerebral radioactivity. No arterial blood sampling was performed, and thus the images were those of tissue activity. Tissue activity recorded by this method is near-linearly related to rCBF (Fox et al., 1984; Fox and Mintun, 1989).
Each subject had 10 consecutive scans (2 resting scans and 8 movement scans) performed at 10-min intervals. Scans 1 and 10 were done under resting conditions, and scans 2–9 under movement conditions of different rates. For the resting scans, the subject lay quietly with no visual or auditory stimuli. For the movement scans, the subject performed repetitive flexion movements of the right index finger against the thumb. The movements were paced with the steady beat (0.25, 0.5, 0.75, 1, 2, 2.5, 3, and 4 Hz) of a metronome, which was placed close to the subject's right ear. The metronome beat began 15 s before injection of the isotope and continued for the duration of the scan. The movement task, which began at the time of radioisotope injection, was to touch the tip of the thumb with the index finger at each auditory cue and to return immediately to the resting position. The movement duration was ∼80 s, as it usually took 20 s for the radiotracer to reach the brain. The order of movement tasks was randomized among the eight subjects. The repetition rate of the finger movement was monitored by an electrically equipped glove. Reaction time was not measured.
Data analysis was performed using SPM software (MRC Cyclotron Unit, U.K.) in Promatlab (Mathworks, Natick, MA, U.S.A.) using Analyze image display software (BRU, Mayo Foundation, Rochester, MN, U.S.A.). The data from each subject were first standardized for brain size and shape and reconstructed parallel to the intercommissural line (Talairach and Tournoux, 1988; Friston et al., 1989, 1990). Each image was smoothed to account for the variation in normal gyral anatomy, using a Gaussian filter (FWHM x × FWHM y × FWHM, = 10 × 10 × 6 mm). In the stereotaxic standard space, each voxel was 2 × 2 × 4 mm. The effect of global differences in rCBF between scans was removed by analysis of covariance (ANCOVA) (Friston et al., 1990).
Planned linear comparisons of the adjusted mean images followed. All image analyses were performed on a pixel-by-pixel basis. The t test was applied pixel by pixel to compare the difference in mean rCBF for each condition, using the adjusted pixel error variances estimated from the ANCOVA. The value of t for each pixel in each comparison was then transformed to a normal standard distribution (z-values), which was independent of the degree of freedom of the error. The resulting set of z-values constituted a statistical parametric map, as in the report from Friston et al. (1991).
To identify the cortical areas activated by the different frequencies of movement, linear comparisons were performed to compare the very slow (0.25 and 0.5 Hz), slow (0.75 and 1 Hz), fast (2 and 2.5 Hz), and very fast (3 and 4 Hz) movement conditions with the resting condition. Significance was defined as p < 0.05. A Bonferroni-type correction for repeated measurements (Friston et al., 1991) was made for the number of comparisons and the effective number of independent pixels in each plane to set a significance threshold strict enough to keep the false-positive rate at the defined (p < 0.05) level for each plane.
The local maximal foci were then identified. ANCOVA-adjusted rCBF equivalents of these foci were calculated using the following formula and tissue activities as indexes of CBF:

where yij is the rCBF for pixel y for subject i in condition j, yij,(adj) is the adjusted value for that pixel, Gtj is the global CBF (gCBF) for subject i in condition j, yio is the mean of yij across all the conditions for subject i, Gio is the mean of Gij across all the conditions, yoo is the mean of yij across all subjects and conditions, and β is the regression coefficient derived from the ANCO VA of yij on Gij, allowing for a main effect due to subjects. With this formula, Gio was normalized to 50; therefore, the values of the ANCOVA-adjusted rCBF [yij(adj)] are unitless relative to the whole-brain mean and not absolute.
The association of the SMA with the cortical areas identified by the linear comparisons at the very slow frequencies (0.25 and 0.5 Hz) was assessed with a regression model. SMA ij denotes the ANCOVA-adjusted rCBF at [−2, −6, 56] for subject i at condition j (i = 1, …, 8; j = 1, …, 10), and Yij denotes the corresponding rCBF at a particular cortical area. The following equation describes the linear relationship of Y to SMA:

where μ i is the effect of the ith subject and ε ij is the statistic error. Because both Yij and SMA ij are ANCOVA adjusted, all the estimated μ i values are equal. Slope γ is then a measure of the linear association of Y with SMA, and its statistical significance can be assessed with an F distribution, with 1 and 70 df in this case.
To measure the time difference between the external auditory cue and each finger tap, four right-handed normal volunteers were newly recruited. The task was identical to that performed in the PET study except for the total number of taps at each movement frequency. A total of 360 taps were recorded from 4 to 1 Hz. The total number of taps recorded was 135 at 0.75 Hz, 90 at 0.5 Hz, and 45 at 0.25 Hz. The last four conditions took 3 min each. The timing of the auditory cue and each tap of the thumb with the right index finger were recorded by microcomputer. Each tap was considered to be coupled with the auditory cue that was closest in timing.
RESULTS
Different repetition rates of right index finger movements caused different patterns of activation (Table 1). At the very slow rates (0.25 and 0.5 Hz), the main changes in CBF (ΔCBF) occurred in the posterior portion of the SMA, right insular cortex, anterior cingulate gyrus, bilateral thalami, superior temporal gyri, and right prefrontal area (Fig. 1A). The left S1/M1 or cerebellum was not significantly activated. At the slow rates (0.75 and 1 Hz), the left S1/M1, right superior cerebellum, left premotor area, and left putamen were activated (Fig. 1B). At the fast rates (2 and 2.5 Hz), the left S1/M1, right superior cerebellum, SMA, and left transverse temporal gyrus were activated (Fig. 1C). At the very fast rates (3 and 4 Hz), the left S1/M1, left transverse temporal gyrus, and right superior cerebellum were activated (Fig. 1D).
Brain areas activated by opponent movements of right index finger performed at different frequencies
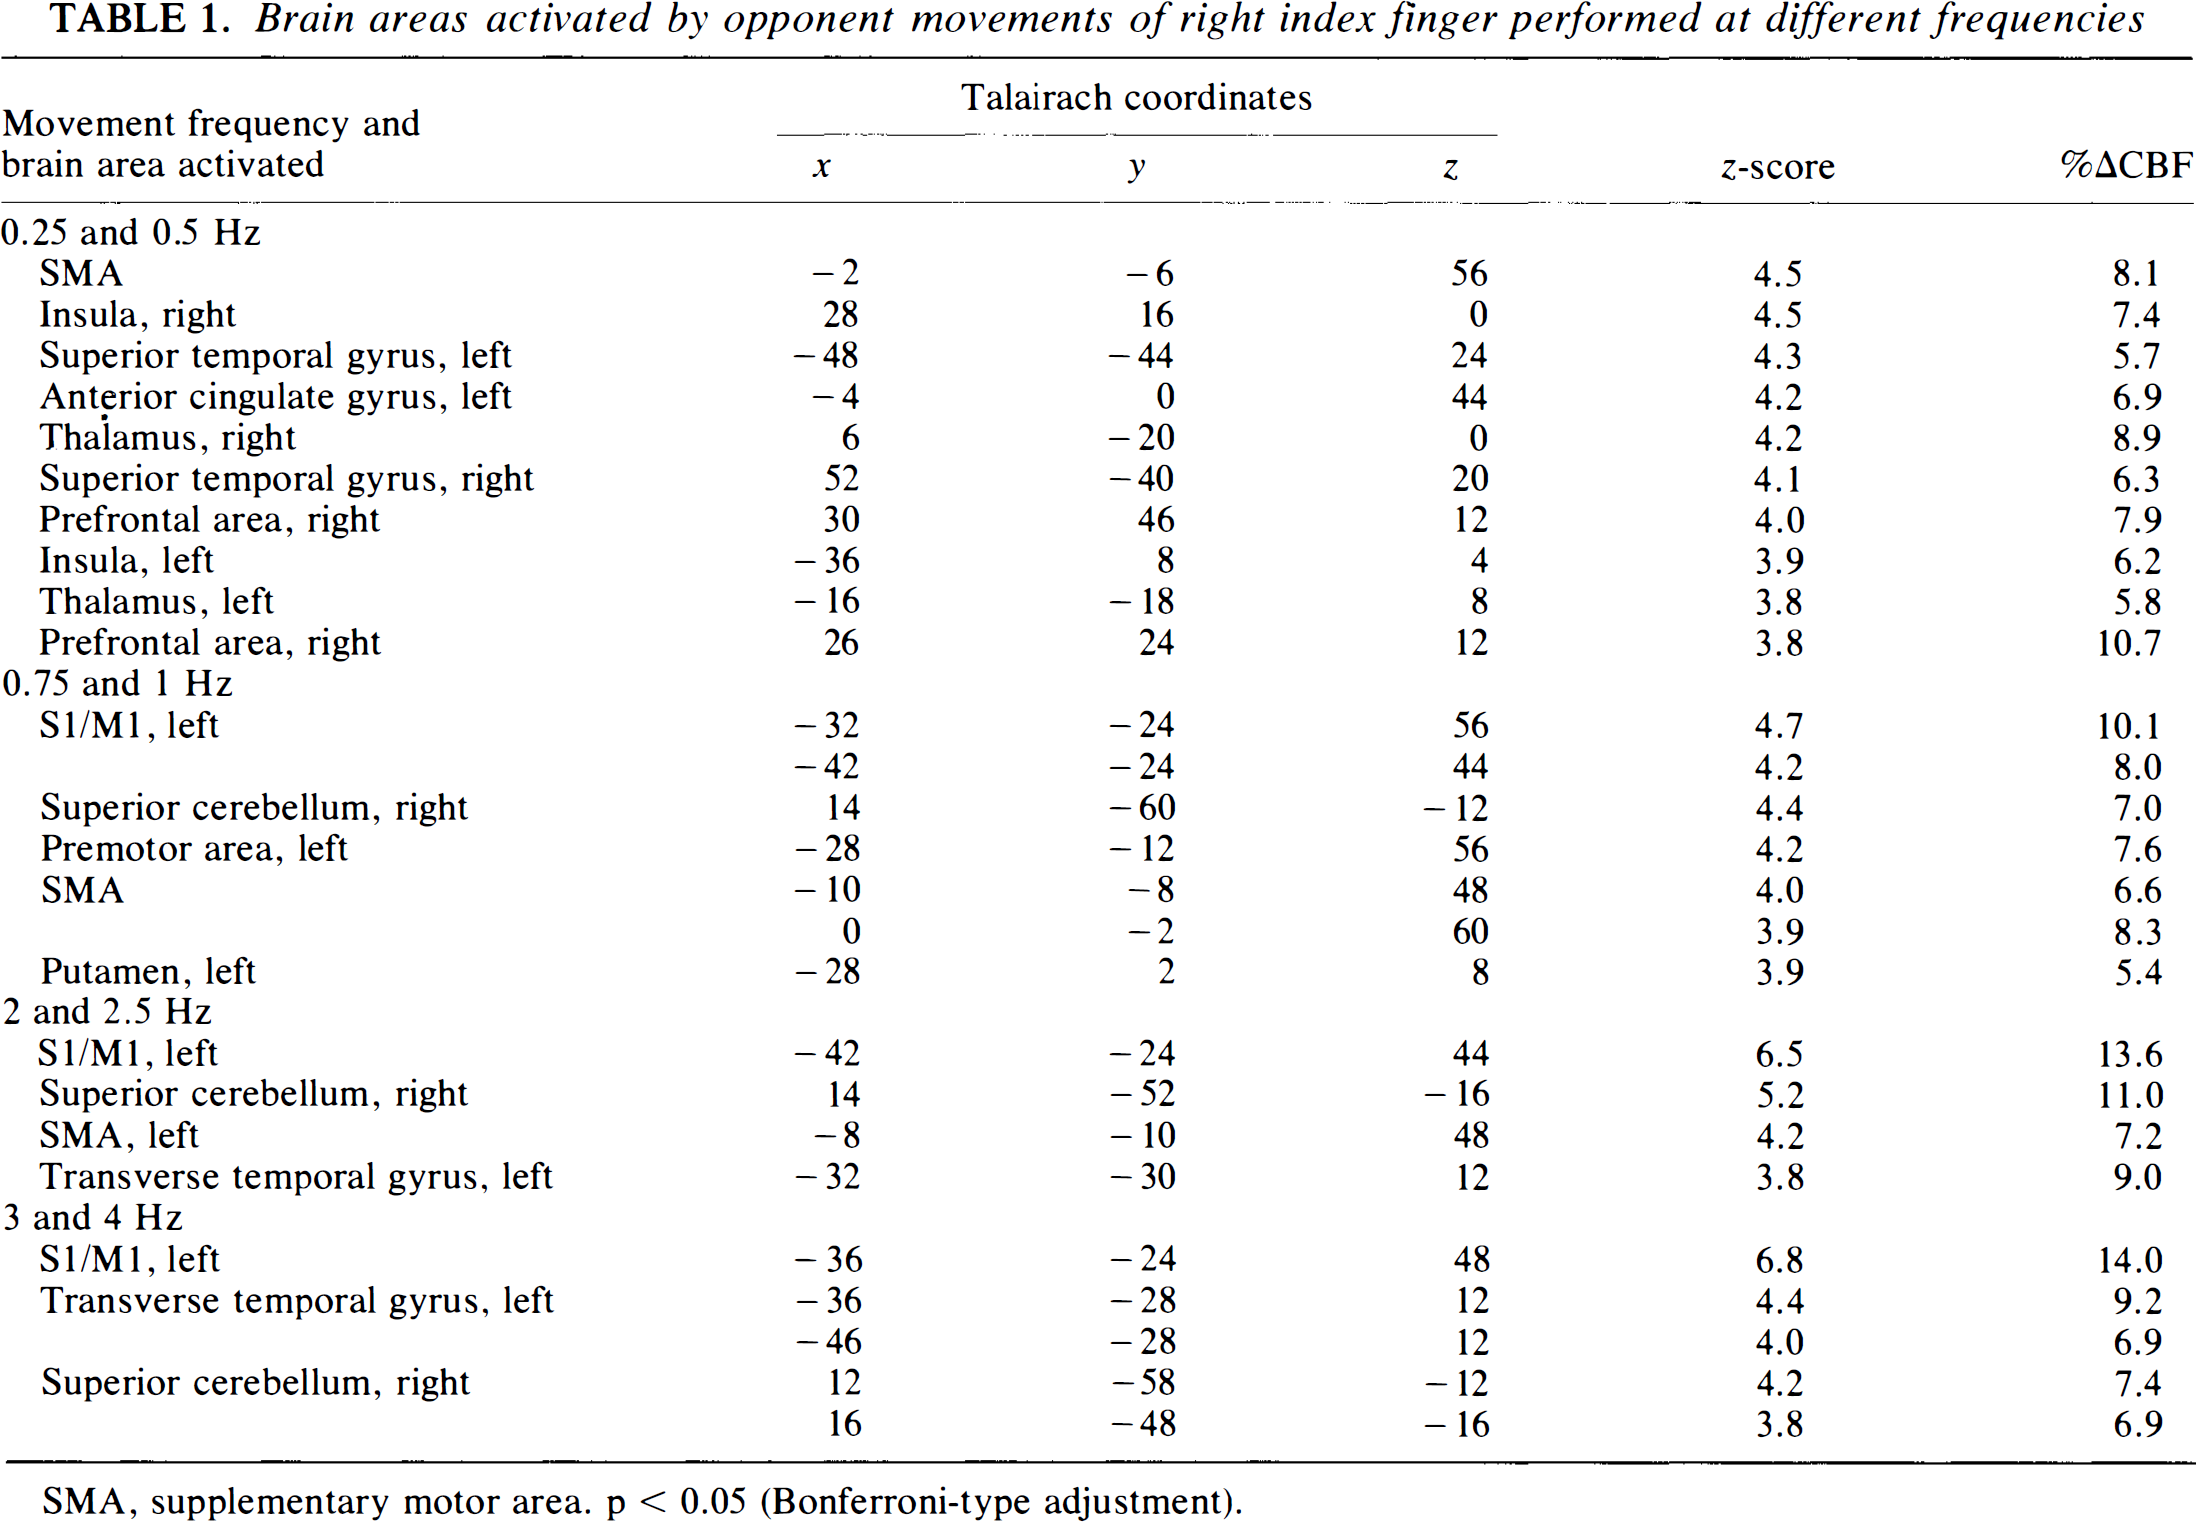
SMA, supplementary motor area, p < 0.05 (Bonferroni-type adjustment).
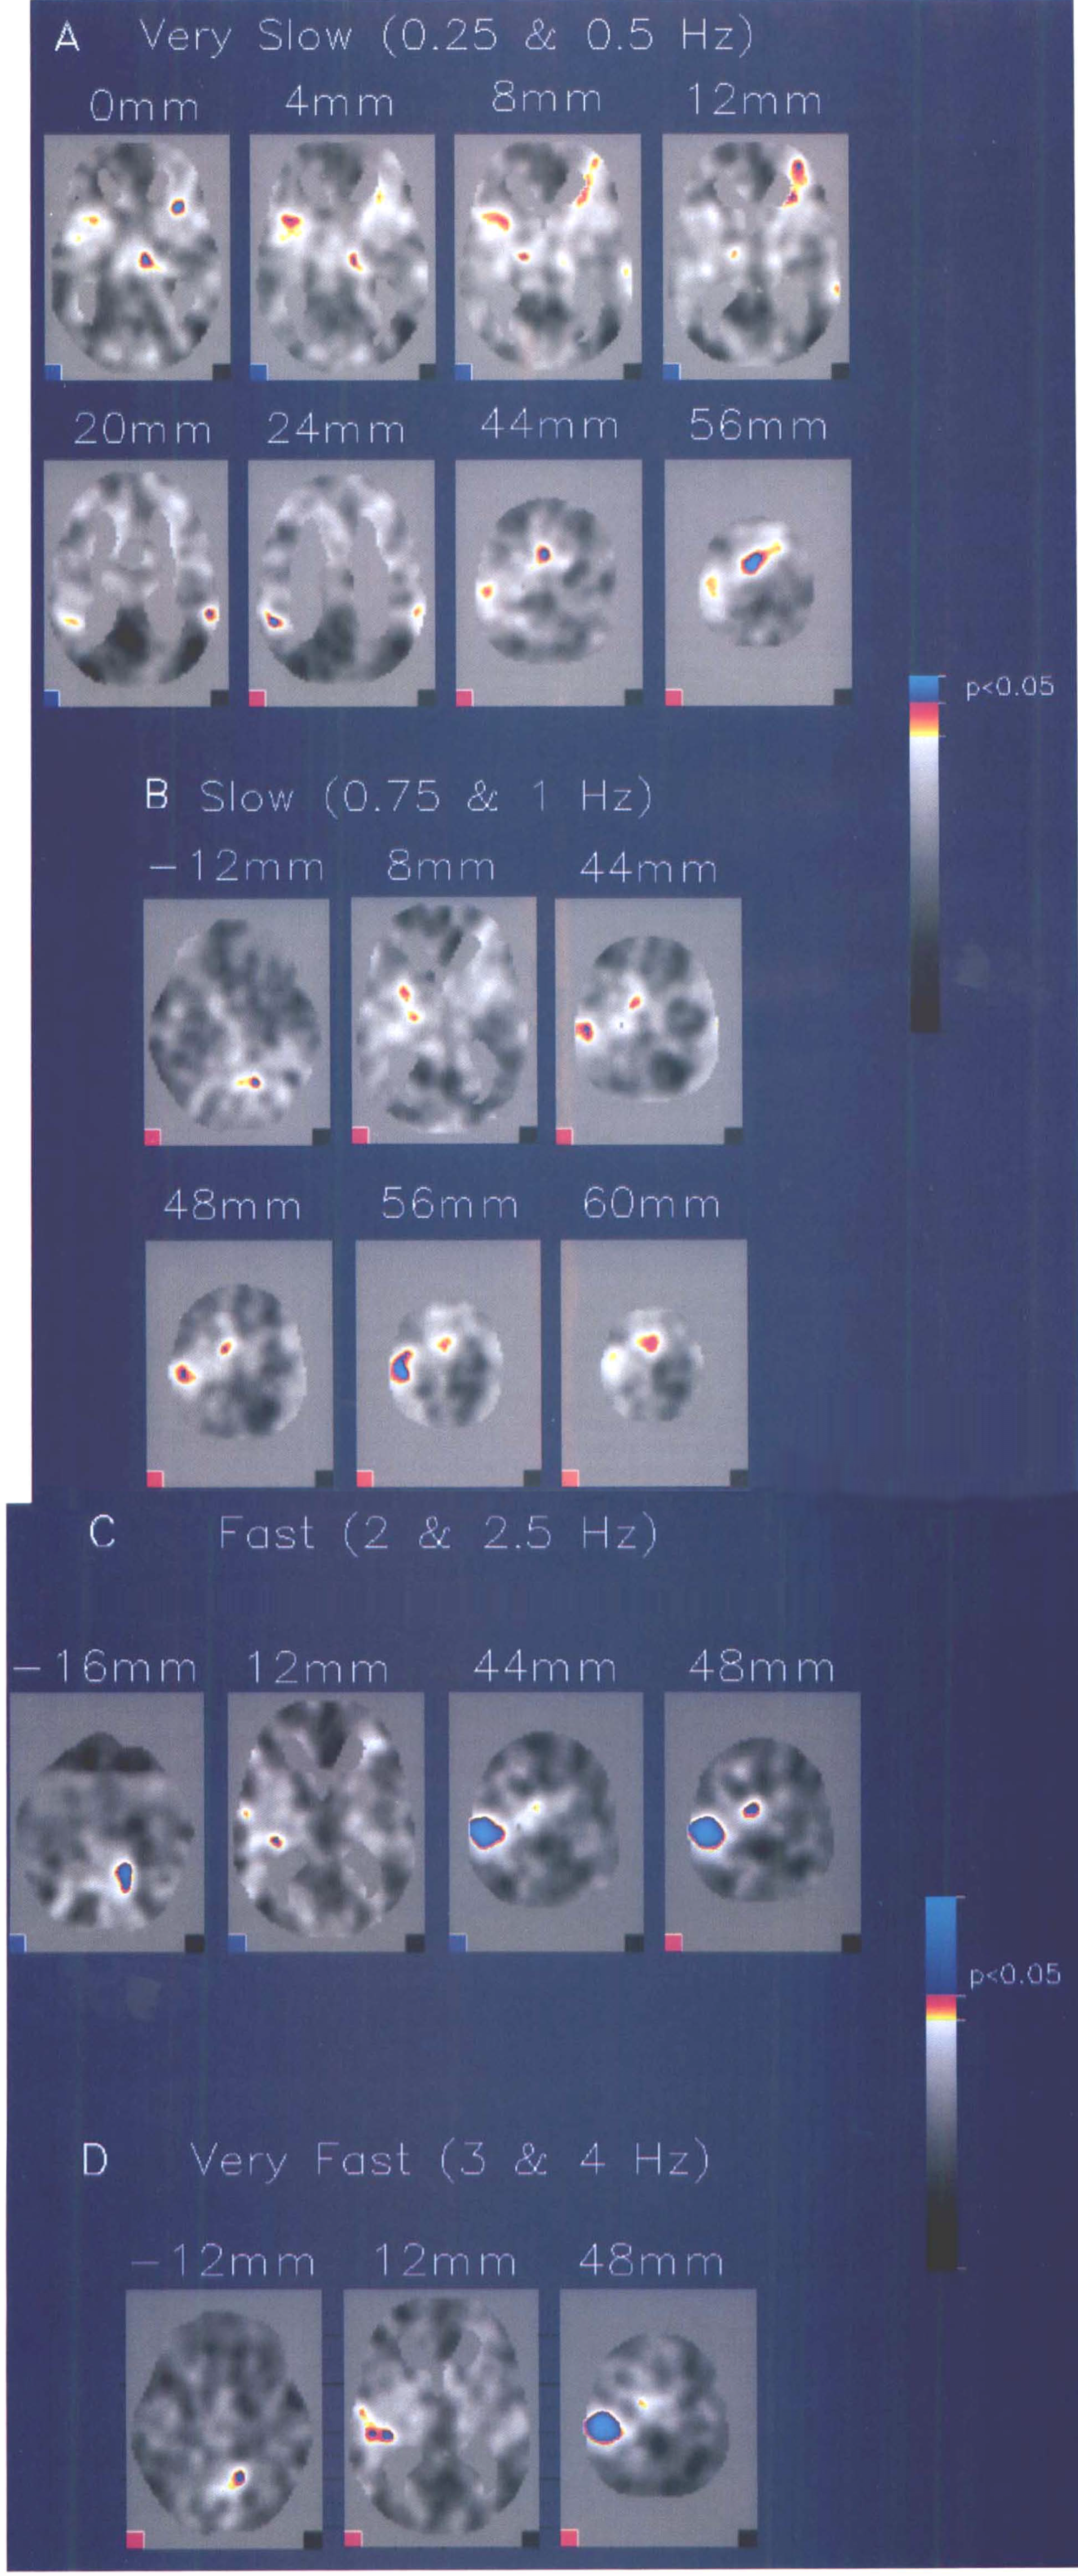
Transverse sections of Statistical parametric map (from z-scores) for different frequencies of opponent finger movement on the right side.
Figure 2A shows the relationship between the repetition rate of the movement and the ANCOVA-adjusted rCBF of the left S1/M1 and the SMA. The left S1/M1 showed a relatively small increase in rCBF at a low frequency, a rapid increase between 1 and 2 Hz, and then saturation of rCBF at higher frequencies. In contrast, the SMA showed a large ΔCBF at the very slow rates and a smaller ΔCBF at the very fast rates.
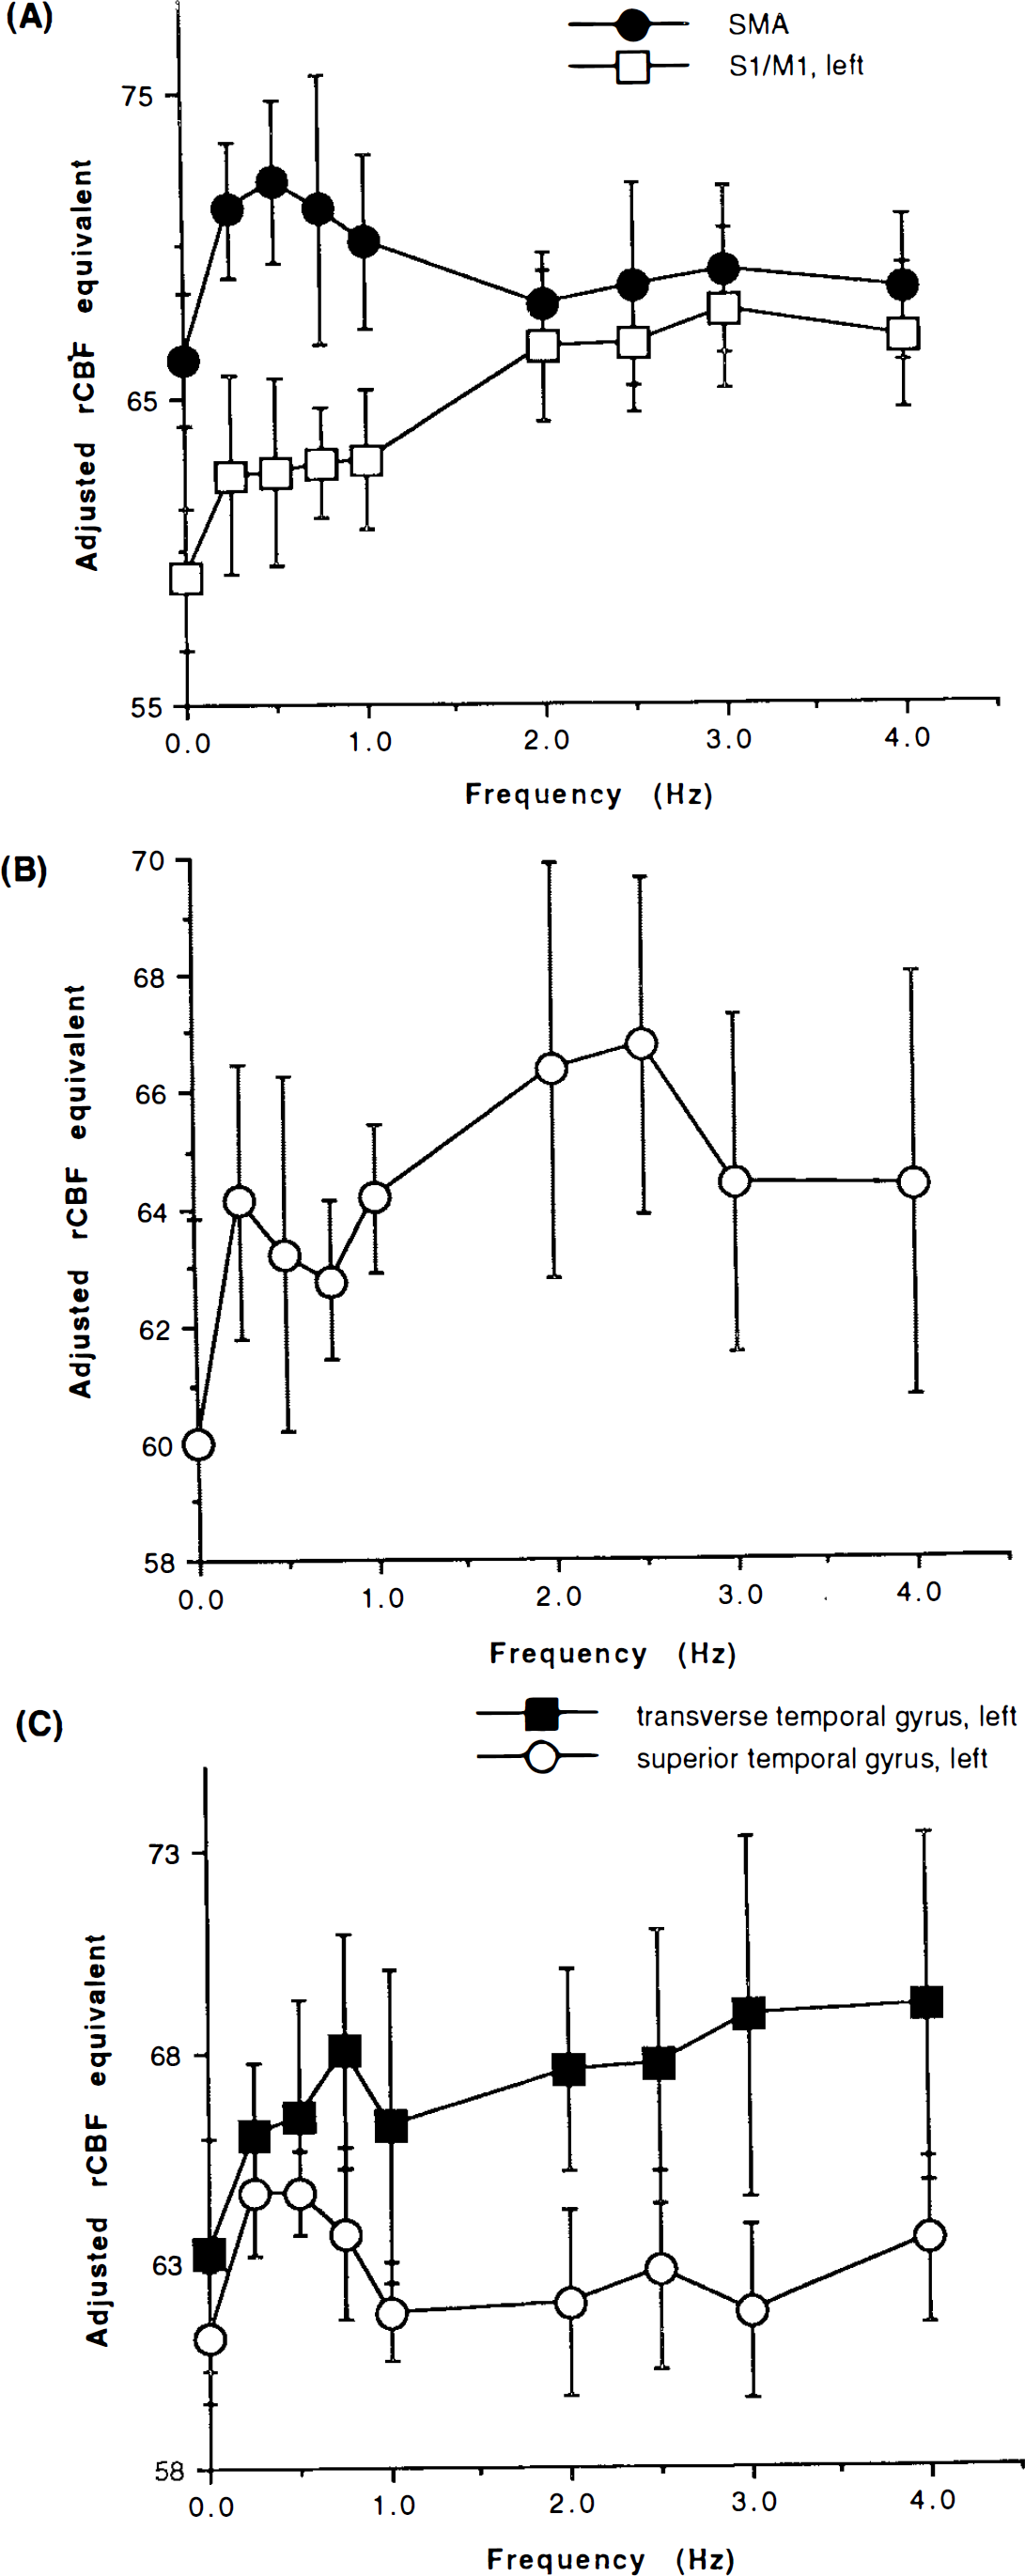
Analysis-of-covariance-adjusted regional CBF (rCBF) changes in several cerebral regions (at the specified Talairach coordinates).
The right cerebellum showed rCBF changes similar to those of the left S1/M1 at the very slow, slow, and fast conditions. In the very fast condition, however, rCBF declined (Fig. 2B).
Figure 2C shows the relationship between the repetition rate of the auditory cues and the left transverse temporal gyrus and the left superior temporal gyrus. The rCBF in the left transverse temporal gyrus was well modeled as a linear function of log (f + 0.125) where/is the frequency and 0.125 Hz half the very slow rate. The slope was 1.54 (p < 0.00001). In contrast, the left superior temporal gyrus showed maximal activation at the very slow rate.
In the very slow condition (0.25 and 0.5 Hz), the ΔCBF of the anterior cingulate gyrus, right thalamus, and right prefrontal area correlated with those of the SMA (Table 2). All areas showed peak ΔCBF at the very slow rates (0.25 and 0.5 Hz) and a monotonous decrease of rCBF at higher repetition rates.
Brain areas activated at very slow movement rates (0.25 and 0.5 Hz): correlation with supplementary motor area (SMA)
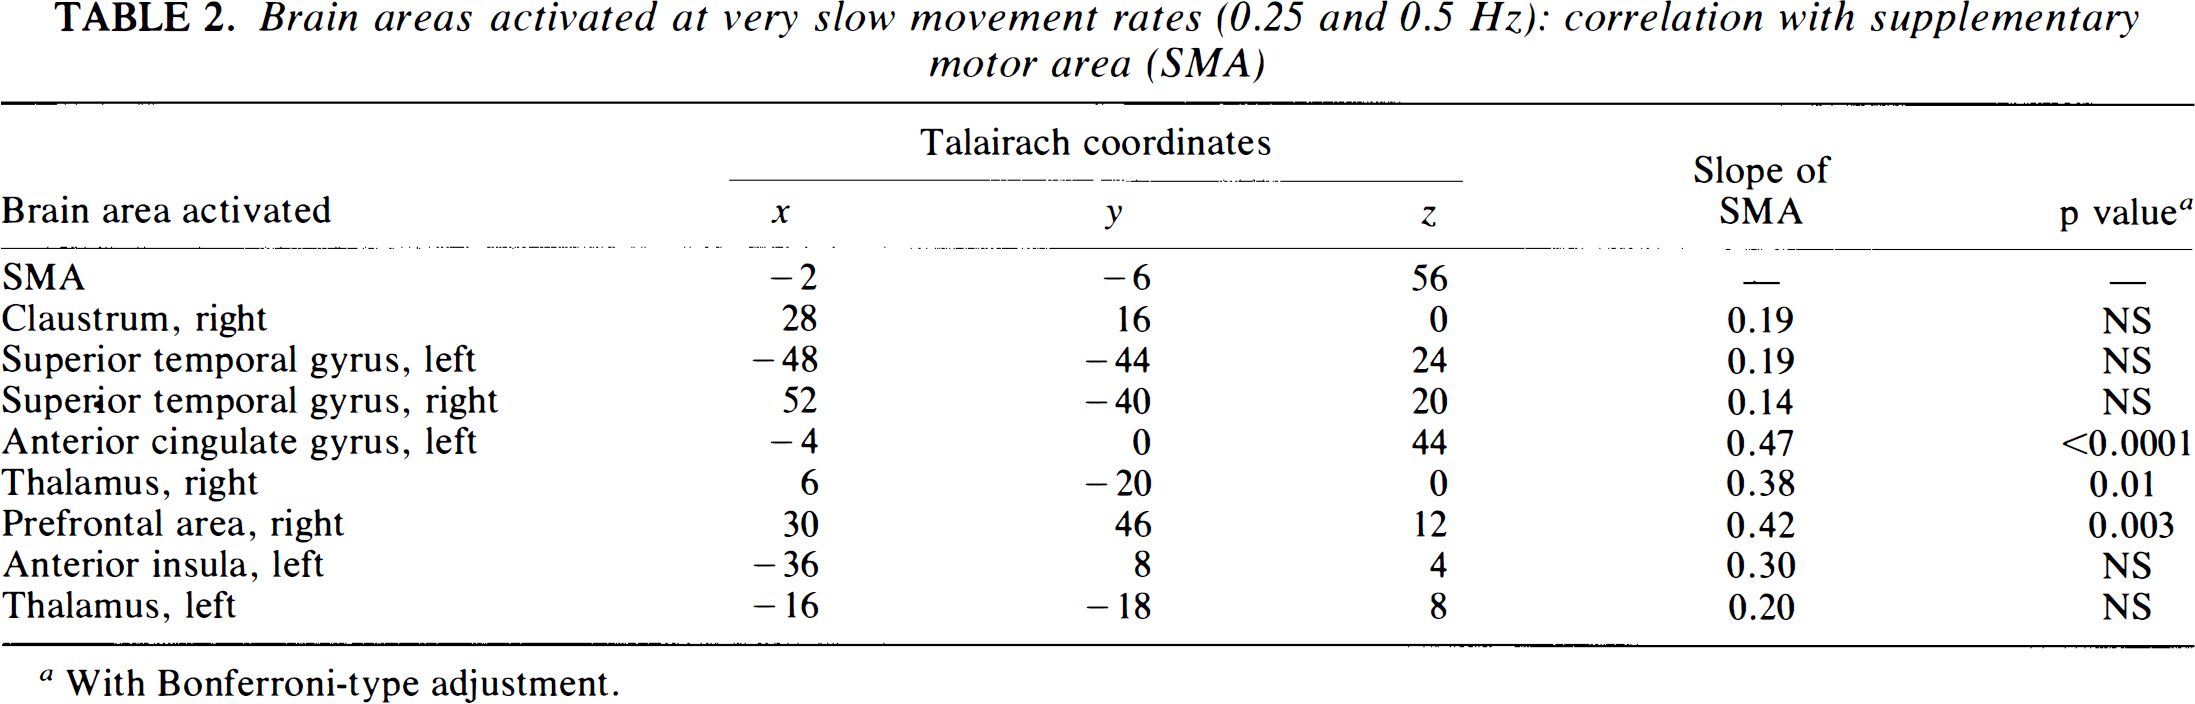
With Bonferroni-type adjustment.
Figure 3A shows the relation between the cue-tap time difference and the repetition rate. At the very slow rates, the cue-tap time difference ranged from 100 to 200 ms. At the very fast frequencies, the cue-tap time difference was markedly reduced. There was also an increased number of reactions preceding the cue signal when the movements were faster than 0.75 Hz (Fig. 3B).
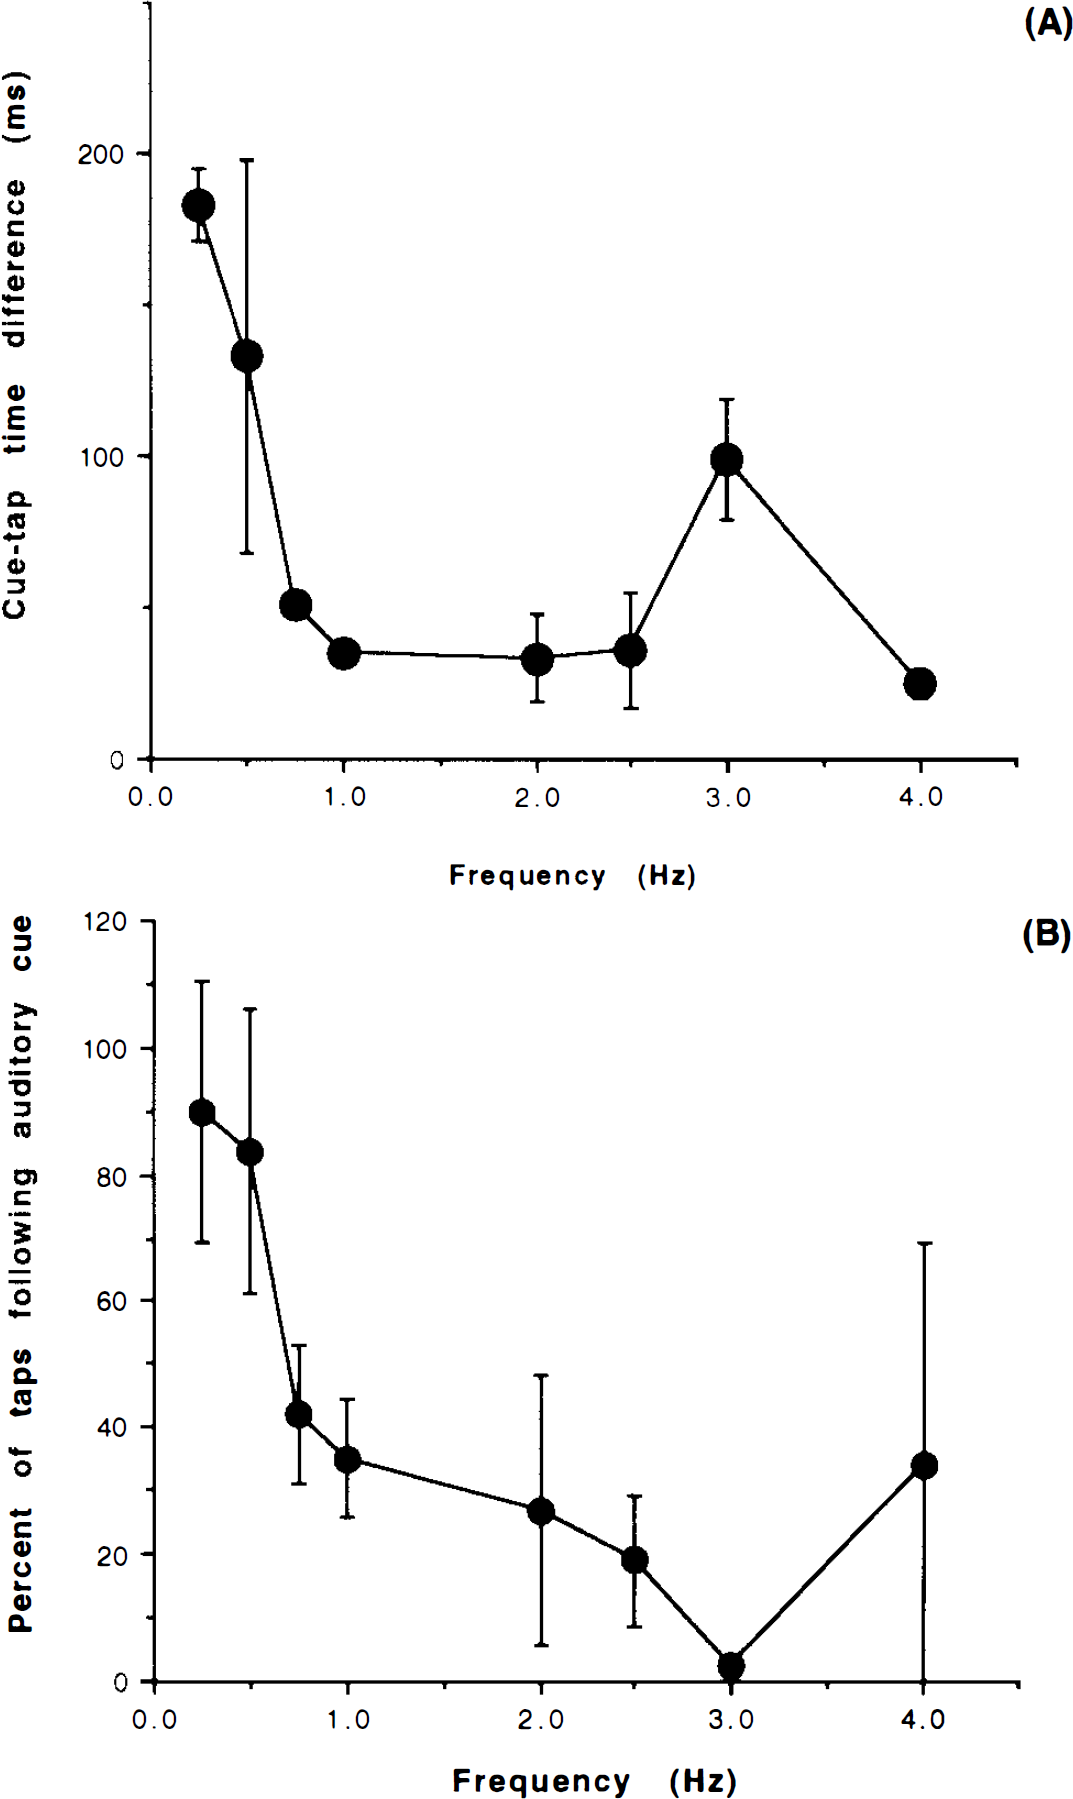
Reaction time measurements obtained with four normal volunteers performing the same task as in the positron emission tomography paradigm.
DISCUSSION
In this study, we used ANCOVA-adjusted tissue activity values as a measure of rCBF changes. With 15O-labeled water used as a tracer, rCBF was originally calculated with Kety's diffusible autoradiographic method with an arterial input function; thus, rCBF was a measure of perfusion. In an activation study, the primary concern is to locate and quantitate regional changes of CBF induced by the activation paradigm because gCBF is not significantly affected by passive sensory stimulation or motor tasks (Fox and Raichle, 1984; Fox et al., 1985, 1986; Seitz and Roland, 1992). Any fluctuation of gCBF could be caused by technical as well as physiological factors (Sadato et al., 1993). The effect of gCBF fluctuation was effectively abolished by multiplying each pixel by a correction factor calculated as the scan gCBF divided by the true mean gCBF (Fox et al., 1984). It is assumed that scan-to-scan fluctuation equally affects every pixel and that rCBF changes are dependent on gCBF:
This method, global normalization by whole-brain ratio, has been proven to allow quantitative comparison of the relative regional increase in blood flow induced by selective stimulation. Subtraction of the resting condition from the activation condition localizes the foci related to the specific task. The simplified method, without arterial sampling, has been widely used, as no change in response detection sensitivity or specificity was shown with the bolus method (Fox et al., 1988). It is based on the fact that the concentration of 15O-labeled water after bolus injection is nearly proportional to the CBF of that region. Tissue radioactivity is used as a measure of rCBF. Global normalization and subtraction of the resting condition from the activation condition are followed, as in the original method.
With the use of 15O-labeled water as a tracer and global normalization, underestimation of change in rCBF in areas of high blood flow cannot be avoided because of the washout effect (Volkow et al., 1991) and incomplete extraction (Berridge et al., 1991). However, with the use of the bolus method and a short scanning time, the underestimation of ΔrCBF with global normalization is relatively small, in the physiological range of rCBF (Fox and Mintun, 1989). With the use of either absolute rCBF images or tissue activity images, therefore, changes of rCBF are properly understood as changes relative to the whole-brain mean (Fox and Mintun, 1989), and the relative change calculated from changes in tissue activity is nearly equal to that from absolute rCBF images.
Another method of global normalization, the ANCO VA procedure, has been proposed (Friston et al., 1990). The ANCO VA method uses gCBF as a covariant of rCBF and assumes that gCBF and rCBF are independent. This assumption was validated physiologically in normal subjects by manipulating gCBF experimentally (Ramsay et al., 1993). Although the mathematical formula and underlying assumption are different, these procedures of global normalization showed the same results in terms of the relative change in rCBF as well as the detectability of the activated foci (Friston et al., 1990). Therefore, change in ANCOVA-adjusted rCBF is a measure of neuronal activity that is essentially equivalent to the whole-brain ratio adjusted rCBF. Considering the near-linear relationship between rCBF and tissue activity with the bolus method, in turn, the values for ANCOVA-adjusted tissue activity are feasible as a measure of rCBF changes.
The correlational changes of adjusted rCBF with the frequency of the movement observed in our study are not artifacts caused by the use of water as a tracer, because the tissue activity-rCBF relation with the bolus method is nearly linear in the physiological range of rCBF (Herscovitch et al., 1983; Fox et al., 1984). The ANCOVA procedure is also an unlikely cause because of its linear adjustment along the line of the common slope (β) among the subjects and the conditions, as shown in Eq. 3. Therefore, we suggest that the shape of the relation between adjusted blood flow and the frequency of movement reflects physiological changes.
In this study, we adopted an external auditory cue to which subjects showed typical reaction time behavior at very slow rates of finger movement (Fig. 3A). With progressively faster rates, it became more difficult to react to each stimulus. In a rhythmic, sequential reaction time task, the previous signal or string of signals affects the mean reaction time. With brief reaction-stimulus intervals, <0.5 s, the effect of the repeated signal may be to bypass some of the signal processes that are normally involved (Luce, 1986). In the present study, this tendency was confirmed by the measurement of reaction time, which decreased dramatically as the repetition rate of the movement increased. In addition, the number of reactions preceding the cue signal increased when the movements were faster than 0.75 Hz (Fig. 3B), which is suggestive of anticipation or prediction. The findings of Neilson (1972) also support this tendency. Using a kinesthetic tracking test, they found that the subjects were unable to produce a coherent closed-loop response to stimulus frequencies greater than 2 Hz around the elbow joint. Hence, cued movements at frequencies greater than 2 Hz were likely to be not reactive but predictive.
The sigmoid-shaped rate response function of the left S1/M1 for rCBF is clearly in contrast with that obtained from the primary visual cortex, which showed a linear relationship between the rCBF and the stimulus rate up to 7.8 Hz (Fox and Raichle, 1984). At 0.25 and 0.5 Hz, the left S1/M1 showed no significant activation, probably because of the small number of task iterations within the measurement interval of 60 s, which resulted in a low mean neuronal activity integrated over the measurement interval. Here we assume that a similar burst of neuronal activity in Ml is coupled with each movement. It is reasonable because during alternating wrist movement in nonhuman primates, the largest neuronal discharge was coupled with a change in the direction of the acceleration (Butler et al., 1992a).
The rapid increase of ΔCBF of the S1/M1 between 1 and 2 Hz shows a narrower range of correlative change of rCBF with movement frequency than that in visual stimulation. It is of practical importance because motor tasks usually are performed in this physiological range.
Saturation of rCBF from 2 to 4 Hz suggests that the mean neuronal activity integrated over the volume of PET resolution (∼10 × 10 × 6 mm3) reached a plateau, as the partial volume effect of PET precludes an ability to dissociate volume from magnitude (Fox et al., 1985). Recent preliminary studies using functional magnetic resonance imaging, which has better spatial resolution, suggest that the area of activation in the primary motor cortex decreased at frequencies above 2 Hz (Sadato et al., 1994), whereas ΔCBF linearly correlated with the frequency of the movement up to 4 Hz (Rao et al., 1994; Sadato et al., 1994). The increased magnitude in the smaller volume may partly explain the saturation of ΔCBF with PET. Saturation of ΔCBF at S1/M1 from 2 to 4 Hz might reflect neural firing patterns characteristic of rapid alternating movement shown by extracellular recording from the motor cortex in monkeys (Butler et al., 1992a). During rapid alternating flexion and extension movements of the wrist, the neuronal discharge rate in the motor cortex was constant across the repetition rate range of 2–4 Hz, whereas the mean integrated electromyographic activity was linearly correlated with the repetition rate (Butler et al., 1992a). In addition, thalamic nuclei (VPLo, Vlc, area X, and VLps), which receive excitatory afferents from deep cerebellar nuclei and presumably represent cerebellar activity (Butler et al., 1992b), showed a constant neuronal firing rate from 2 to 4 Hz. Although this finding may be compatible with the results of our CBF study, comparisons might be difficult because summation of thalamic and cerebellar activity may have occurred in the earlier study, and our study covered only the superior portion of the cerebellum. We assumed that the energy-dependent change in neuronal function and blood flow are coupled and that neuronal discharge rate is a measure of energy-dependent neuronal function (Raichle, 1987).
These findings suggest that the proper selection and constancy of movement frequency may be crucial to the investigation of other aspects of movement such as learning or complexity.
The SMA is now argued to have two distinct areas with different functions, that is, the anterior SMA, or pre-SMA, and the posterior SMA, or SMA proper (Luppino et al., 1993). They are roughly divided by the vertical anterior commissorial (VAC) line (Deiber et al., 1991). In the present study, the posterior SMA showed the highest activation with the very slow movement, which was quite different from the response of S1/M1, presumably reflecting a different role of the SMA for control of movement. As the very slow rate condition is a reaction time task, rCBF changes represent neuronal activity related to opponent finger movements, each of which was a reaction to an auditory cue. The posterior SMA plays a role in initiation of voluntary movement (Fox et al., 1985). The SMA neuronal activity is closely related to auditory sensory signals, as shown in an auditory-cued movement task with monkeys (Kurata and Tanji, 1985).
In the very slow movement, the highest activation occurred in regions other than the SMA (Table 2). The right prefrontal area, right thalamus, and anterior cingulate gyrus showed significant changes correlating with those of the SMA, indicating a tight functional connection. While the association auditory cortex bilaterally was not formally correlated with the SMA, it did show the highest activity in the very slow task, in contrast with the response of the primary auditory cortex. A monotonic increase of rCBF in the left transverse temporal gyrus as the frequency increased appeared to be the primary effect of the metronome sound. Price et al. (1992) found frequency-dependent changes of rCBF in the transverse temporal cortex during word presentation, whereas an increase but no frequency dependence was observed in the superior temporal gyrus. This is consistent with the present study, which showed an activation pattern in the superior temporal gyrus different from that in the left transverse temporal gyrus. By recording cortical field potentials during go/no-go reaction time hand movements with tone discrimination in the monkey, Gemba (1993) suggested that the superior temporal gyrus may process auditory information before the discrimination in the prefrontal cortex. Corticocortical afferents from the prefrontal cortex to SMA seem to be important in giving rise to responses to auditory signals (Kurata and Tanji, 1985).
Another issue is the effect of attention. In the study of audio-initiated hand movement by monkeys, Gemba and Sasaki (1987) found that field potentials in the prefrontal cortex were relatively small after repeated training, but increased temporarily when the frequency of the auditory stimulus was changed. They suggested that when the monkey devotes intensive attention to auditory stimuli, a large potential appears in the prefrontal cortex. In a human PET study (Pardo et al., 1991), the prefrontal area on the right appeared to be related to sustained attention to sensory input. The cingulate cortex has reciprocal connection with the prefrontal cortex (Pandya et al., 1981). Paus et al. (1993) speculated that the anterior cingulate gyrus may contribute to the funneling of cognitive commands from the prefrontal cortex to the motor structures, facilitating the execution of the appropriate responses and suppressing the inappropriate ones. The anterior cingulate gyrus was activated when high “attentional demand” or “response selection” was required in a Stroop attentional conflict paradigm (Pardo et al., 1990; Cohen et al., 1992). Correlative change in the right thalamus is compatible with the fact that the SMA, prefrontal area, and anterior cingulate gyrus have thalamic projection as a part of parallel basal ganglia-thalamocortical circuits, although their function is not well known (Alexander et al., 1986). Coactivation of these areas suggests that the posterior SMA is involved in movement initiation with reference to the auditory attentional system.
Maximal activation in the SMA and its correlated structures, compared with Ml and its correlated structures, could be explained by a trade-off between preparatory activity and execution. Preparatory activity includes motor set and perceptual set (Evarts et al., 1984). Motor set is the covert biasing of downstream motor systems with respect to some specific aspect of the subsequent movement, such as trajectory or kinematics (Evarts et al., 1984; Alexander and Crutcher, 1990). The SMA shows short latency increases in neuronal activity during motor set related to the direction of the intended response (Tanji et al., 1980). Perceptual set is related to the expectation of target appearance (Evarts et al., 1984). Tonic, set-related activity, which appears to be related to the expectation of target appearance, has been reported in the SMA (Tanji and Kurata, 1985). With a long interstimulus interval, there is more time for activity related to motor set and perceptual set. If the SMA and its correlated structures are related more to preparatory activity than to execution, then they should be more active with slow rates. In a visuomotor step-tracking task by monkeys, cells showing only preparatory activity were three times greater in the SMA than in Ml (Alexander and Crutcher, 1990), which could explain the different behavior of the S1/M1 and SMA in our study.
Footnotes
Acknowledgment:
The authors thank the members of the Positron Emission Tomography Section, Nuclear Medicine Department, Clinical Center, National Institutes of Health, for their expertise and Ms. B.J. Hessie for skillful editing.