
Abstract
Proton magnetic resonance spectroscopy (1H-MRS) allows in vivo assessment of the metabolism related to human brain functions. Visual, auditory, tactile, and motor stimuli induce a temporary increase in the brain lactate level, which may act as a rapid source of energy for the activated neurons. The authors studied the metabolism of the frontal lobes during cognitive stimulation and measured local lactate levels with standard 1H-MRS, after localizing the activated area by functional MRI. Lactate levels were monitored while the subjects either silently listed numbers (baseline) or performed a silent word-generation task (stimulus-activation). The cognitive stimulus-activation produced a 50% increase in the brain lactate level in the left inferior frontal gyrus. The results show that metabolic imaging of neuronal activity related to cognition is possible using 1H-MRS.
Keywords
Human cognition can be assessed by neuropsychological tests and imaging methods such as functional magnetic resonance imaging (fMRI), positron emission tomography, and magnetoencephalography. Although these studies produce important information concerning the capacity and anatomical localization of brain functions, the biochemical and metabolic reactions related to cognition have gained less attention. The metabolic events of neuronal activity can be measured in vivo using proton magnetic resonance spectroscopy (1H-MRS), which provides a novel approach to cognitive studies (Ross and Bluml, 2001).
Increased neuronal activity causes a transient increase in the brain lactate level in the activated area. This physiologic response reflects an increase for energy demand in the stimulated brain area (Magistretti and Pellerin, 1997; Shulman et al., 2001). The brain lactate response has been detected in animals by invasive methods and in humans by 1H-MRS during somatosensory (Hu and Wilson, 1997; Kuhr and Korf, 1988; Madsen et al., 1999), visual (Frahm et al., 1996; Prichard et al., 1991; Sappey-Marinier et al., 1992), motor (Kuwabara et al., 1995), and auditory (Richards et al., 1997) stimulation. The effects of cognitive stimulation on brain lactate levels have been documented in dyslexic children (Richards et al., 1999, 2000).
Human cognition can be studied by using verbal fluency tests, where words are retrieved from long-term memory storage. These widely used neuropsychological tests assess predominantly the functions of the frontal lobes, and involve associative, attentional, visual, and auditory processes (Friedman et al., 1998). During the performance of verbal fluency tests, the left frontal lobe is consistently activated, but the precise activation pattern and its intensity seem to depend on the specific tasks and procedures used (Friedman et al., 1998; Phelps et al., 1997; Pihlajamäki et al., 2000; Schlösser et al., 1998).
We hypothesized that besides sensory stimuli, cognitive tasks could also increase the brain lactate level in the stimulated area, and optimized a method for studying regional metabolism of the brain during cognitive activity in healthy volunteers. To avoid head motion and interfering activation of the motor cortex, a silent word-generation test was chosen for cognitive stimulation. A careful localization of the region-of-interest with fMRI and a long-enough signal acquisition enabled us to detect the lactate signal with sufficient signal-to-noise ratio using a standard MRS sequence and head coil.
MATERIALS AND METHODS
Subjects
Twelve healthy, nonsmoking, drug-free women (mean age, 21 years; age range, 19–23 years; mean ± SD body mass index, 20.1 ± 1.4 kg/m2) volunteered to participate in the study. Subjects with major somatic, sleep, or psychiatric disorders were excluded using an interview, the Basic Nordic Sleep Questionnaire, psychiatric inventories (Beck Depression Inventory, Beck Anxiety Inventory), and laboratory tests. The subjects spoke Finnish as their mother tongue and were studied in the early follicular phase of their menstrual cycle.
To standardize the vigilance state and blood and tissue lactate levels, all subjects practiced a regular meal and sleep schedule for 1 week before the experiments. The daily energy intake was regulated to 2,000 to 2,500 kcal, mealtimes were scheduled, and no alcohol intake or medication, except for oral contraceptives, was allowed. The subjects drank less than two cups of coffee per day. Actigraph registrations (Actiwatch-L, Cambridge Neurotechnology Ltd) and sleep diary confirmed their regular sleep-wake rhythm. The subjects gave an informed consent to participate in the study, which was approved by the Ethics Committee of the Helsinki University Central Hospital.
Verbal fluency test
The verbal fluency test was performed as silent word generation during fMRI and 1H-MRS, following instructions via headphones. Within a given time, the subjects retrieved as many words as possible according to two rules: words belonging to a certain category (category task) and words beginning with a specified letter (letter task). A third task, with no associative component, consisted of silently listing numbers upwards from number one (number listing task).
To validate the testing method, brain activity was mapped with fMRI during the performance of each of these tasks (category, letter, and number-listing tasks) in four subjects. First, the subjects were asked not to think of anything and to avoid inner speech. This resting state was contrasted with the number-listing task. No activation in the left inferior frontal gyrus was observed during the number-listing task (Fig. 1A), which was then selected as the baseline task. The left inferior frontal gyrus became activated with both letter and category tasks (Fig. 1, B and C). There was some variability in the size of the activated area (Fig. 1, B and C), but the localization of the activated site was similar with the two word-generation tasks. Therefore, we decided to use them alternately for stimulus-activation in the actual experiments to maximize task compliance and to avoid excessive monotony during the long experimental period.
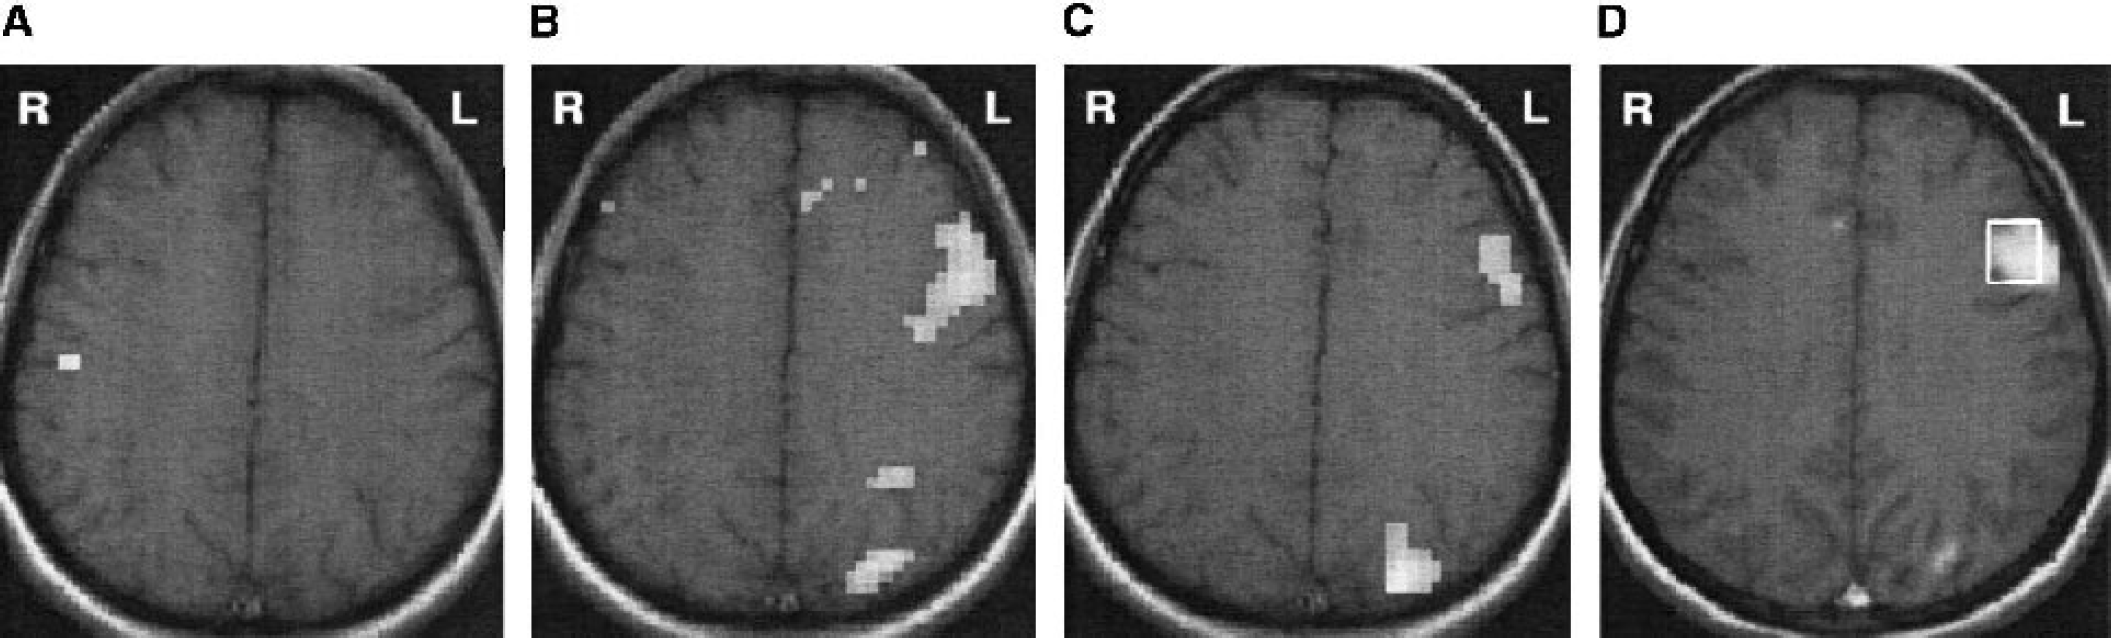
An activation map for a subject performing
The tasks were explained in detail to the subjects and they had a practice session before the start of the experiment. In the actual study, each subject performed the same tasks in the same order, and a specific category was used only once. The category tasks included both living and nonliving items (e.g., animals, furniture, plants, food, clothes). In the letter tasks, four letters had to be used twice during the session, the rest of the letters were used only once. The verbal fluency test was compared with the number-listing task during the baseline in fMRI and 1H-MRS. The duration of the fMRI tasks (baseline or stimulus-activation, block design) was 30 seconds, whereas during the 1H-MRS, the baseline and the stimulation periods consisted of consecutive 1-minute tasks. To verify the ability of the subjects to perform the tasks during the experiment, the subjects performed a 2-minute tape-recorded verbal fluency test session with one letter and one category task directly after the fMRI/1H-MRS.
Magnetic resonance experiments
The subjects were studied with a 1.5-T GE Signa Horizon LX EchoSpeed scanner (GE Medical Systems, Milwaukee, WI, U.S.A.) equipped with a standard quadrature transmit/receive birdcage head coil. An oblique axial T1-weighted image set used as an anatomical reference covered the frontotemporal brain from the Sylvian fissure to the vertex in the anterior to posterior commissure plane (spin-echo; repetition time, 500 milliseconds; echo time [TE], 15 milliseconds; slice thickness, 5.0 mm; field of view, 200 × 200 mm; matrix size, 256 × 256).
The fMRI/1H-MRS session was performed between 7 and 11 am after standard hours of sleep and a standard meal. Functional MRI was used to localize the site of activation, and functional 1H-MRS was used to monitor lactate levels (Ross and Bluml, 2001) while the subjects either silently listed numbers (baseline) or performed the verbal fluency test (stimulus-activation). The fMRI/1H-MRS session started with fMRI (3 minutes, 37 seconds), followed by the 1H-MRS baseline measurement (10.5 minutes). The 1H-MRS stimulus-activation data were collected in three consecutive 10.5-minute stimulation blocks immediately after the baseline. Functional MRI was repeated at the end of the session. The total duration of one fMRI/1H-MRS session was 90 minutes. One of the potential 24 fMRI measurements could not be performed because of technical reasons, for a total of 23 fMRI measurements; in 1H-MRS, 46 of the designated 48 measurements were successfully obtained.
Functional magnetic resonance imaging
The fMRI was performed using a T2∗-weighted gradient-recalled echo planar imaging sequence (repetition time, 3,000 milliseconds, TE = 60 milliseconds, matrix size 64 × 64). The field of view, slice positioning, and thickness were the same as for the T1-weighted images. During an fMRI, 72 volumes of 7 slices were acquired. To position the voxel for MRS, the fMRI analysis was performed using the FuncTool software (GE Medical Systems). The results obtained from FuncTool analysis were later confirmed by analyzing the data using the SPM99 package (Wellcome Department of Cognitive Neurology, London, UK). In the SPM99 analysis, the first and last two volumes were discarded, and functional images were realigned. The data were spatially smoothed using a Gaussian filter with full width at half maximum of 6.0 × 6.0 × 10.0 mm. High-pass filter with a cutoff of 126 seconds was used, and temporal low-pass filtering was performed using a Gaussian filter with full width at half maximum of 4 seconds. The analysis included convolution of the boxcar function (cycles of 30 seconds rest/30 seconds activation) with a synthetic hemodynamic response function to create a model response function. Corrected threshold of P < 0.05 was used for the statistical parametric maps (t-statistics). The locations of activated areas obtained with the FuncTool analysis agreed with those obtained using the SPM99 package.
Proton magnetic resonance spectroscopy
Four single-voxel 1H-MRS measurements were performed using a point-resolved spectroscopy sequence, (PROBE-P, GE Medical Systems, Milwaukee, WI, U.S.A.) with a repetition time of 1,500 milliseconds, a TE of 288/144 milliseconds, 400 acquisitions, outer volume spatial saturation pulses, and water suppression. Prior to the 400 water-suppressed acquisitions, the spectroscopy sequence automatically measured an unsuppressed spectrum using 16 acquisitions resulting in a total duration of ≈10.5 minutes for one 1H-MRS measurement. The spectral width was 2,500 Hz and the number of acquired points was 2,048. The first spectrum was recorded with baseline condition (number listing task) and the following three with stimulus-activation (silent word generation). The voxel size (6.9 ± 0.2 cm3) and location were individually selected to cover the activated area (Fig. 1D). A TE of 288 milliseconds was selected to suppress potentially overlapping signals from macromolecules and lipids with short T2 (Fig. 2). A TE of 288 milliseconds allows the possibly leaking lipid signals from bone marrow or subcutis to decrease to 0.3% of the original signal strength, while lactate signal decreases only to 56%, using reported T2 values of lipids and lactate of 50 milliseconds and 500 milliseconds (Serrai et al., 2000). Before the actual experiments were performed, we made a series of pilot measurements to test the magnitude of the lactate response in relation to the duration of the stimulation, with either 5 or 10 minutes of MRS data acquisition, and chose the 10-minute acquisition for the experiments because it performed better. The spectra recorded with TE of 144 milliseconds were used to confirm identification of lactate through inversion of the peak (Fig. 3).
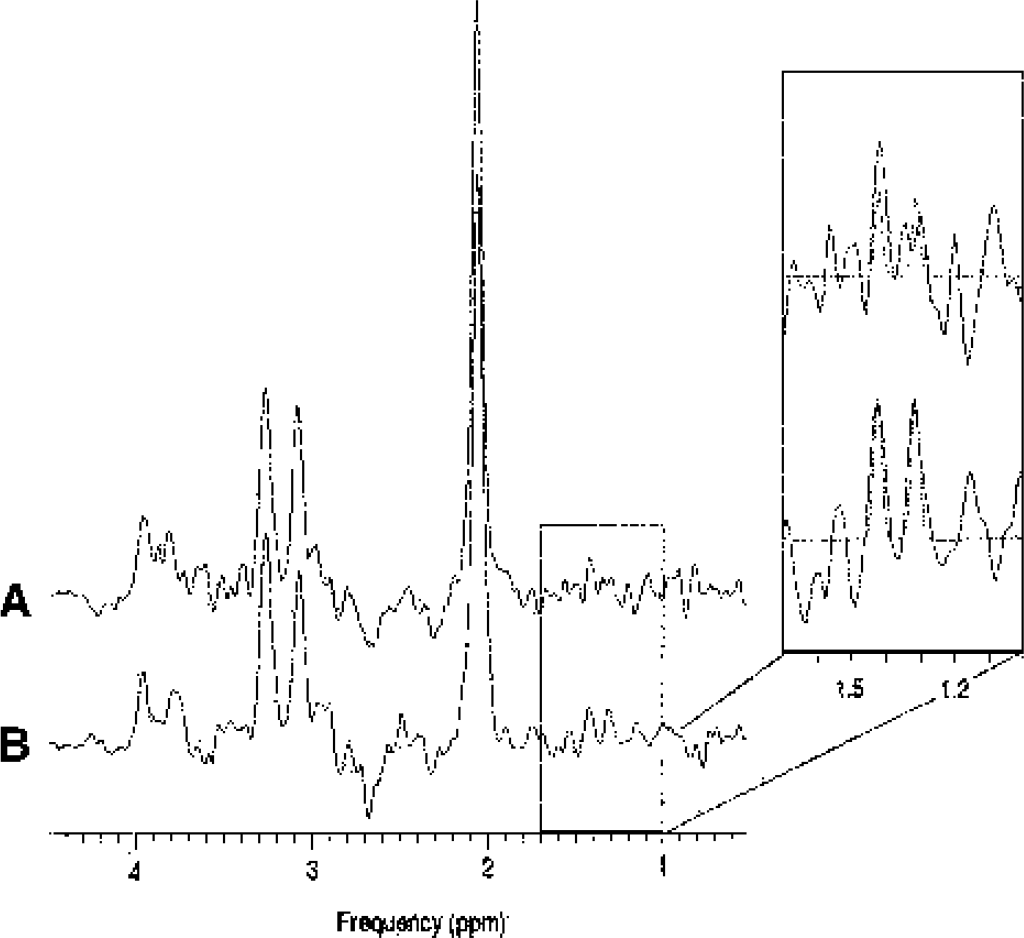
The 1H-MR spectra collected from one subject during
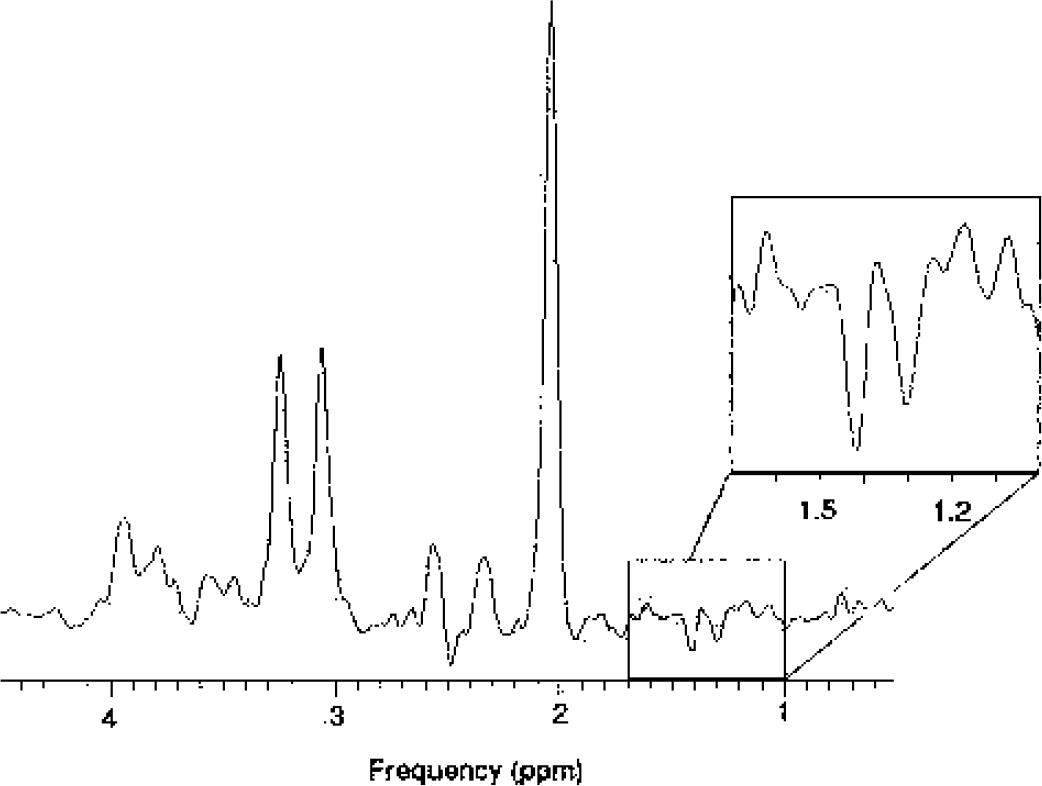
An 1H-MR spectrum collected during silent word generation (TE = 144 milliseconds). The inversion of the lactate peak was used to confirm identification of the lactate signal. Enlarged is the 1.0 to 1.7 ppm region of the spectrum with the inverted lactate peak.
The spectra were processed and analyzed using SAGE software (GE Medical Systems, Fremont, CA, U.S.A.). The free induction decay signal was apodized using a Gaussian function (Gaussian broadening of 2 Hz), zero filled, and Fourier transformed. The residual water signal was suppressed by a 60-Hz convolution filter. The intensity of N-acetyl-aspartate (2.02 ppm), creatine and phosphocreatine (Cr) (3.03 ppm), and choline-containing compounds (3.22 ppm) signals were determined using Lorentzian lineshape fitting. As a prior knowledge for lactate doublet fitting, coupling constant of 7 Hz and chemical shift of 1.33 ppm were used. Because of the restricted resolution (0.6 Hz/point after zero fill), the chemical shift of lactate was allowed to vary by ±1 Hz (∼ 0.016 ppm) during the fitting process (Fig. 4). Because the line widths of metabolites did not change during individual sessions, the line width was fixed and the amplitude was used for lactate determination. If lactate signal-to-noise ratio (noise regions: −5.7 to −1.0 ppm, 0.9 to 1.2 ppm, 1.5 to 1.8 ppm, and 9.0 to 13.7 ppm) was lower than two, the root mean square noise was used as the lactate value in calculations.
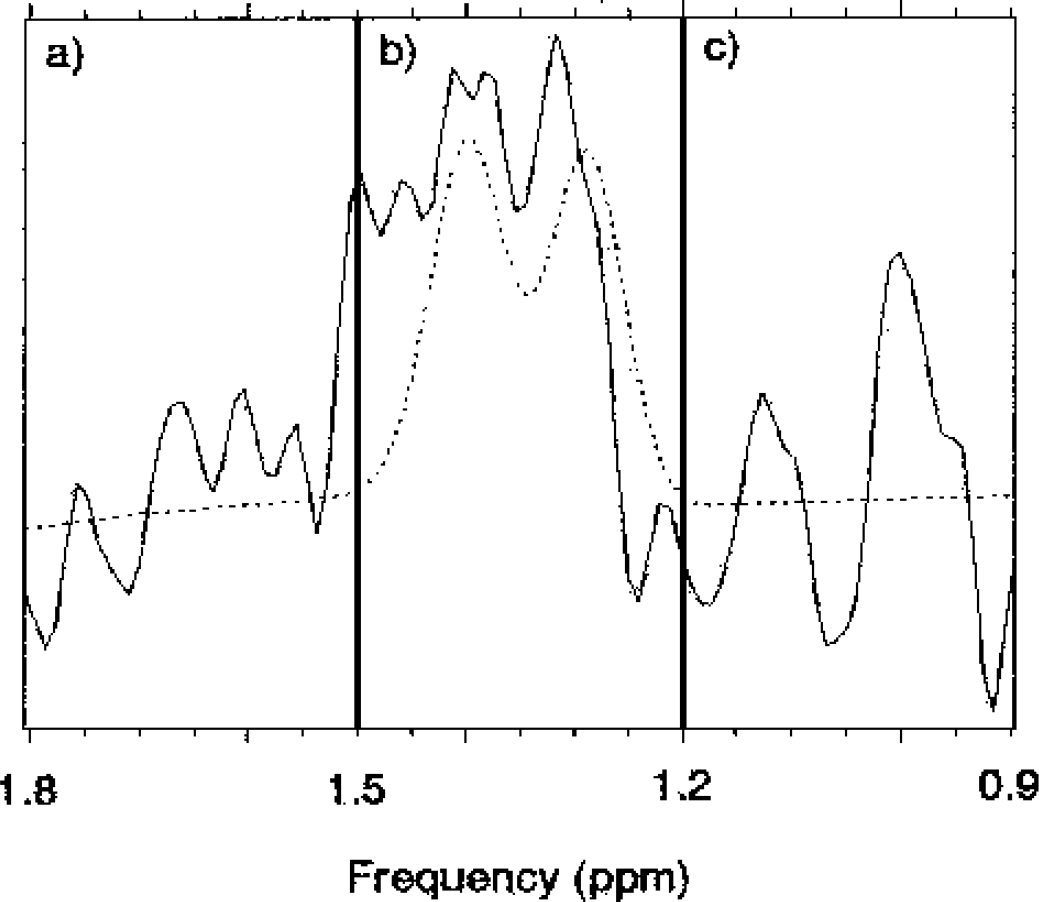
Details of the lactate signal fitting and the noise calculations. To avoid fitting the noise, the chemical shift of the lactate signal was allowed to vary by ±1 Hz (∼ 0.016 ppm) during the fitting process only when the lactate signal-to-noise ratio was 2 or more in four regions: two 300-Hz-wide regions (−5.7 to −1.0 and 9.0 to 13.7 ppm) and two shorter regions surrounding the lactate signal. The lactate signal located in region b (1.2–1.5 ppm, amplitude of the presented signal is 220) and the noise surrounding lactate was calculated from regions a (1.5–1.8 ppm, amplitude 60) and c (0.9–1.2 ppm, amplitude 70). The root mean square value of the spectrum shown is 80.
RESULTS
Activated brain areas
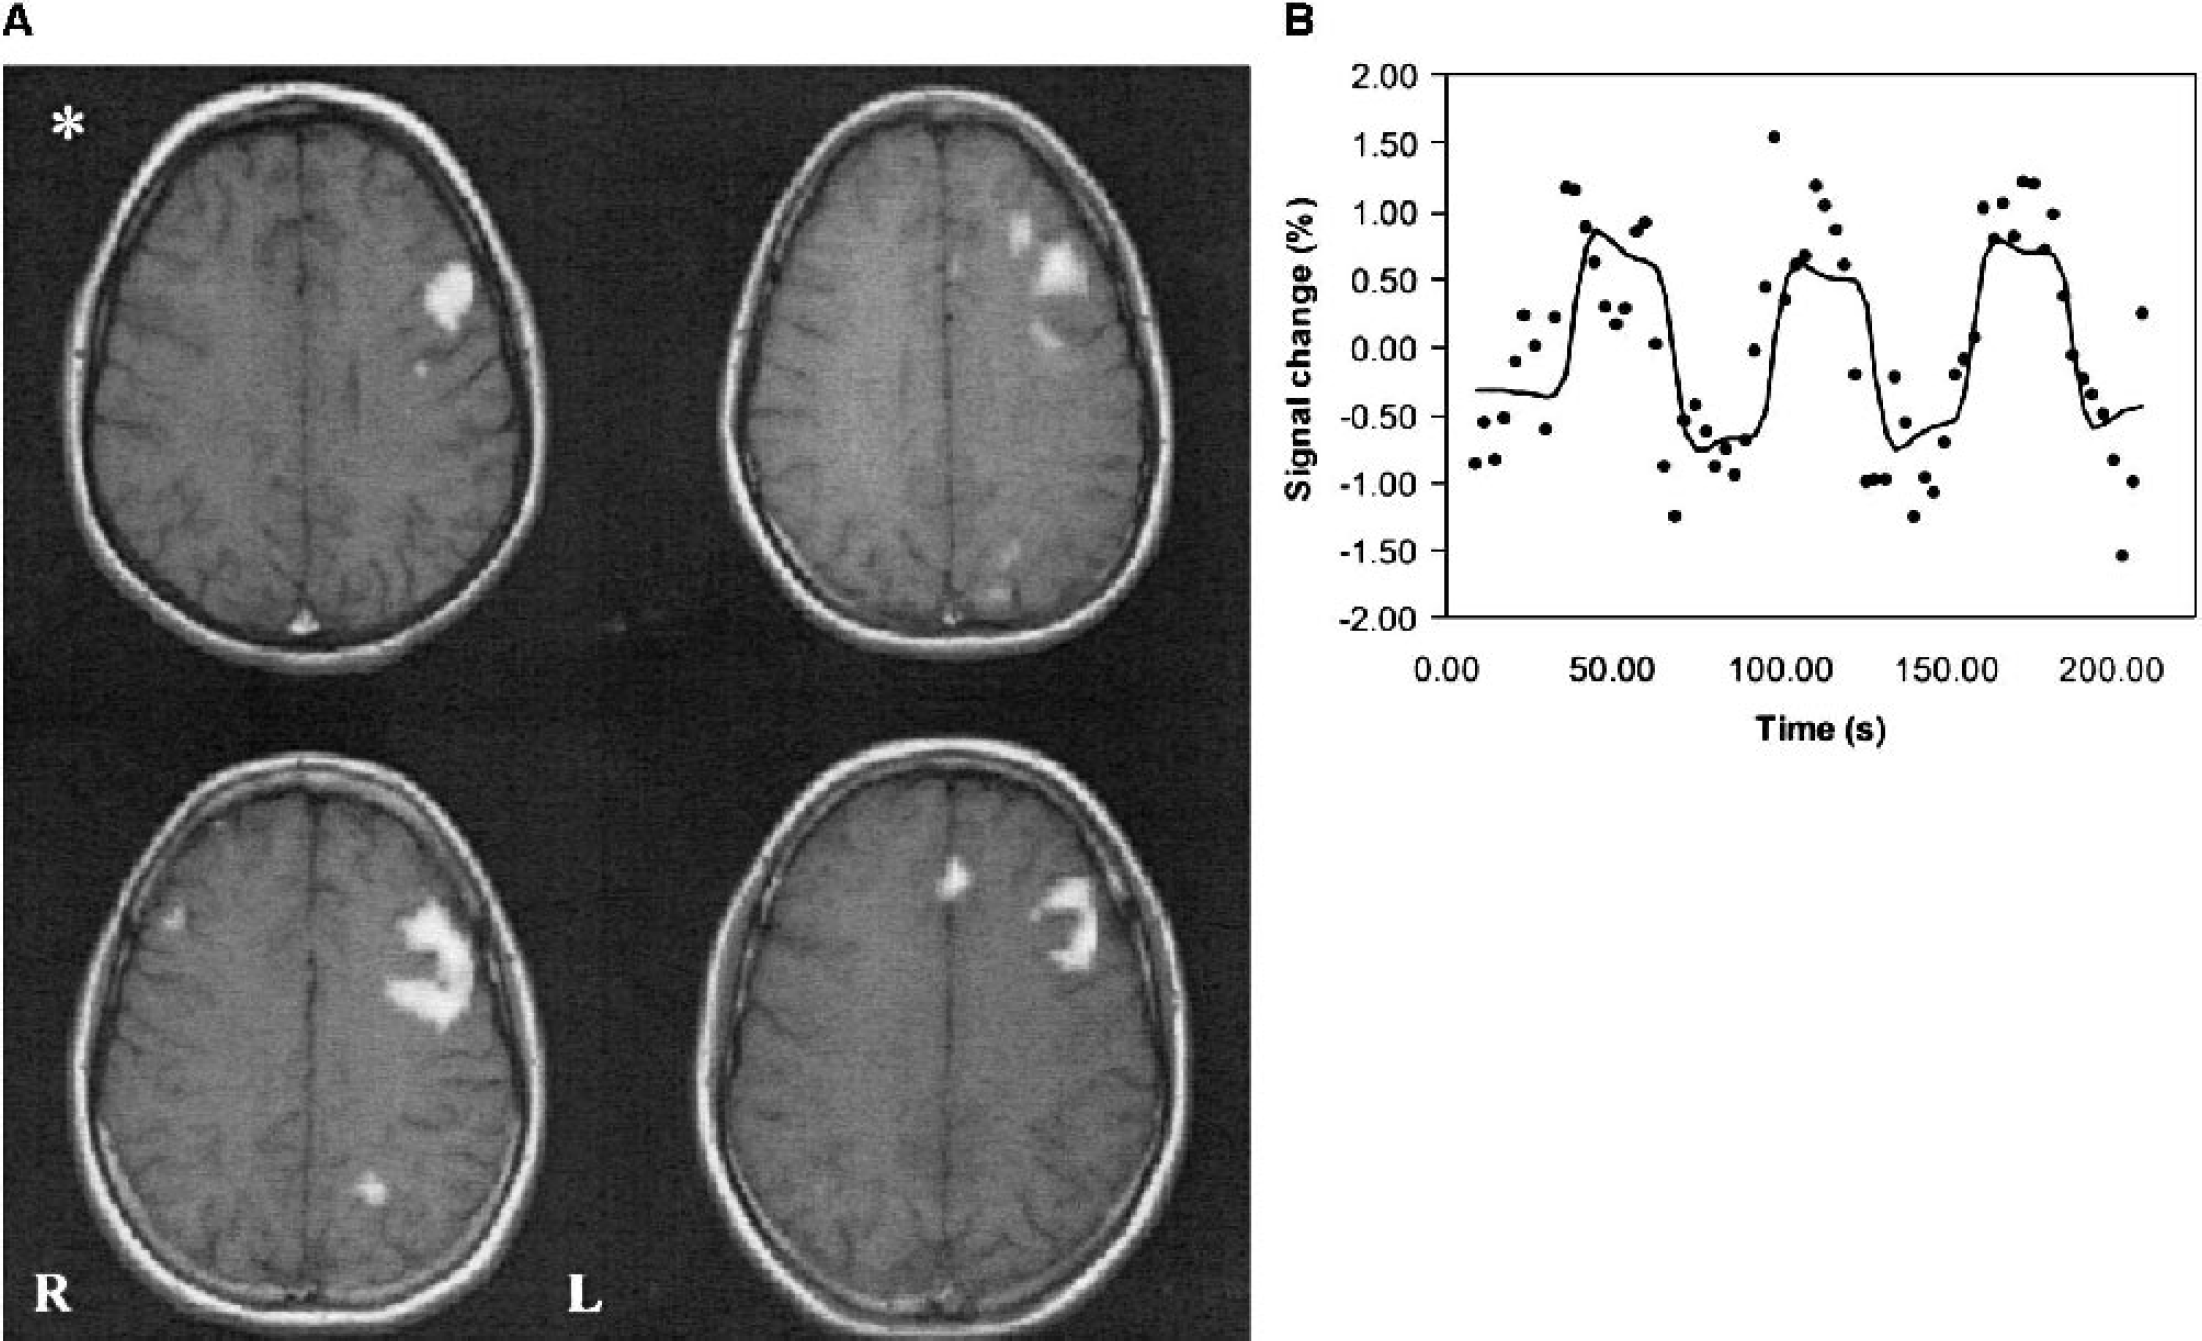
During the baseline task there was no activation in the left inferior frontal gyrus (Fig. 1A), whereas during the silent word-generation test, several brain areas became activated in fMRI. The largest and most consistent activation appeared in the left inferior frontal gyrus (Brodmann area [BA] 44, Broca's area), extending posteriorly up to the precentral gyrus (BA 6). The anterior cingulate gyrus was activated in all subjects, and the visual cortex was activated in 6 of the 12 subjects. In addition, minor activations in various parts of the left frontal lobe were observed. We chose the left inferior frontal gyrus as the volume of interest for the 1H-MRS data collection (Fig. 1D). The exact location, area/volume, and form of the activation in Broca's area varied somewhat from subject to subject (Fig. 5A). Fig. 5B presents the fMRI-signal time course and fitted response of a single pixel from the activated area from the subject marked with an asterisk in Fig. 5A.
Brain lactate
During the first 10.5-minute period of silent word generation, lactate levels increased 54% from baseline in all subjects (112 ± 39 [n = 12] versus 158 ± 50 [n = 12]; paired t-test, P< 0.050; Fig. 2 and Fig. 6). During the second and third stimulus-activation periods, the lactate values remained increased from baseline, but the differences did not reach statistical significance (112 ± 39 [n = 12] versus 130 ± 60 [n = 11] and 134 + 67 [n = 11]; paired t-test). In the baseline measurements, lactate signal-to-noise ratio was 2 or above in 5 of the 12 subjects. During stimulus-activation, a lactate signal with a signal-to-noise ratio of 2 or more was measured in 9 of 12 subjects.
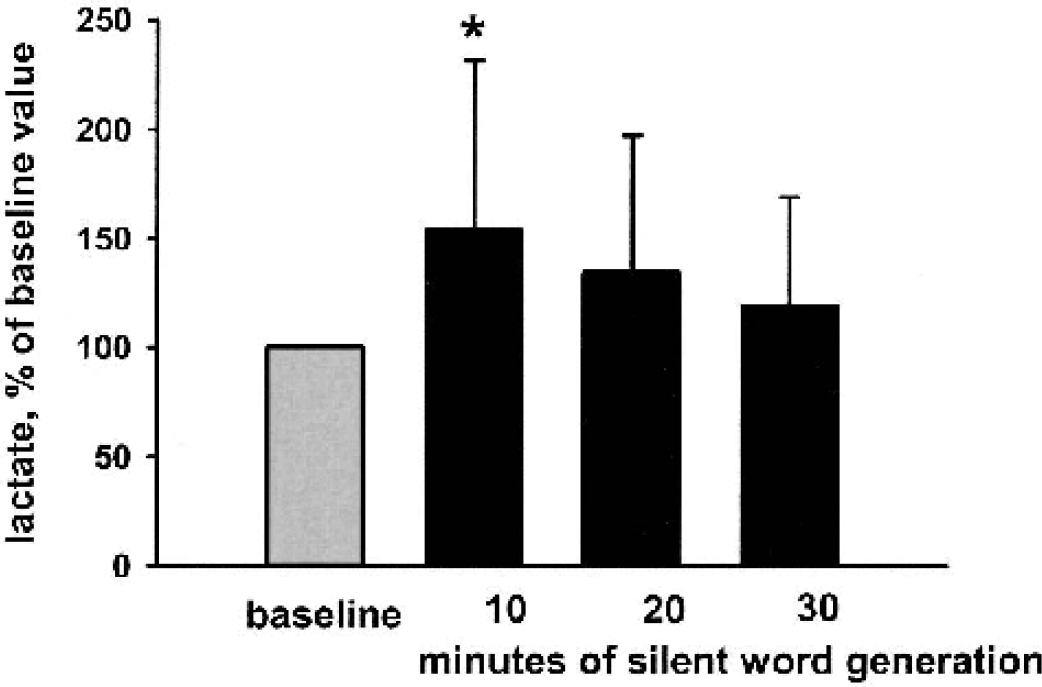
Lactate levels presented as bar drafts in the unstimulated and stimulated brain measured by 1H-MRS (mean + SD, n = 12 in baseline and first silent word-generation period; n = 11 in the latter two silent word-generation periods). The lactate amplitudes are expressed as percentages of the baseline value. The asterisk denotes a significant difference (paired t-test, P <0.05) between baseline and the first 10.5-minute silent word-generation period.
DISCUSSION
Silent word generation and activated brain areas
During the silent word-generation test, the left inferior frontal gyrus (BA 44), precentral gyrus (BA 6), and the anterior cingulate gyrus (BAs 24 and 32) were activated in all subjects. Activation of these areas has been observed in previous studies (Friedman et al., 1998; Phelps et al., 1997; Pihlajamäki et al., 2000; Schlösser et al., 1998). The 1H-MRS voxel was positioned to cover the activation found in the inferior frontal gyrus (BA 44). BA 44 (Broca's area) is conventionally thought to subserve motor programming of speech (Broca, 1861), but neuronal activation of this area has been noted during motor programming of speech even without overt movement (Friedman et al., 1998; Pihlajamäki et al., 2000; Schlösser et al., 1998). The premotor cortex (BA 6) is involved in the planning of motor responses related to articulatory processes (Pujol, 1996). Activation of the anterior cingulate cortex may be related to the attentional demands of the activation task (Pardo, 1990).
We chose to perform the word-generation test silently to avoid movement artefacts and interfering activation of the motor cortical areas during speech. Moreover, previous studies have shown that silent performance of the verbal fluency task produces a greater fMRI signal than when the task is verbalized (Yetkin, 1995). The potential disadvantage of using silent word generation is that the task performance cannot be directly controlled for. Therefore, fMRI was used also to monitor the task performance: the subjects were unaware of the timing of the fMRI measurements while they continued to perform the tasks according to the instructions given via headphones. The activation in the fMRI confirmed that the task was actually being performed. The 2-minute tape-recorded session after fMRI/1H-MRS further controlled for the ability and compliance of the subjects to perform the test.
Brain lactate
Basal brain lactate levels in healthy subjects are low, and do not vary in the course of the day or even after extensive physical training (Merboldt et al., 1992). However, several stimuli have been reported to induce temporary increases in brain lactate levels. In humans, visual stimulation induced a 50% to 150% increase in the level of lactate (Frahm et al., 1996; Prichard et al., 1991; Sappey-Marinier et al., 1992). In rats, the increase in brain lactate levels during electrical stimulation was 30% to 100% (Hu and Wilson, 1997; Kuhr and Korf, 1988; Ueki et al., 1988), while gentle stroking of the face, whiskers, and different parts of the body induced a 90% increase (Madsen et al., 1999). The present study shows that cognitive stimulation also induces an increase in brain lactate levels.
Specific sensory or motor functions can be associated with well-defined anatomical loci, whereas cognitive tasks require integrated actions of neural networks (Kupfermann, 1991). It can be anticipated that tasks requiring complicated activations would cause a diffuse and more modest increase in lactate levels than the more focused sensory or motor activations. Auditory, phonemic, visual, orthographic, and semantic processes as well as attention, memory, and motor programming of subvocal speech may be involved simultaneously during the performance of a silent word-generation task (Friedman et al., 1998). The observed 50% increase in lactate during cognitive stimulation is reasonable when compared to increases measured with visual stimulation (Frahm et al., 1996; Prichard et al., 1991; Sappey-Marinier et al., 1992).
Estimations of the baseline lactate concentrations in the present study ranged from below detectability (<0.3 mmol/L) (Merboldt et al., 1992) to 2.25 mmol/L if a reference concentration of 9.6 mmol/L for Cr (Prichard et al., 1991) was used. Accordingly, the baseline lactate levels measured in the present study are similar to those measured in previous studies and are also in agreement with the 1-mmol/L detection limit of lactate (Prichard et al., 1991).
The maximum rise in lactate was measured during the first 10.5 minutes of the silent word-generation test, and lactate levels tended to decline thereafter. With photic stimulation, the lactate level peaks after 2.5 minutes of stimulation (Frahm et al., 1996), whereas there is a decline during the later part of the stimulation period (Frahm et al., 1996; Prichard et al., 1991; Sappey-Marinier et al., 1992). It remains to be clarified whether this difference in timing of the maximal lactate response is due to the complex nature of the cognitive stimulus, to lack of adaptation as compared with stimulation of the sensory system (Sappey-Marinier et al., 1992), or to some other mechanism, such as individual fluctuations in the performance of the task due to changes in attention and motivation.
The increase in the lactate level on stimulation coincides with the growing energy demand of increased neuronal activity (Magistretti and Pellerin, 1999). Glutamate cycling couples the brain's energy demand to the rate of neuronal firing (Sibson et al., 1998). The origin and exact role of lactate in the course of stimulation are not clear. According to the classical view, oxidation of glucose would be the main source of energy in the brain, while lactate, produced by anaerobic glycolysis, would be used as an energy source only under pathological conditions involving hypoxia (Siesjö, 1978). However, more recent studies have revealed that neurons use lactate as their energy source also under normoxic conditions, and may even prefer it to glucose during neuronal activation (Magistretti and Pellerin, 1997; Shulman et al., 2001). Glucose is metabolized to lactate in astrocytes and transferred to neurons, where lactate dehydrogenase converts it to pyruvate, which is further oxidized to produce ATP. Increased neuronal firing may stimulate the use of lactate as a neuronal fuel, leading to an elevation in the lactate level (Magistretti et al., 1997). Another possible mechanism of lactate elevation would be the glycogen shunt, where glucose is rapidly metabolized from glycogen in astrocytes (Shulman et al., 2001). In this scenario, the energy required for the clearance of glutamate is provided by anaerobic glycolysis in astrocytes to produce two molecules of ATP and lactate (Shulman et al., 2001). The ATP is used for the glutamate clearance, whereas the two lactate molecules are oxidized in neurons. As neuronal firing increases, more glutamate is released. To support the increased energy demand of the increased glutamate clearance, astrocytes metabolize glycogen. As the metabolic rate is regulated by the glutamate clearance, an excess of lactate is produced, as indicated by the increased lactate level. The finding that tactile stimulation in rats decreased glycogen levels while lactate levels were increased supports this view (Madsen et al., 1999).
Because the present study did not involve hypoxic conditions, we believe that the elevation of lactate is a physiologic process that is normally involved in neuronal activation. Most types of stimulation are accompanied by the increase of lactate levels. Studying the lactate response in the stimulated brain area could be used to assess disturbances of brain function. Abnormal brain lactate levels have already been successfully detected with 1H-MRS in dyslexic children (Richards et al., 1999, 2000).
In conclusion, these results show that metabolism of neuronal activity related to cognition can be assessed with 1H-MRS, a method that offers intriguing ways to study the biochemical responses of human cognition (Balaban et al., 1995).