
Abstract
During the prolonged metabolic depression after traumatic brain injury (TBI), neurons are less able to respond metabolically to peripheral stimulation. Because this decreased responsiveness has been attributed to circuit dysfunction, the present study examined the metabolic, neurochemical, and histologic responses to direct cortical stimulation after lateral fluid percussion injury (LFPI). This study addressed three specific hypotheses: that neurons, if activated after LFPI, will increase their utilization of glucose even during a period of posttraumatic metabolic depression; that this secondary activation results in an increase in the production of lactate and a depletion of extracellular glucose; and that because cells are known to be in a state of energy crisis after traumatic brain injury, additional energy demands resulting from activation can result in their death. The results indicate that stimulating to levels eliciting a vibrissa twitch resulted in an increase in the cerebral metabolic rate for glucose (CMRglc; μmol·100 g−1·min−1) of 34% to 61% in the sham-operated, 1-hour LFPI, and 7-day LFPI groups. However, in the 1-day LFPI group, stimulation induced a 161% increase in CMRglc and a 35% decrease in metabolic activation volume. Extracellular lactate concentrations during stimulation significantly increased from 23% in the sham-injured group to 55% to 63% in the 1-day and 7-day LFPI groups. Extracellular glucose concentrations during stimulation remained unchanged in the sham-injured and 7-day LFPI groups, but decreased 17% in the 1-day LFPI group. The extent of cortical degeneration around the stimulating electrode in the 1-day LFPI group nearly doubled when compared with controls. These results indicate that at 1 day after LFPI, the cortex can respond to stimulation with an increase in anaerobic glycolysis; however, this metabolic response to levels eliciting a vibrissa response via direct cortical stimulation appears to constitute a secondary injury in the TBI brain.
Keywords
Cerebral metabolic (glucose and oxygen) depression is a common finding after many types of experimental brain injury, including fluid percussion (Dietrich et al., 1994; Ginsberg et al., 1997; Hovda et al., 1991; Jiang et al., 1999, 2000; Moore et al., 2000; Yoshino et al., 1991, 1992), as well as after human traumatic brain injury (TBI;Bergsneider et al., 2000; Yamaki et al., 1996). Specifically, after a lateral fluid percussion injury (LFPI) in the rat, the brain exhibits a prolonged decrease in glucose utilization as well as a reduction in the capacity to use oxygen lasting for up to 10 days (Ginsberg et al., 1997; Hovda et al., 1991; Yoshino et al., 1991). The significance of this postinjury period of metabolic depression is not well understood. Cells may be unable to respond to physiologic levels of stimulation due to metabolic dysfunction, denervation, or disconnectivity. In support of this, neurobehavioral deficits have been correlated with postinjury metabolic depression (Colle et al., 1986; Hovda, 1996; Moore et al., 2000; Wagner et al., 1990).
In an effort to determine if neurons can be activated during this injury-induced metabolic depression, investigators have used peripheral stimulation in an attempt to activate somatosensory pathways (e.g., vibrissa stimulation to activate cortical barrels within the somatosensory cortex) and map the degree and extent of glucose metabolism using [14C]2-deoxy-D-glucose autoradiography as an indicator of neuronal response. In general, these studies indicate that the metabolic responsiveness to somatosensory circuit activation is remarkably attenuated acutely after global ischemia (Dietrich et al., 1986; Ueki et al., 1988), acute thrombotic infarction (Ginsberg et al., 1989), and LFPI (Dietrich et al., 1994; Passineau et al., 2000).
To avoid this issue of disrupted subcortical connectivity, we utilized direct cortical stimulation and verified connectivity by a corresponding motor response. An example of this type of activation paradigm is direct electrical stimulation of the vibrissa representation area of motor cortex, which elicits a large-amplitude vibrissa response contralaterally and a smaller response ipsilaterally (Sharp and Evans, 1982). Stimulation of this region also elicits bilateral increases in [14C]2-deoxy-D-glucose (2-DG) uptake in many cortical and subcortical structures in the unanesthetized rat. Similar studies comparing the effect of anesthesia have yet to be conducted, particularly after TBI. However, given that general anesthesia would result in a reduction in both glucose and oxidative metabolism, anesthesia may itself attenuate the amount of 2-DG uptake in response to stimulation.
In studies where there has been some doubt regarding whether autoradiographic evidence of 2-DG uptake represents the cerebral metabolic rate for glucose (CMRglc; μmol·100 g−1·min−1), investigators have measured extracellular lactate. These strategies have been used extensively in various models of TBI where the reported injury-induced hyperglycolysis has been confirmed through the observation that lactate levels increase by 120% to 600% over baseline levels for several hours or even days after injury. Currently, however, there are no reports attempting to determine the production of lactate as a result of physiologic activation after experimental TBI as an indication of glycolysis, which may suggest a secondary injury. Secondary injuries such as ischemia, hypoxia, and hypotension have been shown to exacerbate lesion size and neuronal cell loss after TBI (Bramlett et al., 1999; Cherian et al., 1996; Ishige et al., 1987; Jenkins et al., 1989; Matsushita et al., 2001; Nawashiro et al., 1995). Furthermore, there is evidence of exacerbating cortical damage after forced use of the affected forelimb after unilateral electrolytic sensorimotor cortex lesion (Kozlowski et al., 1996) or after motor training after focal cerebral ischemia (Risedal et al., 1999).
It is possible that secondary activation to the brain after trauma can also constitute a secondary injury. This concept was evaluated via three specific hypotheses. First, neurons, if activated after LFPI, will increase their utilization of glucose even during a period of general (both oxidative and glycolytic) posttraumatic metabolic depression. Second, that this “secondary activation” results in an increase in the production of lactate and a depletion of extracellular glucose. Finally, because cells are known to be in a state of energy crisis after TBI, additional energy demands resulting from activation can result in their death. To determine if the injured cerebral cortex can respond metabolically to activation and to evaluate its consequence on cell survival, direct cortical stimulation at an intensity sufficient to induce an appropriate motor response was studied after LPFI. Comparisons of the cortical metabolic response (using [18F]-fluorodeoxyglucose autoradiography) to vibrissa motor cortex stimulation in LFPI and sham-injured animals were made both in terms of CMRglc and volumes of activated tissue. To determine the neurochemical response to this postinjury activation, microdialysis (MD) was utilized to measure changes in extracellular glucose and lactate concentrations. Finally, the cellular consequence of this postinjury activation was determined using cresyl violet histology to characterize lesion volumes associated with direct cortical stimulation after LFPI and sham injury.
MATERIALS AND METHODS
Subjects
A total of 64 adult male Sprague-Dawley rats were used for this study. Forty-four animals were used for [18F]-fluorodeoxyglucose (FDG) autoradiography studies of which 24 were subjected to LFPI (weight mean = 326.8 + 59.31 g) and were randomly divided into 8 experimental groups: 1-hour LFPI/stimulated (n = 5), 1-day LFPI/stimulated (n = 5), 7-day LFPI/stimulated (n = 5), sham/stimulated (n = 15), 1-hour LFPI/nonstimulated (n = 3), 1-day LFPI/nonstimulated (n = 3), 7-day LFPI/nonstimulated (n = 3), and sham/nonstimulated (n = 5). Twenty animals were used for microdialysis studies and were randomly divided into 3 experimental groups: 1-day LFPI/stimulated (n = 7), 7-day LFPI/stimulated (n = 8), and sham/stimulated (n = 5). The 1-hour LFPI time point was not included in the microdialysis studies due to the confounding effects of LFPI alone on neurochemical changes immediately after injury. All experimental procedures were approved by the UCLA Chancellor's Committee for Animal Research.
Lateral fluid percussion injury
After anesthesia induction in a chamber with 4% isoflurane (in 100% oxygen), the head was secured in a stereotaxic frame. Anesthesia was then reduced to 1.5% to 2% isoflurane (in 100% oxygen), and body temperature was maintained at 37°C with a homeothermic heating pad (Harvard Apparatus Limited, Edenbridge, KY, U.S.A.). All surgical areas were shaved and bathed with alcohol followed by Betadine.
A midline incision was made to expose the pericranium. Under an operating microscope (Wild, Heerbrugg, Switzerland), a 3-mm-diameter craniotomy was made centered at 3 mm posterior to bregma and 6 mm left of midline, using a high-speed drill (Dremel, Racine, WI, U.S.A.). The skull adjacent to the craniotomy was thoroughly dried, and a plastic injury cap was affixed over the craniotomy using silicone adhesive, cyanoacrylate, and dental cement. When the dental cement was completely hardened, the injury cap was filled with 0.9% saline. Anesthesia was discontinued, and the animal was attached to the fluid percussion device.
The fluid percussion device has been previously described in detail (Dixon et al., 1987; McIntosh et al., 1989). At the first sign of hindpaw withdrawal reflex, elicited by a toe pinch, a mild-moderate fluid pulse was administered. The device delivered a 2.31-atm to 3.06-atm fluid pulse (depending on the settings) into the epidural space over a transient (20 millisecond) time interval. After the injury, apneic time was determined by the resumption of spontaneous respiration, and loss of consciousness time was determined by the return of the same hindpaw withdrawal reflex. If no spontaneous respiration was evident by 30 seconds, manual chest compressions and 100% oxygen were administered until spontaneous respiration began. Return of consciousness was assessed by pinching the hindpaw at 15-second intervals. Upon the return of the hindpaw withdrawal reflex, the animal was reanesthetized for removal of the injury cap and closure of the surgical wound. Topical lidocaine and antibiotic ointment were applied to the wound, and the animal was placed on a heating pad in a recovery chamber. After approximately 1 hour, each animal was returned to its home cage. Animals assigned to the sham-injury groups underwent the same surgical preparation as previously described, but without the fluid percussion injury. Animals in the 1-hour sham and LFPI groups were prepared for vibrissa motor cortex stimulation immediately after injury.
Vibrissa motor cortex stimulation, autoradiography, and microdialysis
On the day of stimulation studies, animals were reanesthetized with isoflurane (4% induction, followed by 1.5% to 2% maintenance) for cannula placement. PE-50 cannulas were placed in the femoral artery and femoral vein of all animals. Animals were allowed to awaken briefly from isoflurane anesthesia before injection with urethane anesthesia.
Animals were anesthetized with 50% urethane (0.15 mL/100 g body weight, administered intravenously) and placed in a stereotaxic frame. Supplemental doses of 50% urethane (0.3 mL/100 g body weight) were intravenously administered as needed to all animals throughout the stimulation period. The use of urethane assured better success in maintaining animals under general anesthesia for the length of time required for conducting the experimental procedures while having little effect on the cerebral blood flow response to neuronal activation. A midline incision was made, and a 3-mm-diameter craniotomy was made centered at bregma and 2 mm left of midline.
In the FDG group, a bipolar electrode was slowly lowered into the vibrissa motor cortex to a target depth of 1.5 mm. Proper electrode placement was verified by visual inspection of the vibrissa response. Stimulation (100 to 200 μA, 100-millisecond pulses, 0.3 Hz, 30 to 100 mV) was initiated immediately before injection of FDG and was maintained for a duration of 30 minutes. The voltage used for each individual animal was twice the threshold needed to elicit visible vibrissa response (Table 1). This “suprathreshold” stimulation was used because it has been shown to consistently evoke movement and elicit electromyographic activity (Nudo et al., 1990). In a small subset of animals (seven sham operated, one 1-hour LFPI, three 1-day LFPI, three 7-day LFPI), the voltage was increased to maintain this amplitude of vibrissa response. This increase was between 6% and 40% from the voltage used to initially start the experiment (beginning voltage), with no animal receiving more than 80 mV. The need for these few adjustments is not surprising because vibrissa movements tend to “wax and wane” in some animals (Nudo et al., 1990).
The voltage (mean ± SD) used at the beginning and end of each stimulation session ∗
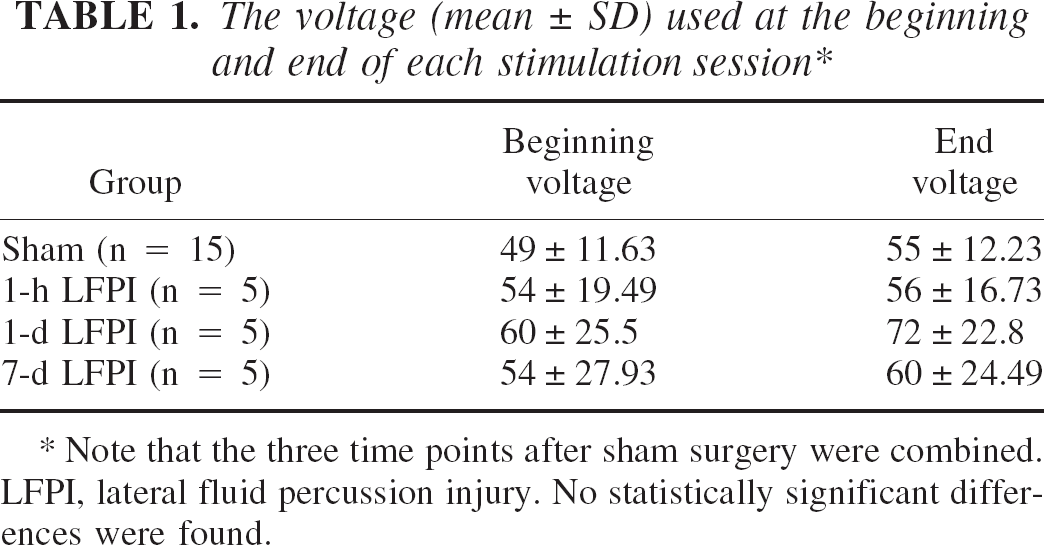
Note that the three time points after sham surgery were combined. LFPI, lateral fluid percussion injury. No statistically significant differences were found.
For measurement of CMRglc (μmol·100 g−1·min−1), 1 mCi of [18F]-fluorodeoxyglucose was intravenously administered over a period of 30 seconds. Timed arterial samples were collected in heparinized microcentrifuge tubes throughout the 30-minute experiment. Blood samples were immediately placed on ice, centrifuged, and the plasma assayed for 18F activity and glucose concentration (Ultrospec II spectrophotometer, LKB Biochrom Ltd., Cambridge, U.K.). Immediately after the last blood sample was taken, the brain was quickly removed and frozen in chilled 2-methylbutane. Coronal, 20-μm frozen sections (Leica CM 1850 cryostat, Leica, Wetzlar, Germany) were processed for autoradiography along with 14C acrylamide standards. Adjacent sections were processed for cresyl violet histology. Images were scanned and optical densities within the frontal cortex and ventrolateral thalamus (in order to sample the vibrisseral corticothalamic pathway) were measured with Scion Image (Release Beta 3b, Frederick, MD, U.S.A.). Optical densities were converted to CMRglc using a modification of the operational equation originally described by Sokoloff and colleagues (1977) where the lumped constant = 0.6, K1 = 0.3, K2 = 0.9 and K3 = 0.0676.
In the microdialysis group, a bipolar electrode-guide cannula assembly was slowly lowered into the vibrissa motor cortex. This assembly was cemented together so that in all animals, the electrode penetrated 1.5 mm into the cortex, and the guide cannula rested on the dura at 2 mm lateral to the electrode. Simultaneously, a bipolar electrode was lowered into the cortex and a CMA/12 microdialysis probe (3-mm effective length; 20,000-d cut-off level; CMA/Microdialysis, Stockholm, Sweden) was lowered into the guide cannula. A CMA/100 microperfusion pump (CMA/Microdialysis) perfused normal saline at a rate of 2 μL/min. Baseline microdialysis samples were taken for 60 minutes before initiation of stimulation and for 30 minutes during the stimulation period. Microdialysis samples were collected every 10 minutes for quantification of glucose and lactate concentrations using a CMA 600 analyzer (CMA/Microdialysis). The linearity intervals ranged from 0.02 to 6 mmol/L for glucose and from 0.02to 2.5 mmol/L for lactate. Recovery efficiency of the probes was estimated by in vitro measurement of glucose concentration, and the mean ± SD recovery rate was calculated to be 12.5% ± 1.9%. The “dead volume time” of the microdialysis system was calculated to be 4.7 minutes.
To determine the physiologic state of the animals, a blood sample was taken before the start of the FDG or microdialysis studies. Blood gas (pH, Po2, Pco2) measurements were made with a gas analyzer (1304 pH/Blood Gas Analyzer, Instrumentation Laboratory, Lexington, MA, U.S.A.) and were found to be within the normal ranges.
Cresyl violet histology
Cresyl violet histology was used to determine gross morphologic damage caused by the stimulating electrode. The endpoint of interest was to measure the extent of secondary damage due to activation of the cortex. Coronal sections (20 μm) were fixed in formalin and dehydrated in a series of alcohols. Removal of lipids with chloroform, and removal of lipids and embedding medium with xylene were followed by rehydration with a series of alcohols. Sections were then incubated in cresyl violet stain, rinsed in acetic formalin, dehydrated, defatted, and coverslipped with Permount.
Data analysis
CMRglc comparisons were made between left (stimulated) and right (nonstimulated) sides in frontal cortex (between 3.2 mm anterior to bregma and 1.3 mm posterior to bregma) and in the ventrolateral thalamus (between 1.8 to 3.1 mm posterior to bregma;Paxinos and Watson, 1986). CMRglc comparisons were also made between nonstimulated animals and stimulated animals to determine the relative metabolic changes after stimulation compared to baseline. The activation area was determined by using the thresholding tool in Scion Image. Because the normal side-to-side difference in optical density in control animals (sham/nonstimulated) is approximately 9% (data not shown), an increase of 10% or more compared to the contralateral side was considered to represent activation. The total activation volume was calculated by measuring the activation area on each section and multiplying by the intervening distance between sections.
For analysis of microdialysis data, percent changes from baseline in glucose ([glucose]MD) and lactate ([lactate]MD) concentrations were calculated for each individual animal and then averaged for each group. Only the final 20 minutes of baseline and the final 20 minutes of stimulation were used for calculations to allow for equilibration after probe insertion and to correct for dead volume. To control for different recovery rates, percentage changes were used to compare neurochemical changes between animals.
The total lesion volume induced by the stimulating electrode was calculated by first measuring the affected areas on each section (two to four sections per animal) and then by multiplying this value by the intervening distance between each section. Affected areas included areas of complete cell loss and areas of reduced cell loss (areas of pallor). A second “blinded” investigator measured selected lesion areas, and a linear regression was performed to determine the reproducibility of the measurements. In order to test for the degree of reliability between the two raters, five animals were selected. The average difference in area measurements between raters was 5%, and the linear regression was statistically significant (R2 = 0.88, P ≤0.05).
Statistical analysis
Statistical analysis was accomplished using SPSS software (version 9.0, SPSS, Chicago, IL, U.S.A.). Apnea, loss of consciousness, changes in glucose and lactate concentrations, lesion volume, and input voltage were compared using a one-way analysis of variance (ANOVA). Pearson correlations were performed to determine if there was an association between apneic or loss of consciousness times and individual physiologic variables as well as to determine if there was an association between the CMRglc in the sham groups at different time points both with and without stimulation. CMRglc values were compared between sham and LFPI groups using a two-way ANOVA, with hemisphere as a within-subject factor and stimulation time point as the between-subject factor. Separate analyses were performed for stimulated and nonstimulated groups. Activation volume and CMRglc between ipsilateral and contralateral sides were compared using an independent sample t-test and a Bonferroni adjustment. Physiologic variables, changes in lactate concentration, and lesion volumes between groups based on injury were also compared using an independent sample t-test and a Bonferroni adjustment. Differences were considered significant at P ≤0.05, unless otherwise specified.
RESULTS
Apnea and loss of consciousness
Apneic and loss of consciousness times for the injured groups are provided in Table 2. The mean ± SD apneic time (resumption of spontaneous breathing; note that assisted ventilation began 30 seconds after injury if needed) ranged from 19.3 ± 13.0 to 66.3 ± 30.1 seconds. However, when testing across all groups, there was no evidence of a main effect (F7,31 = 0.67, P ≤0.70). A total of 17 animals had apnea times longer than 30 seconds and therefore received respiratory support via chest compressions. Each group had at least one animal requiring this support, with only the microdialysis groups (having the most subjects) having three to five animals requiring assistance. For all dependent measures recorded across all experiments, animals that required initial respiratory support were not different. The mean loss of consciousness time ranged from 101.7 ± 53.5 to 160.7 ± 128.7 seconds and was not significantly different between groups (F7,31 = 0.24, P ≤0.97).
Mean (±SD) apneic and loss of consciousness (LOC) times after lateral fluid percussion injury (LFPI) ∗
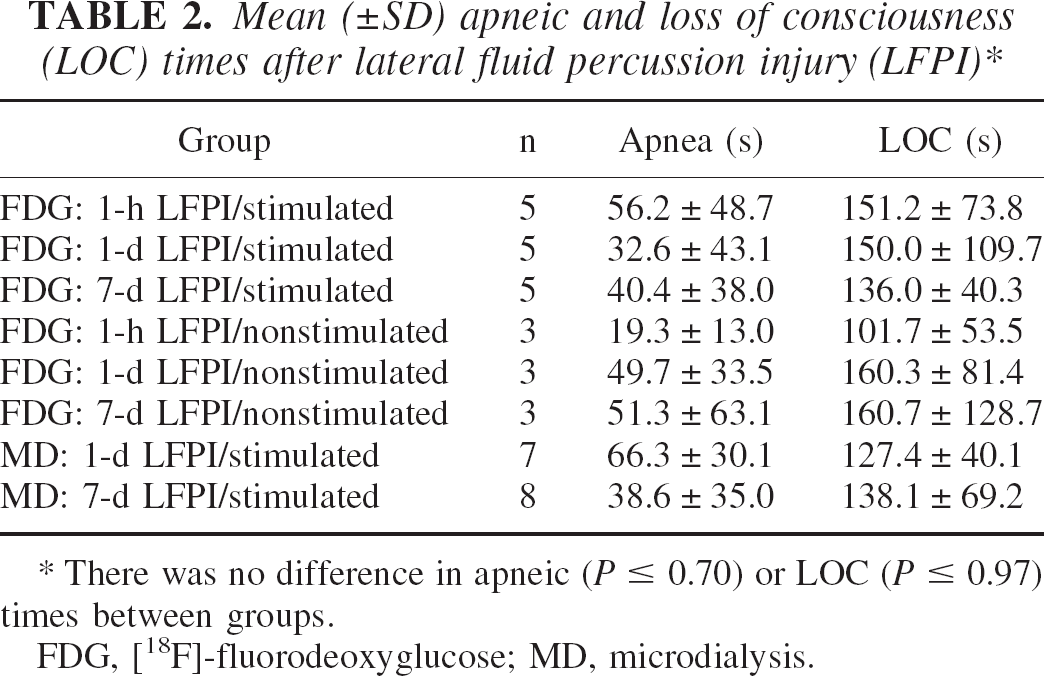
There was no difference in apneic (P ≤ 0.70) or LOC (P ≤ 0.97) times between groups.
FDG, [18F]-fluorodeoxyglucose; MD, microdialysis.
Physiologic variables
Physiologic data are provided in Table 3. The pH (mean ± SD) ranged from 7.33 ± 0.05 to 7.45 ± 0.02. The mean ± SD Pco2 ranged from 44.7 ± 4.2 to 59.0 ± 8.4 mm Hg, and the mean ± SD Po2 ranged from 419 ± 60 to 588 ± 10 mm Hg. The mean ± SD plasma glucose ranged from 1.52 ± 0.08 to 2.07 ± 0.49 mg/mL. There were no significant differences in pH, Po2, Pco2, or plasma glucose between groups based on injury.
Physiologic variables (mean ± SD), measured immediately before the start of the autoradiogrpahy (FDG) or microdialysis (MD) studies ∗
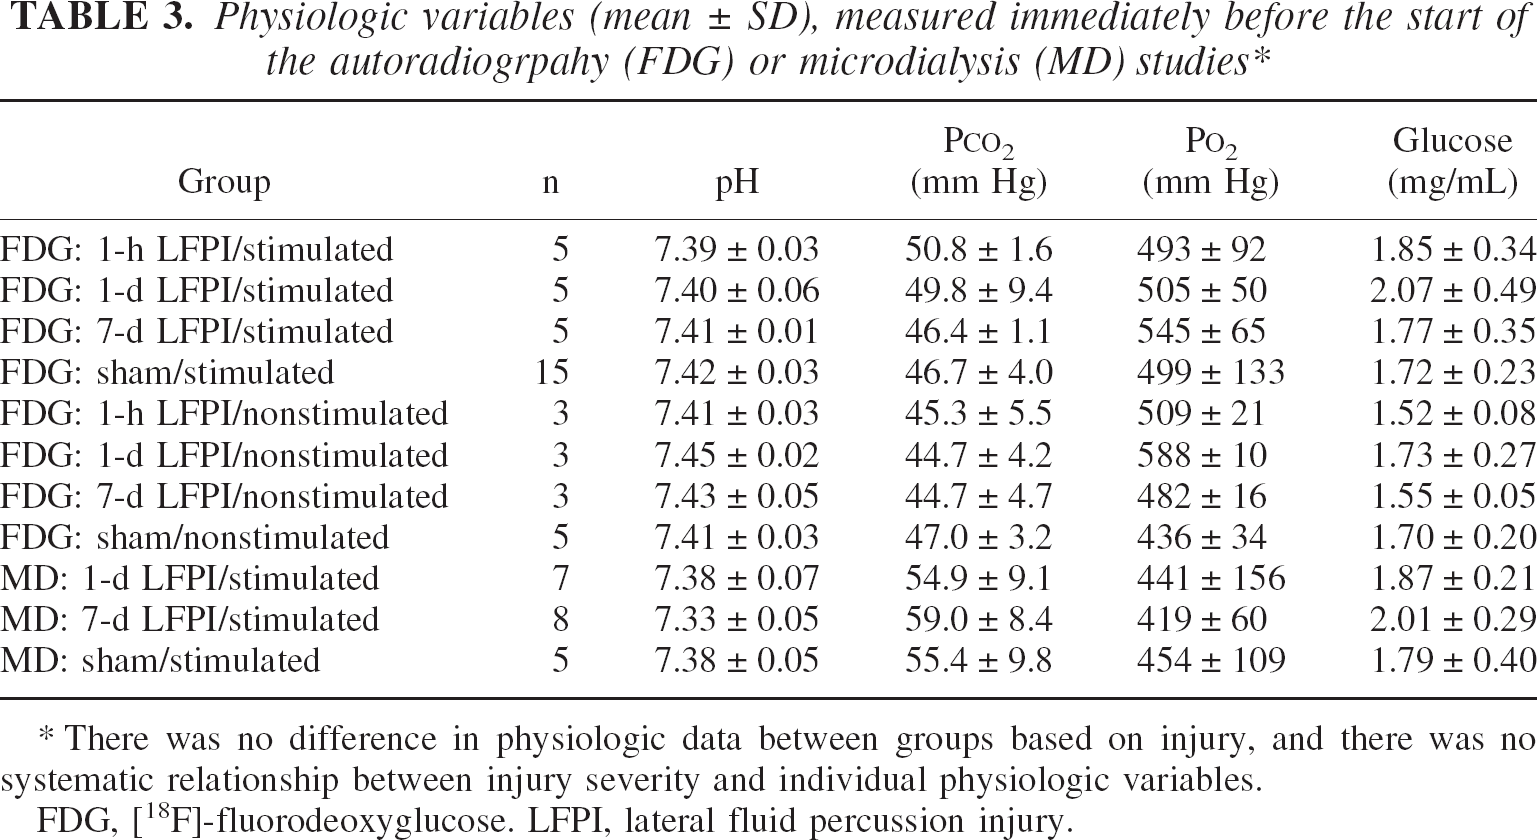
There was no difference in physiologic data between groups based on injury, and there was no systematic relationship between injury severity and individual physiologic variables.
FDG, [18F]-fluorodeoxyglucose. LFPI, lateral fluid percussion injury.
All animals were supplied with 100% oxygen throughout the study while anesthetized with urethane. There was no systematic relationship between apneic and loss of consciousness times and individual physiologic variables. All Pearson correlations were not statistically significant and ranged from r = −0.23 to r = 0.31. All animals survived the injury and stimulation procedures.
CMRglc in nonstimulated animals
CMRglc levels in nonstimulated animals were determined for sham-operated and LFPI groups by placing an electrode in left vibrissa motor cortex without passing current (Table 4, Fig. 1 and Fig. 2). Electrode placement alone did not induce any increases in CMRglc. These nonstimulated controls provided baseline CMRglc values for subsequent comparison to CMRglc after stimulation. Data from sham-injured animals from the 1-hour, 1-day, and 7-day time points were pooled because there was no association between time point and ipsilateral (r = −0.56, P ≤0.32) or contralateral (r = −0.60, P ≤0.28) frontal cortex CMRglc values. Sham-injured animals exhibited uniform CMRglc between ipsilateral and contralateral frontal cortex. At 1 hour after LFPI, CMRglc in the ipsilateral frontal cortex was unchanged compared to the contralateral frontal cortex. As we have reported previously, this period of time after injury represents a transition point when the injured brain shifts from hyperglycolysis to hypoglycolysis (Yoshino et al, 1991). One day after LFPI, CMRglc in the ipsilateral frontal cortex and ventrolateral thalamus were significantly depressed by 37% (P ≤0.05) and 38% (P ≤0.07), respectively. Seven days after LFPI, CMRglc in the ipsilateral frontal cortex was depressed by 17%, but this difference was not statistically significant (P ≤0.19). This pattern of injury-induced metabolic depression is consistent with that previously reported by our laboratory (Moore et al., 2000; Yoshino et al., 1991).
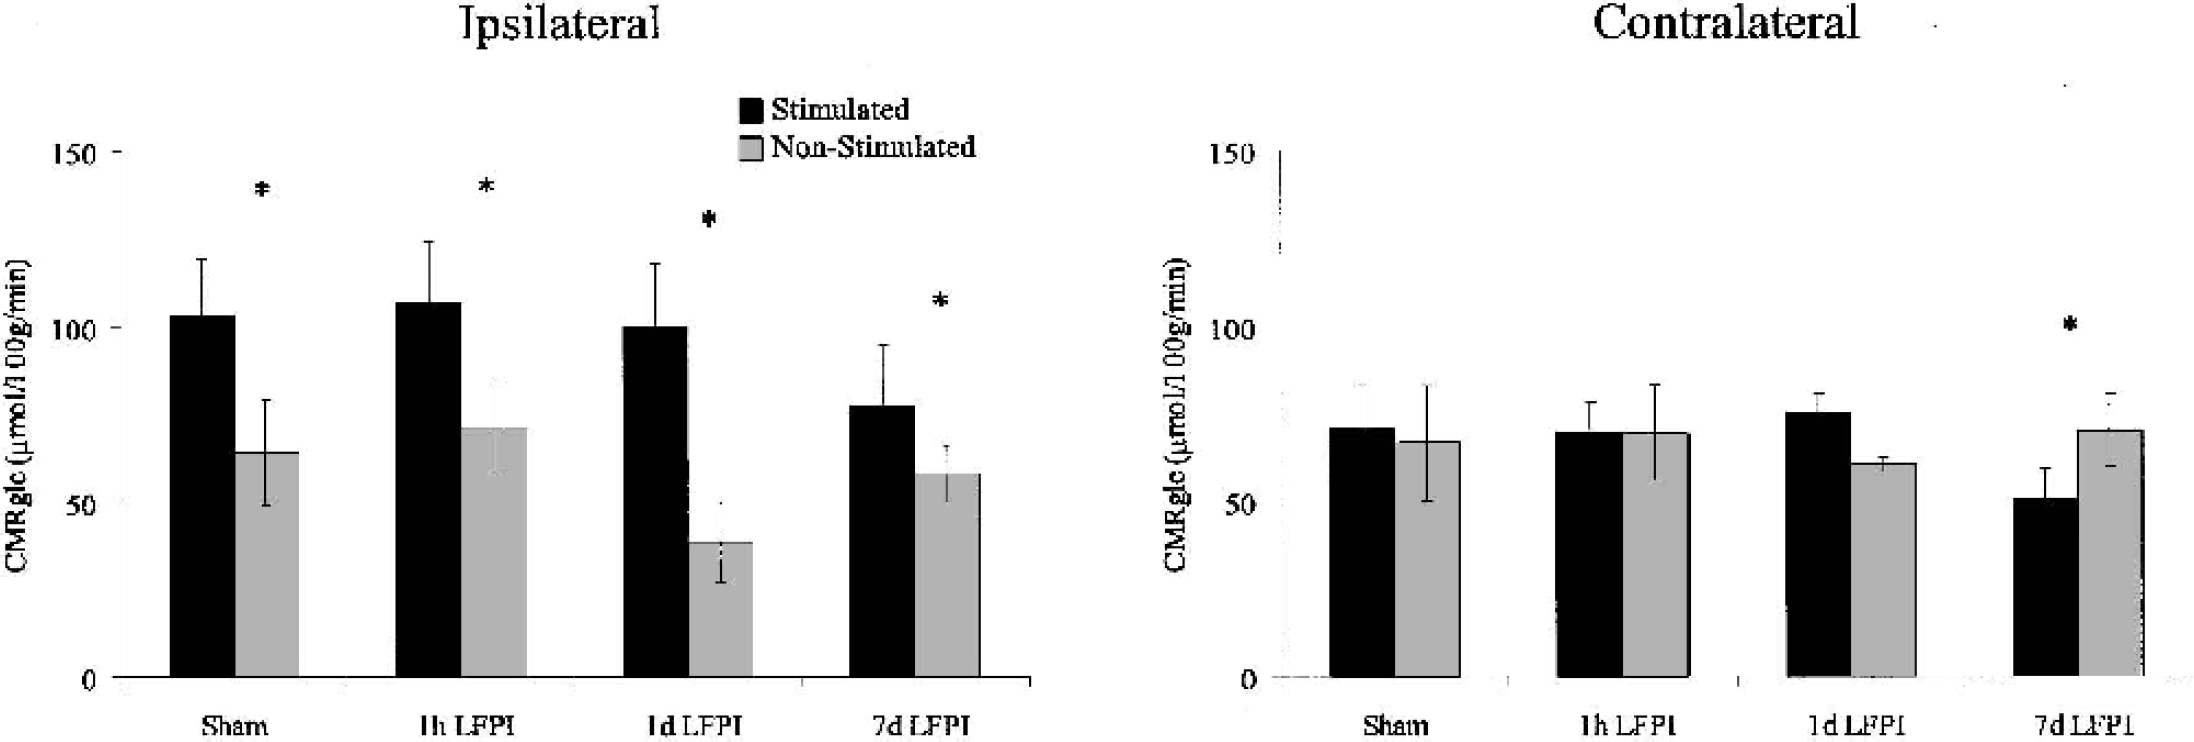
Mean (±SD) cerebral metabolic rate for glucose (CMRglc) in ipsilateral and contralateral frontal cortex. Rates are shown for sham and lateral fluid percussion injury (LFPI) groups at 1 hour, 1 day, and 7 days after injury. Black bars indicate stimulated groups, whereas the gray bars indicate nonstimulated groups. Vibrissa motor cortex stimulation induced a significant increase in CMRglc in frontal cortex ipsilateral to injury and stimulation compared with nonstimulated controls. The greatest relative increase in CMRglc in response to stimulation was observed in the 1-day LFPI group. Although there was no overall significant change in CMRglc in frontal cortex contralateral to injury and stimulation compared with nonstimulated controls, the 7-day LFPI group exhibited a significant decrease in contralateral frontal cortex CMRglc after stimulation.
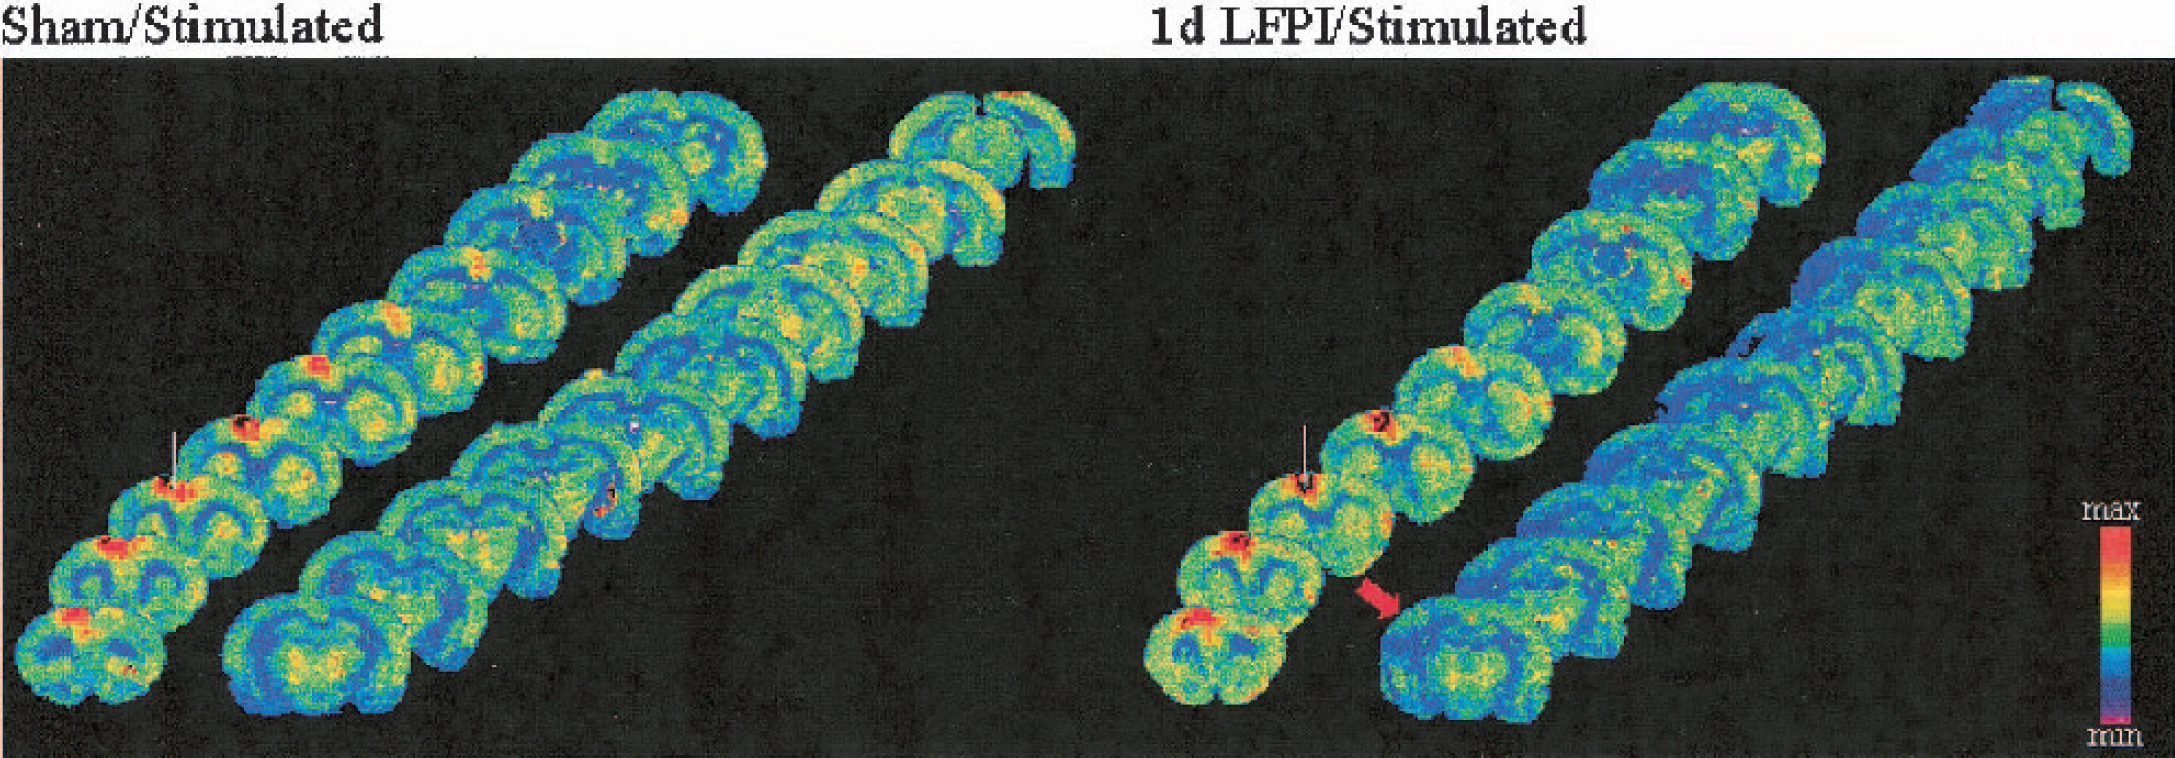
Coronal [18F]-fluorodeoxyglucose autoradiographs at 500-μm intervals taken from representative sham/stimulated and 1-day lateral fluid percussion injury (LFPI)/stimulated cases. Note the focal increase in the cerebral metabolic rate for glucose (CMRglc) in frontal cortex near the stimulating electrode (white line) in both cases and the metabolic depression ipsilateral to injury in the 1-day LFPI/stimulated case. The red arrow indicates the site of the fluid pulse.
Mean (±SD) CMRglc (μmol · 100 g · min−1) infrontal cortex and ventrolateral thalamus after sham or LFPI and no stimulation (nonstimulated) or stimulation (stimulated) ∗
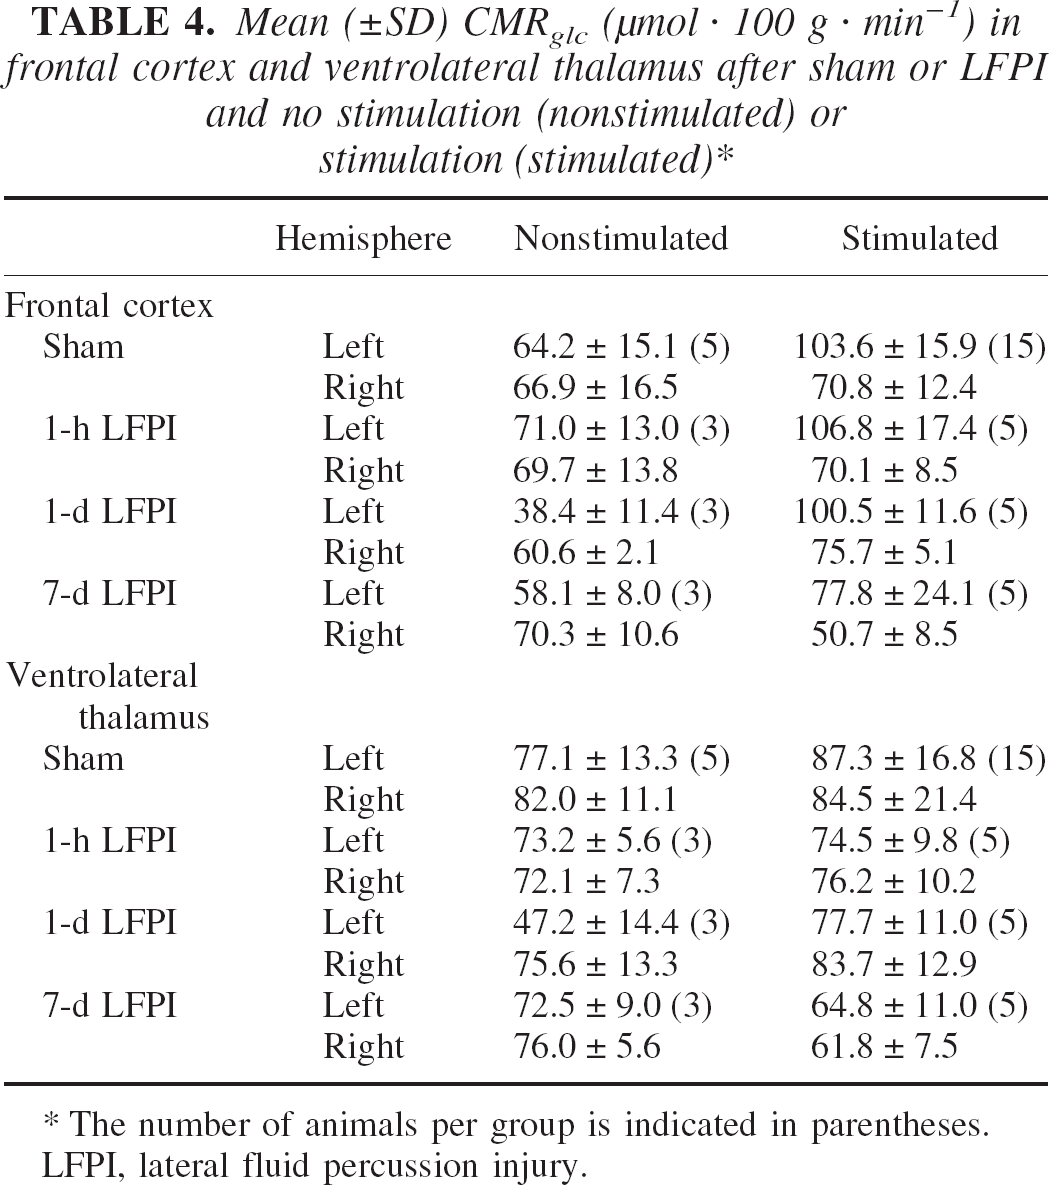
The number of animals per group is indicated in parentheses.
LFPI, lateral fluid percussion injury.
CMRglc after vibrissa motor cortex stimulation
CMRglc values in stimulated animals were determined for sham and LFPI groups by placing an electrode in left vibrissa motor cortex and passing current (Table 4, Fig. 1 and Fig. 2). Vibrissa motor cortex stimulation induced a focal area of increased CMRglc, with maximal increases around the electrode. The most pronounced CMRglc increases as a result of stimulation occurred in the frontal cortex at the site of electrode placement. This increased activity was consistently observed in all animals and incorporated the entire thickness of the cerebral cortex. In general, the increased CMRglc was more pronounced anterior than posterior to the stimulation site. However, there were no differences between the extent of activated cortex medial to lateral. More importantly, the general pattern of FDG uptake was not remarkably different between LFPI and sham-injured groups (Fig. 2). Data from sham-injured animals from the 1-hour, 1-day, and 7-day time points were pooled because there was no association between time point and ipsilateral (r = 0.35, P ≤0.20) or contralateral (r = 0.19, P ≤0.51) frontal cortex CMRglc values, nor could any differences be detected using multiple independent t-tests. Vibrissa motor cortex stimulation induced a significant increase in CMRglc (77.8 to 106.8 μmol·100 g−1·min−1) in the ipsilateral compared to the contralateral frontal cortex in all groups (F1,26 = 128.5, P ≤0.001). Furthermore, there was no significant difference in the absolute metabolic response to stimulation between groups (F3,26 = 0.93, P ≤0.44). Even though the activation of the vibrissa motor cortex resulted in a detectable whisker twitch, this activation did not induce any change in CMRglc in ipsilateral ventrolateral thalamus CMRglc, compared to contralateral ventrolateral thalamus (F1,26 = 0.07, P ≤0.78) in sham-injured controls.
Although there was no overall main effect across groups in terms of the absolute CMRglc response to vibrissa motor cortex stimulation, an independent t-test suggested that there was a reduction 7 days after injury compared to sham (P ≤0.01). In contrast to the absolute levels of CMRglc, the relative increase in CMRglc ranged from 34% to 61% in the sham-injured, 1-hour, and 7-day LFPI groups with the 1-day LFPI group exhibiting a 161% increase during stimulation.
In the contralateral frontal cortex, stimulation generally resulted in higher CMRglc compared with nonstimulated controls; however, there was no significant overall effect of stimulation in the contralateral hemisphere (F1,10 = 0.01, P ≤0.93). In the sham-injured, 1-hour, and 1-day LFPI groups, CMRglc was 1% to 25% higher in the contralateral frontal cortex compared with nonstimulated controls. In contrast, the contralateral CMRglc values for the 7-day LFPI group after stimulation were uncharacteristically low; therefore, the comparison between the 7-day LFPI stimulated group and the 7-day LFPI nonstimulated group revealed a 28%decrease in CMRglc (P ≤0.05).
Activation volume after vibrissa motor cortex stimulation
The volume of cortex exhibiting a 10% or greater increase in CMRglc was compared between sham and LFPI groups at 1 hour, 1 day, and 7 days after injury (Fig. 3). At 1 hour, activation volume in the LFPI group was not different compared to the sham-injured group (LFPI: 271.9 ± 131.5 mm3; sham: 230.1 ± 84.2 mm3; P ≤0.57). However, at 1 day, activation volume in the LFPI group was significantly reduced compared to the sham-injured group (LFPI: 136.4 ± 46.8 mm3; sham: 237.4 ± 85.8 mm3; P ≤0.05). By 7 days, activation volume returned toward normal levels, as the 7-day LFPI group was not different compared to the sham-injured group (LFPI: 224.2 ± 67.7 mm3; sham: 196.1 ± 18.3 mm3; P ≤0.40).
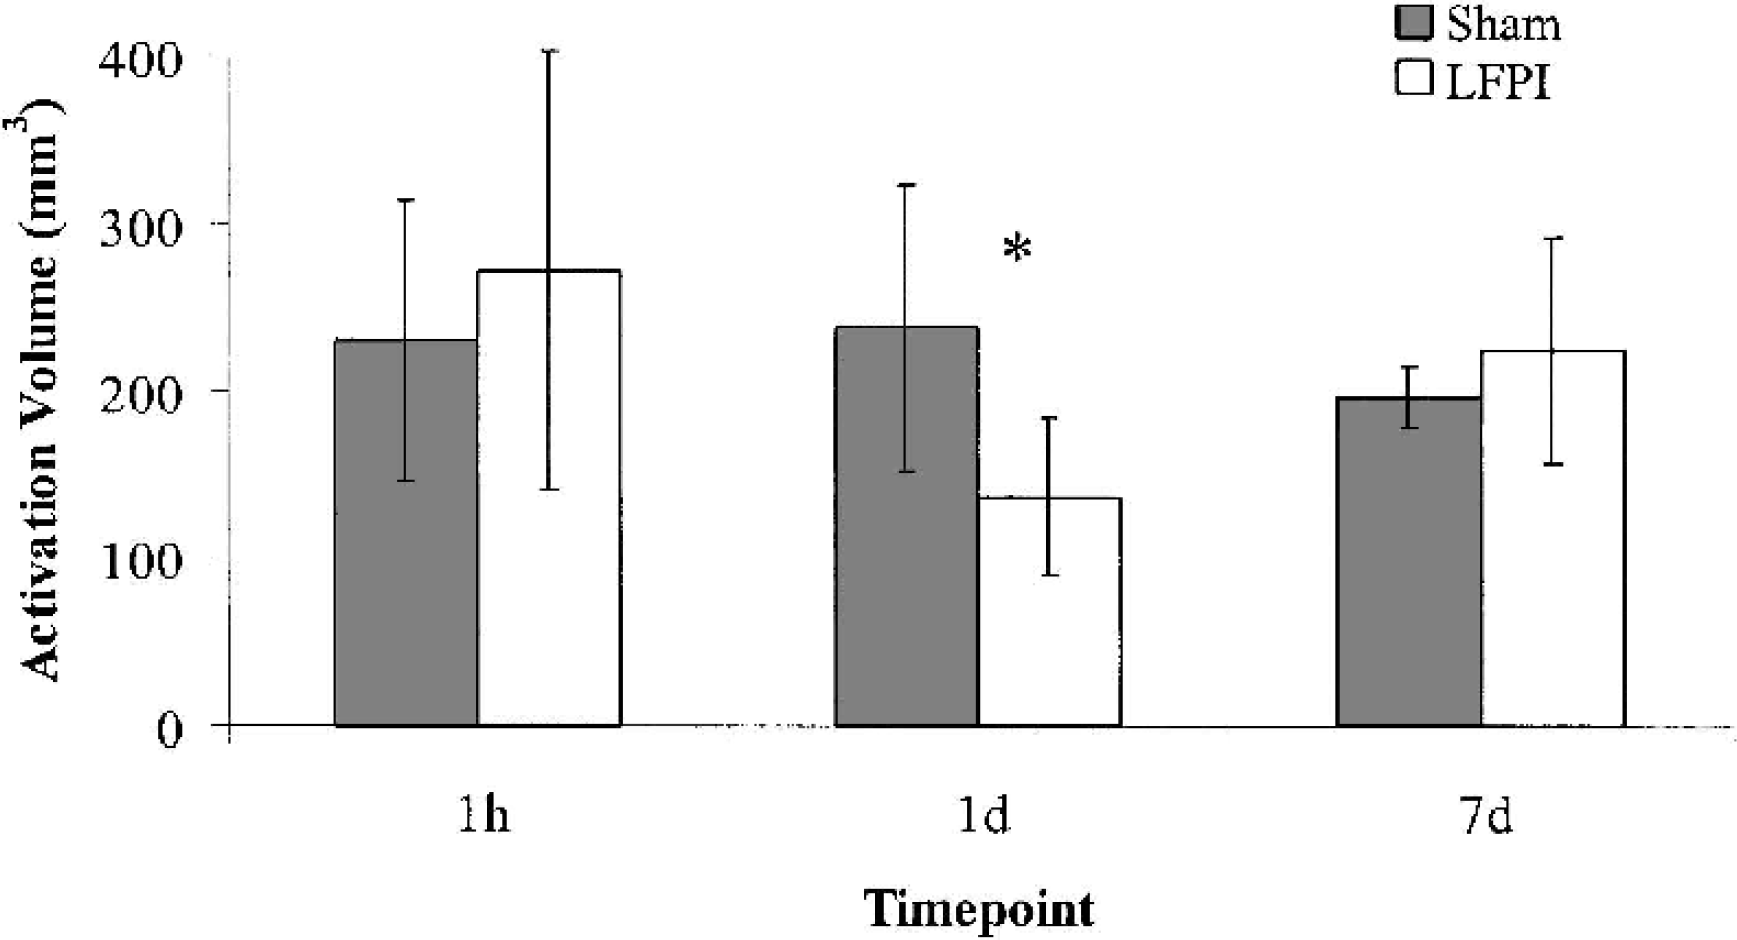
Mean (±SD) metabolic activation volume after sham/stimulation or lateral fluid percussion injury (LFPI)/stimulation at 1 hour, 1 day, or 7 days after injury. Areas of cerebral metabolic rate for glucose (CMRglc) showing an increase of 10% or more compared with the contralateral side were included in measurement of activation volume. At 1 day, activation volume in the LFPI group was reduced compared with the sham group (P <0.05). Gray bars indicate sham-injured animals, whereas white bars indicate LFPI animals.
Microdialysis
In individual microdialysis samples, glucose concentrations ranged from 0.03 to 0.25 mmol/L, and lactate concentrations ranged from 0.04 to 0.68 mmol/L. Immediately after microdialysis probe placement, extracellular lactate concentrations were high but equilibrated within 30 to 40 minutes after placement in all groups. Unlike lactate, extracellular glucose concentrations were minimally affected by microdialysis probe placement.
Changes in microdialysis glucose and lactate concentrations as a result of vibrissa motor cortex stimulation are summarized in Table 5 and Fig. 4. In sham-injured animals, vibrissa motor cortex stimulation resulted in a 24% increase in [lactate]MD with no detectable change in [glucose]MD. In 1-day LFPI animals, stimulation elicited a 17% decrease in [glucose]MD and a 55% increase in [lactate]MD. In 7-day LFPI animals, stimulation elicited no detectable change in [glucose]MD and a 63% increase in [lactate]MD. Although there were no significant differences in [lactate]MD among all groups, there was a significant between-group difference based on injury (P ≤0.05), indicating that after LFPI at either time point, more lactate was produced in response to stimulation. This suggests that more anaerobic glycolysis is required when the brain is activated after LFPI and complements our finding that, in general, extracellular glucose is markedly reduced after LFPI (F2,16 = 3.44, P ≤0.06).
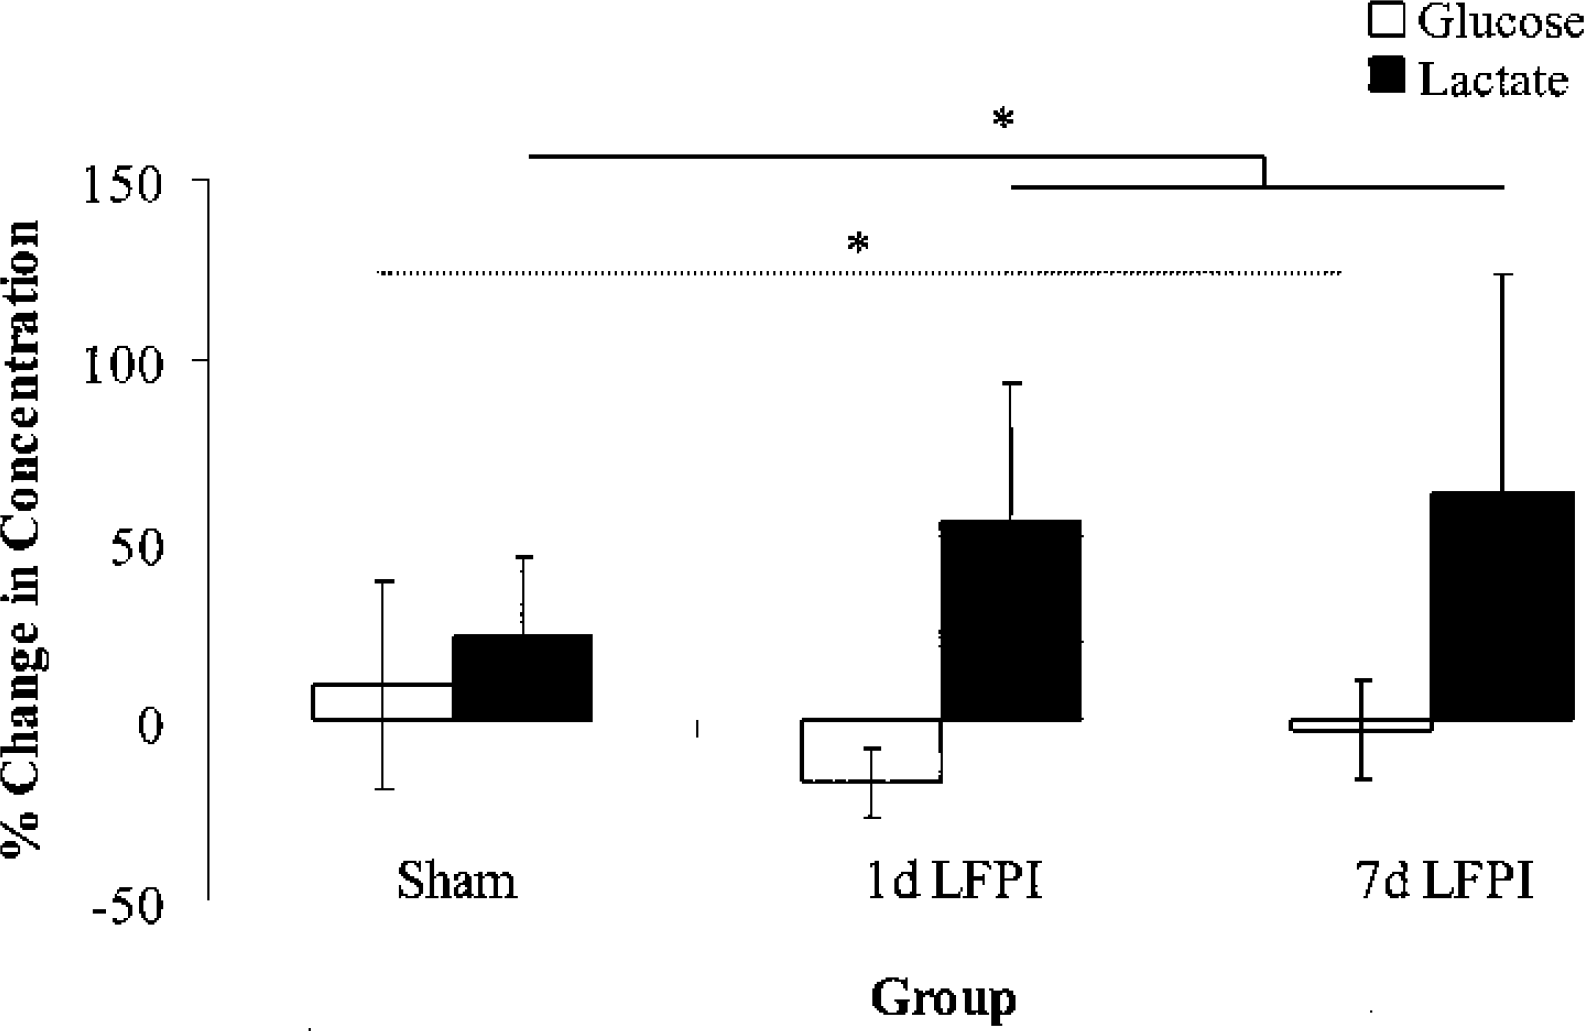
Percentage changes (±SD) in extracellular glucose and lactate concentrations after vibrissa motor cortex stimulation. Stimulation-induced changes in extracellular glucose concentrations were significantly different between groups (F2,16 = 3.44, P <0.06; dotted line). Stimulation-induced changes in extracellular lactate concentrations were significantly different between groups based on injury (P <0.05; solid line). White bars indicate changes in glucose concentrations, whereas black bars indicate changes in lactate concentrations. LFPI, lateral fluid percussion injury.
Mean (±SD) microdialysis sample concentrations for glucose and lactate before (baseline) and during cortical stimulation
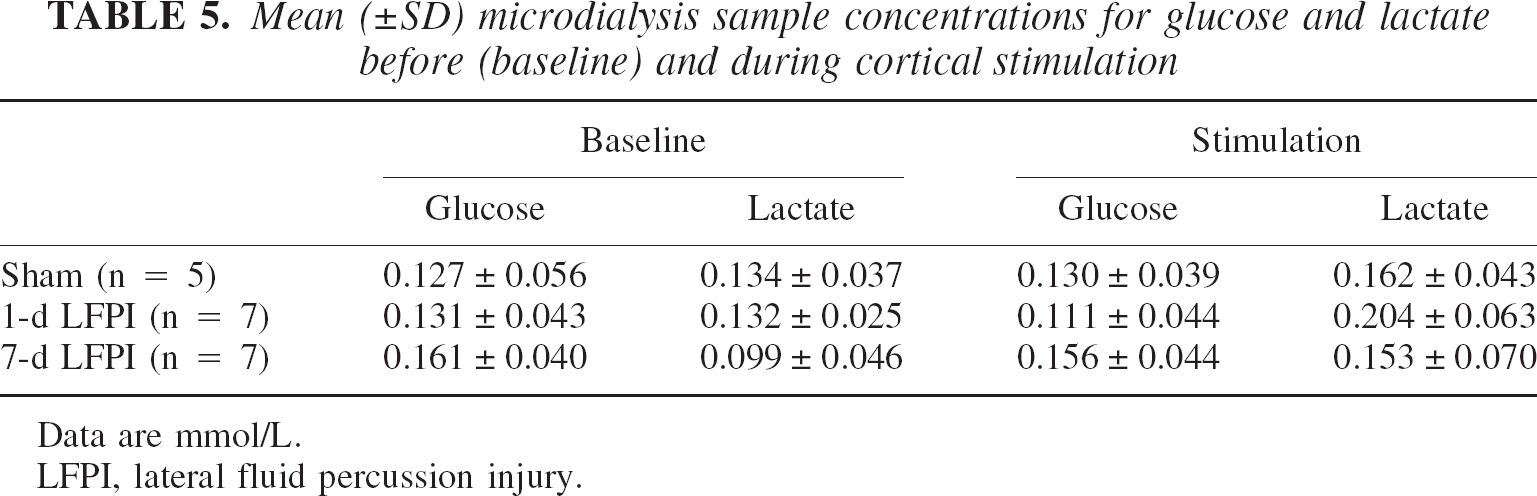
Data are mmol/L.
LFPI, lateral fluid percussion injury.
Histology
Histologic evaluation of cresyl violet-stained sections under light microscopy revealed a tract of cell loss corresponding to the site of stimulating electrode placement (Fig. 5). The affected cortical areas surrounding the stimulating electrode were quantified and compared between sham and LFPI groups (Fig. 6). Because the lesion volumes for the sham-injured and 7-day LFPI groups were similar (sham: 32.3 ± 22.5 mm3 (mean ± SD); 7-day LFPI: 41.6 ± 32.9 mm3), the overall difference between groups was not statistically significant (F2,17 = 1.95, P ≤0.17). However, an independent-samples t-test between sham-injured and 1-day LFPI groups revealed a significant difference (1-day LFPI: 61.0 ± 18.3 mm3; P ≤0.05).
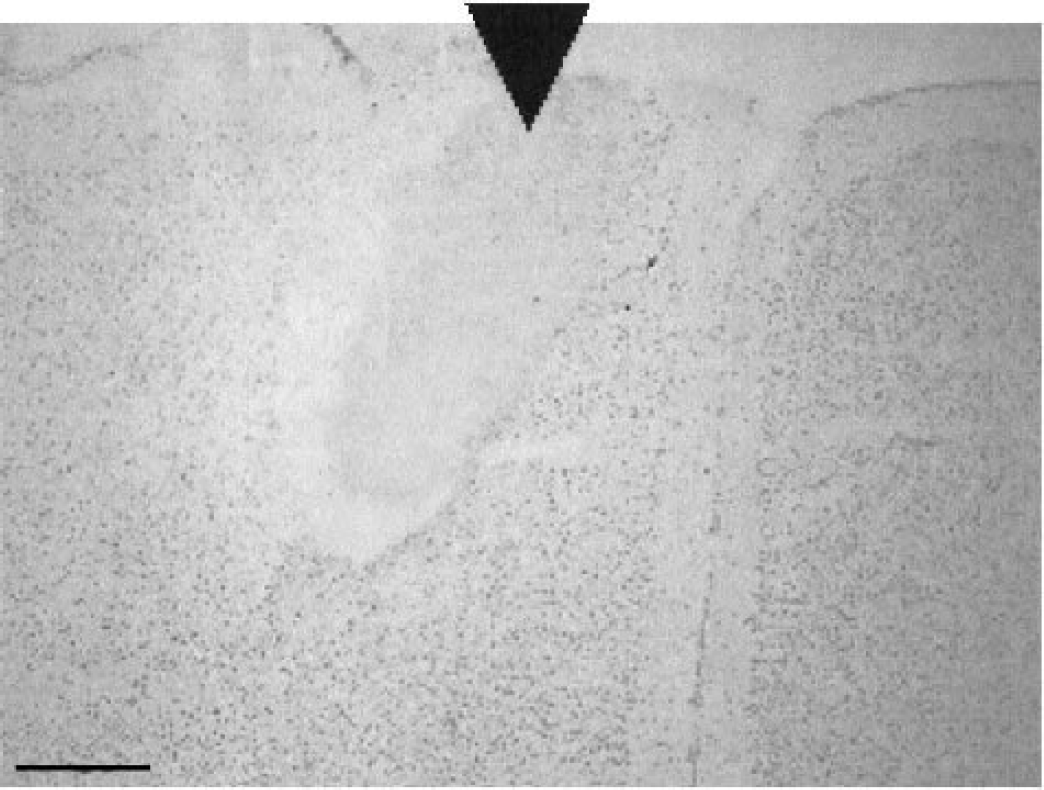
Cresyl violet-stained section from a representative sham/stimulated case. Note the tract of cell loss corresponding to placement of the stimulating electrode, indicated by the black arrowhead. Scale bar = 500 μm.
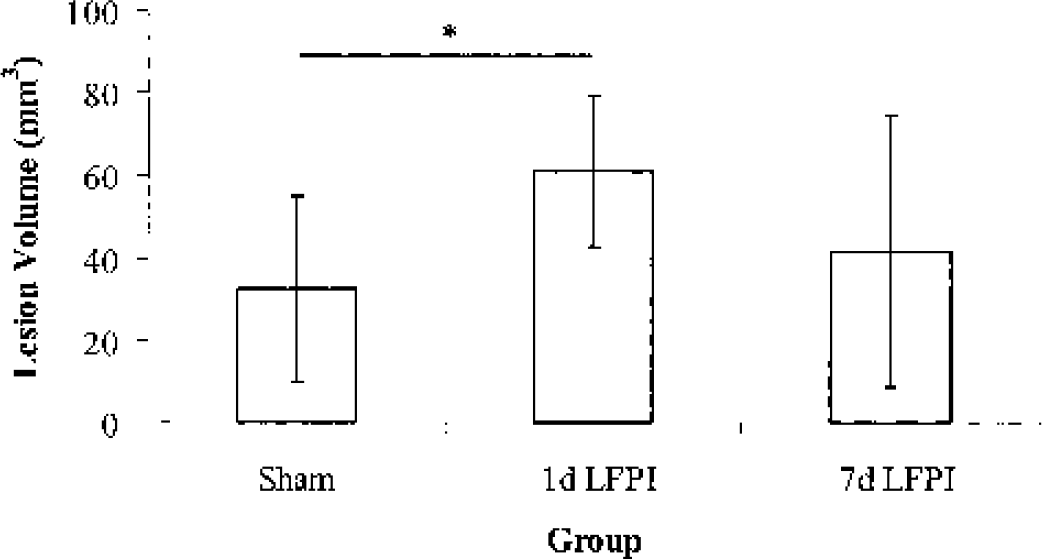
Lesion volumes (±SD) after vibrissa motor cortex stimulation. The sham and 7-day lateral fluid percussion injury (LFPI) groups exhibited similar lesion volumes. The 1-day LFPI group exhibited a significantly greater stimulation-induced lesion volume compared with the sham-injured group (P <0.05).
DISCUSSION
The present study demonstrates that, after a LFPI, the cortex can be activated electrophysiologically and metabolically with direct electrical stimulation. This activation, resulting in appropriate whisker movement, also resulted in an increase in anaerobic glycolysis and a corresponding increase in stimulation-induced lesion volume, which varied depending on time after LFPI. As shown in Fig. 2, the activation pattern in the frontal cortex was similar between the sham and 1-day LFPI cases. In more caudal areas of cortex, metabolic depression in the left hemisphere ipsilateral to injury was apparent in the 1-day LFPI case. However, in the rostral areas of cortex, metabolic depression in the left hemisphere ipsilateral to injury was not apparent in the 1-day LFPI case. Although the precise mechanism(s) responsible for this lack of depression is not understood, certainly factors relating to spread of current from the stimulating electrode or to activation of horizontal intracortical connections within the motor cortex must be considered.
Whereas the absolute CMRglc response to vibrissa motor cortex stimulation was not increased in the LFPI groups, the relative increase in CMRglc was greatest at 1 day after LFPI due to the marked injury-induced metabolic depression. Consequently, in these animals, stimulation resulted in a 161% increase in CMRglc over the resting rate. This remarkable increase was, however, restricted to a smaller area of the cortex. Both the stimulation-induced increase in glucose metabolism and the decrease in area affected may have physiologic implications. Although one could propose that these differences in the metabolic response to stimulation were attributed to differences in stimulation or anesthesia parameters, measurements of these parameters did not reveal any support for these hypotheses.
Along with the change in metabolic rates within the ipsilateral (stimulated) cortex, the pattern of activation was altered during stimulation after LFPI. As noted previously, the area of the cortex exhibiting increased CMRglc in the 1-day LFPI group was reduced compared with sham-injured controls. Because direct physiologic recording was not conducted to map out the area of activation (Schiene et al, 1999), these changes in activation area may only represent the limitation of autoradiography. Conversely, if the region of interest as detected by autoradiography is accurate, the difference may only reflect the change in response of adjacent tissue.
To determine the volume of activation, the current study used a method of thresholding based on optical densitometry measurements within sham controls, which may have biased the measurement of metabolic activation volume. For example, a 10% or greater increase in CMRglc in a metabolically depressed brain requires a smaller absolute increase in CMRglc. This would suggest that, in the metabolically depressed brain, an increase in metabolic activation volume would be easier to detect. However, the results of the present study indicate that the metabolic activation volume decreased in the metabolically depressed brain, despite this potential thresholding bias. Furthermore, it should be emphasized that the thresholding was done in an uninjured brain, whereas experimental data were collected in a brain that had sustained an LFPI. Therefore, the value obtained (10%) may have been altered due to the insult.
In addition to these differences seen in the ipsilateral cortex, the contralateral cortex also exhibited some unique responses to stimulation. The metabolic response to stimulation in the contralateral cortex was not different between sham and 1-day LFPI groups; however, in the 7-day LFPI group, the absolute frontal cortex CMRglc values were unusually low. Although the ipsilateral frontal cortical response to stimulation appeared to recover by 7 days after injury, the contralateral frontal cortex may continue to exhibit alterations in response to stimulation beyond the 7-day time point. Whether this represents a loss of commissural fibers over time remains to be determined.
The metabolic response to cortical stimulation, as detected using FDG autoradiography, was confirmed by the results of neurochemical studies during stimulation. The changes in extracellular glucose and lactate concentrations after stimulation support the conclusion that the increases in glucose uptake resulted in an increase in glucose metabolism. LFPI animals exhibited a larger increase in extracellular lactate and a decrease in extracellular glucose compared with sham-injured controls, indicating that the tissue involved responded to stimulation by increasing anaerobic glycolysis. Such a response would suggest that after injury, cells appear to be more dependent on anaerobic glycolysis to meet additional energy demands.
The decrease in extracellular concentration of glucose associated with stimulation after injury may signal that fuel capacity is low, particularly in animal studies at 1 day after LFPI. Furthermore, these injured animals exhibit a large increase in extracellular lactate during cortical stimulation, which may suggest an energy crisis similar to what is seen during cerebral ischemia. Taken together with the well-described loss in coupling between cerebral blood flow and metabolism (Ginsberg et al., 1997; Jiang et al., 2000) along with the evidence for mitochondrial dysfunction after injury (Jiang et al., 2000; Vink et al., 1990), these neurochemical findings during direct cortical stimulation would have implications for cell survival. As reported in the current studies, at 1 day after LFPI direct cortical stimulation results in a 100% increase in stimulation-induced lesion volume.
Response to activation after traumatic brain injury
In vitro studies have shown that after TBI, electrophysiologic responses and cellular excitability are impaired (Miyazaki et al., 1992; Reeves et al., 1995, 2000; Sanders et al., 2000; Sick et al., 1998). Furthermore, in vivo studies indicate that evoked potentials and sensorimotor reactivity are also abnormal (DeSalles et al., 1987; Shaw, 1986; Wiley et al., 1996). Consequently, it is not surprising that the cerebral metabolic responsiveness to somatosensory circuit activation via vibrissa stimulation is depressed in the ipsilateral trigeminal medullary complex, contralateral ventrobasal thalamus, and primary somatosensory cortex in rats up to 2 months after LFPI (Dietrich et al., 1994; Passineau et al., 2000). This reduction in metabolic responsiveness has been attributed to TBI-induced structural damage to neurons and white matter tracts (Dietrich et al., 1994; Taft et al., 1992). Consequently, the failure of a metabolic response to somatosensory circuit activation may merely reflect a disruption of subcortical connectivity because there is no direct measurement of cellular response of the barrel-field neurons to peripheral stimulation (Passineau et al., 2000).
Circumventing this potential confounding variable of injury-induced damage, the current study employed direct somatosensory cortex stimulation using visual confirmation of a whisker response to assure connectivity. Given that this direct stimulation resulted in an increase in FDG uptake, this suggests that if cells are activated after TBI, they will utilize glucose to satisfy their energy requirements. However, compared with uninjured animals, this postinjury cortical stimulation puts a greater strain on the metabolic capacity of the activated tissue. This conclusion is based on the observation that after TBI, the brain exhibits a remarkable degree of metabolic depression. Consequently, any induced increase of glycolysis, even if it is not abnormally high in terms of absolute rates, must be initiated from a lower baseline. Therefore, this results in a greater degree of change in glycolysis, which was confirmed in the current neurochemical data in which activated tissue resulted in a marked decrease in extracellular glucose and a corresponding increase in lactate.
This type of metabolic and corresponding neurochemical response after TBI has often been associated with secondary injuries resulting in additional cell loss. It is well documented that the traumatically injured brain is particularly vulnerable to secondary insults including a reduction in cerebral blood flow (Jenkins et al., 1989), hypoxia, and/or hypotension (Ishige et al, 1987; Matsushita et al., 2001). The mechanisms responsible for this injury-induced vulnerability are multifactorial. However, those most relevant to the current study include an uncoupling between blood flow and metabolism (Ginsberg et al., 1997; Jiang et al., 2000) and a reduction in oxidative metabolism (Hovda et al., 1991; Jiang et al., 1999, 2000; Vink et al, 1988), both of which may contribute to the reported reduction in ATP (Lee et al., 1999). Given that these factors suggest the brain is in a state of energy crisis after TBI, it is not surprising that an added energy demand induced by direct cortical activation can, as demonstrated in the current study, result in additional cell loss.
Footnotes
Acknowledgments
The authors thank Dr. Richard Sutton for reviewing the text.